
Over the past few months, we've built out our business spreadsheet library one workbook at a time. Thirty templates and a stack of persona-themed bundles covering the finance basics, daily operations, planning, industry-specific models, freelancer and agency tools, and real estate. Almost all of them work in Excel and Google Sheets.
It started with a whiteboard and one question: what does a small business owner actually need from a spreadsheet, beyond the cash flow forecast and P&L we’d already shipped?
The list got long. Way longer than we expected. So we did the only reasonable thing: we stopped trying to ship it all in one big release and just started building, one workbook a week. A bookkeeping ledger in March. KPI dashboard the week after. Restaurant model. SaaS metrics. Real estate underwriting. By the time we looked up, it was thirty workbooks and a stack of bundles deep.
Time to write it all down in one place.
How these are built
Open any of the new workbooks and you’ll find the same skeleton underneath: a dashboard up top, two or three data sheets where you actually do the typing, one or two derived views that build themselves from the data, and a settings sheet that controls the rest. No macros. No add-ons. No setup wizard that asks you twenty questions before you can start.
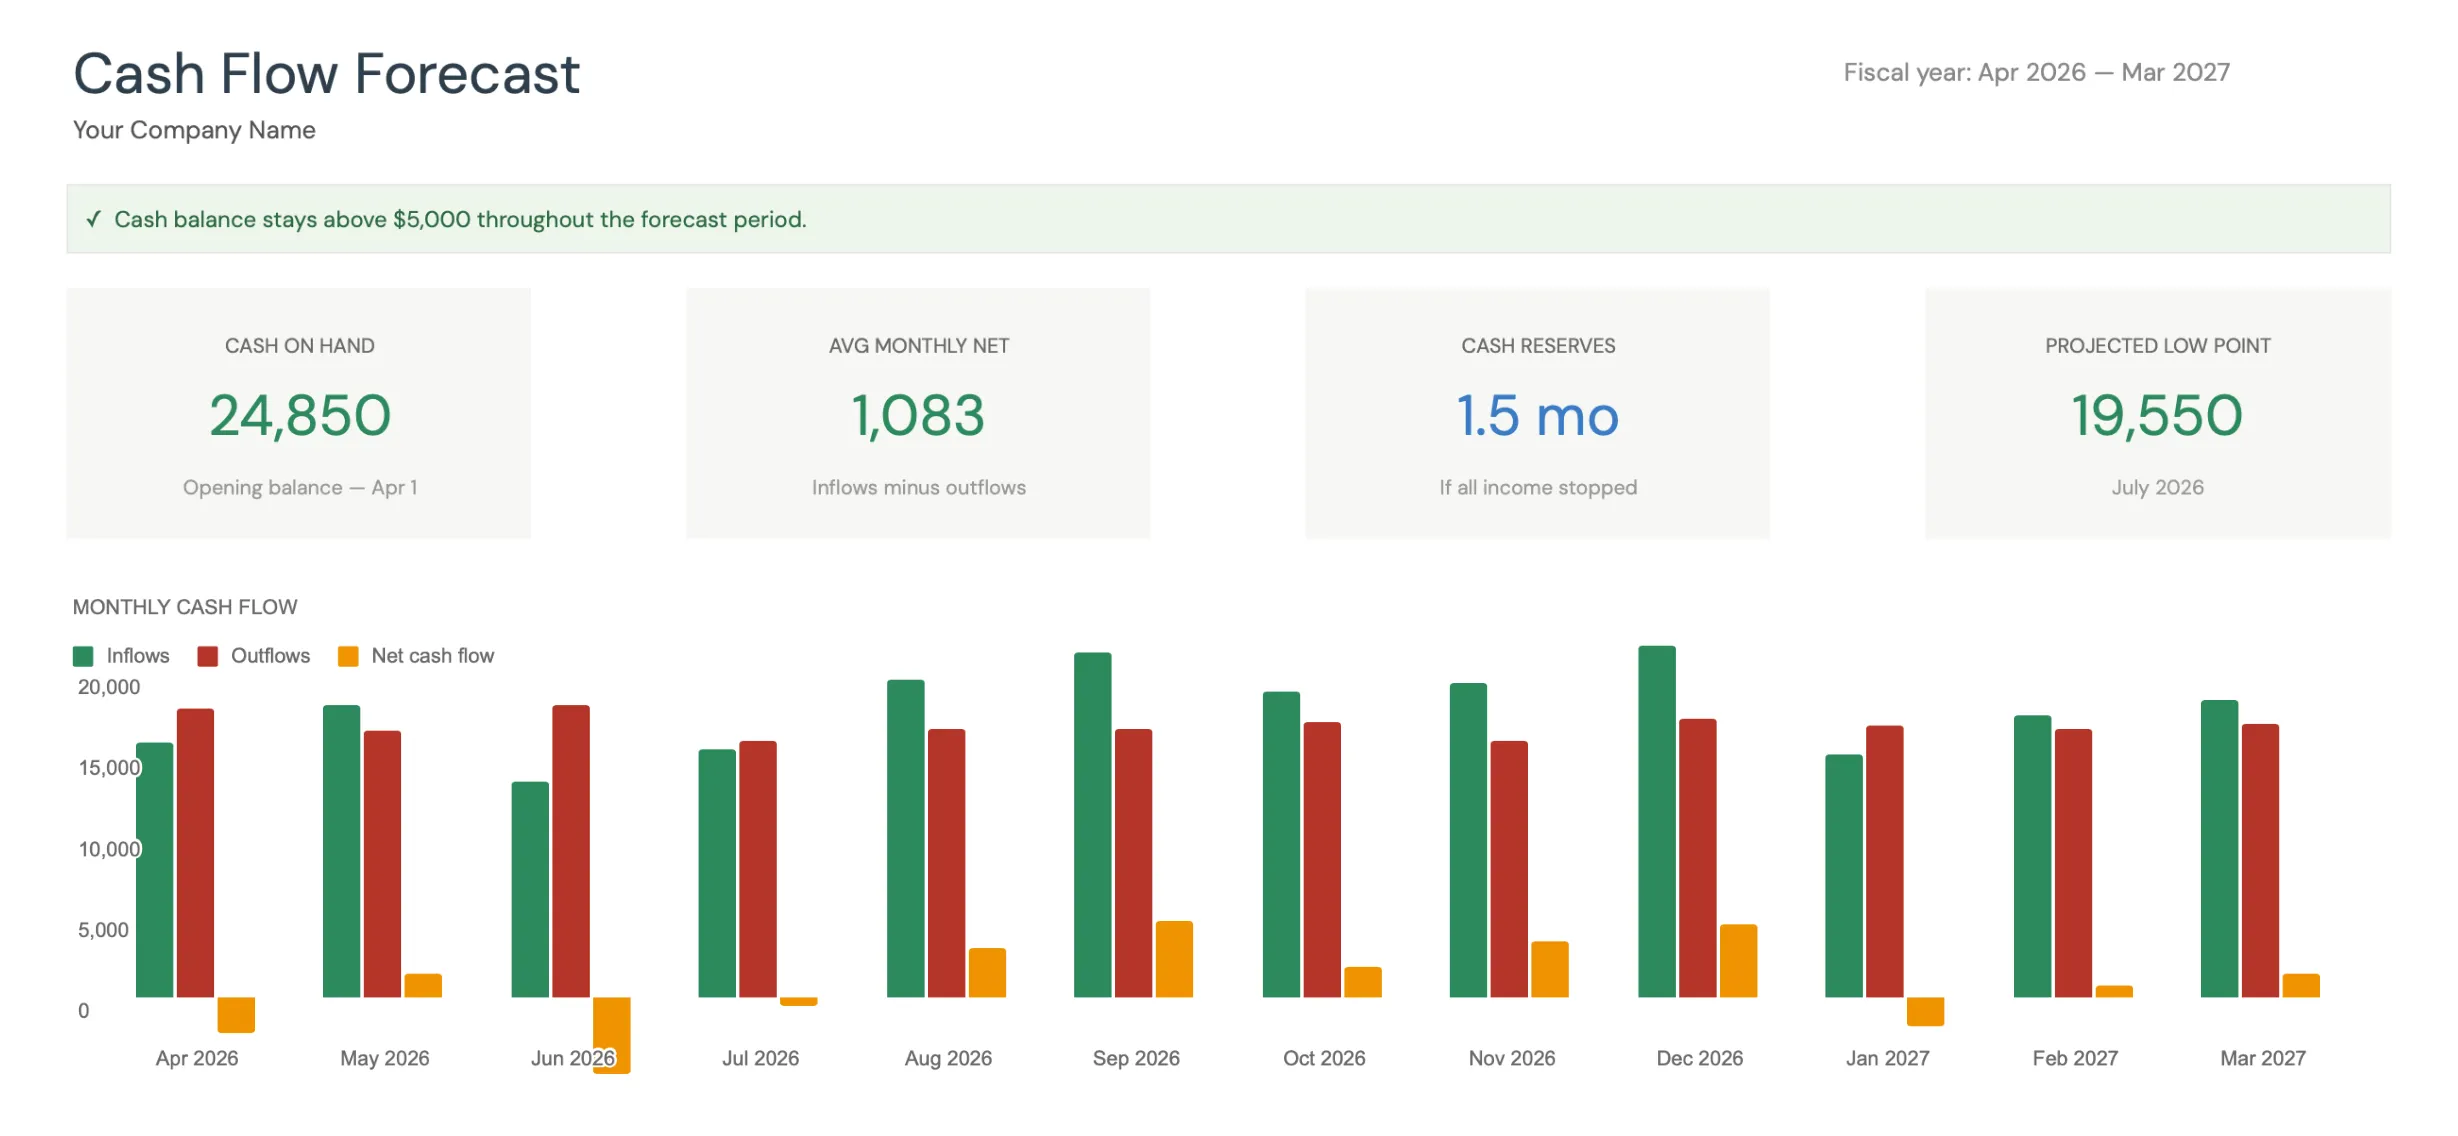 The dashboard tab of the Cash Flow Forecast (Premium business template). Every business workbook opens on a summary view like this, with the data sheets underneath.
The sample data is already populated. That part matters more than it sounds. You can see exactly how the formulas behave before you put your own numbers in. When something looks wrong later, you have a working version to compare against.
Excel works. Google Sheets works. The formulas were written to stay inside the subset that survives both apps, so dragging the .xlsx into Drive and opening with Sheets carries everything across: charts, formatting, calculations. Nothing rebuilds itself wrong. The one exception in this library is the Cash Flow Forecast, which ships as a Google Sheet rather than an .xlsx.
Here’s the library.
Business finance
The everyday accounting stack. Cash flow, the three statements, daily books, who-owes-what, and an annual tax view.
- Cash Flow Forecast - Twelve-month forecast of inflows and outflows with a mirrored Actual sheet, best / expected / worst case assumptions on the Scenarios sheet, and a closing balance carried month to month. Google Sheets only. The workbook we ship first when someone says “I have no idea if I can make payroll next month.”
- Profit & Loss Statement - Monthly and annual P&L with a category-level expense breakdown. Gross, operating and net margins calculate themselves, and the Variance sheet sets forecast against actual by category and by month.
- Balance Sheet - Assets, liabilities, equity, all reconciled. Includes a working-capital view because that’s what you actually look at most weeks.
- Bookkeeping - Single-entry transaction ledger. Type every income and expense once and a chart of accounts, P&L summary, and 12-month trend build themselves. The bridge between “I just export from the bank” and “I should probably use QuickBooks.”
- AR / AP Tracker - Who owes you, who you owe, with aging buckets (current, 1-30, 31-60, 61-90, 90+) deriving from invoice and bill dates. Past ten customers, this stops being optional.
- Business Tax Tracker - Annual tax overview that pulls deductible expenses across categories, each with its own deductible percentage. The Tax Summary walks gross income down through deductions to federal, self-employment and state tax, and quarterly estimated payments get their own sheet with due dates. Pairs naturally with the Annual Tax Planner on the quarterly side.
Business operations
The daily mechanics. Budgeting, invoicing, paying people, tracking what you bought.
- Monthly Business Budget - Plan the month, log what actually happened, see the variance. Budget by category, with a dashboard summary.
- Annual Business Budget - Wider frame: Year 1 by category, then Years 2 and 3 grown from the year-over-year drivers you set, with CAGR and a conservative / base / aggressive scenario range. Useful for the conversation with whoever signs off on the years ahead.
- Invoice Generator & Tracker - Log each invoice on the register and status runs itself: draft, sent, partial, overdue, paid. A fillable single-invoice sheet sits alongside for printing, and the Aging sheet buckets what is still outstanding by client.
- Payroll Tracker - Multi-employee payroll log with gross, net, employer taxes, YTD totals. Not a payroll service, but the workbook you reach for when you’re double-checking what Gusto sent.
- Expense Report - Submitting expenses or receiving them. Categories, totals, per-category spending caps, and the split between what is reimbursable and what already went on the company card.
- Inventory Management - SKU-level inventory with reorder points and stock-on-hand. The version that actually warns you before you run out, not after.
Business planning
Where the questions stop fitting on a single sheet. KPIs, projections, break-even, forecast, valuation.
- KPI Dashboard - Define your KPIs once in the registry, log a monthly actual and a monthly target for each, then watch the composite score trend and which categories are sitting below target. The dashboard you actually look at on Monday mornings.
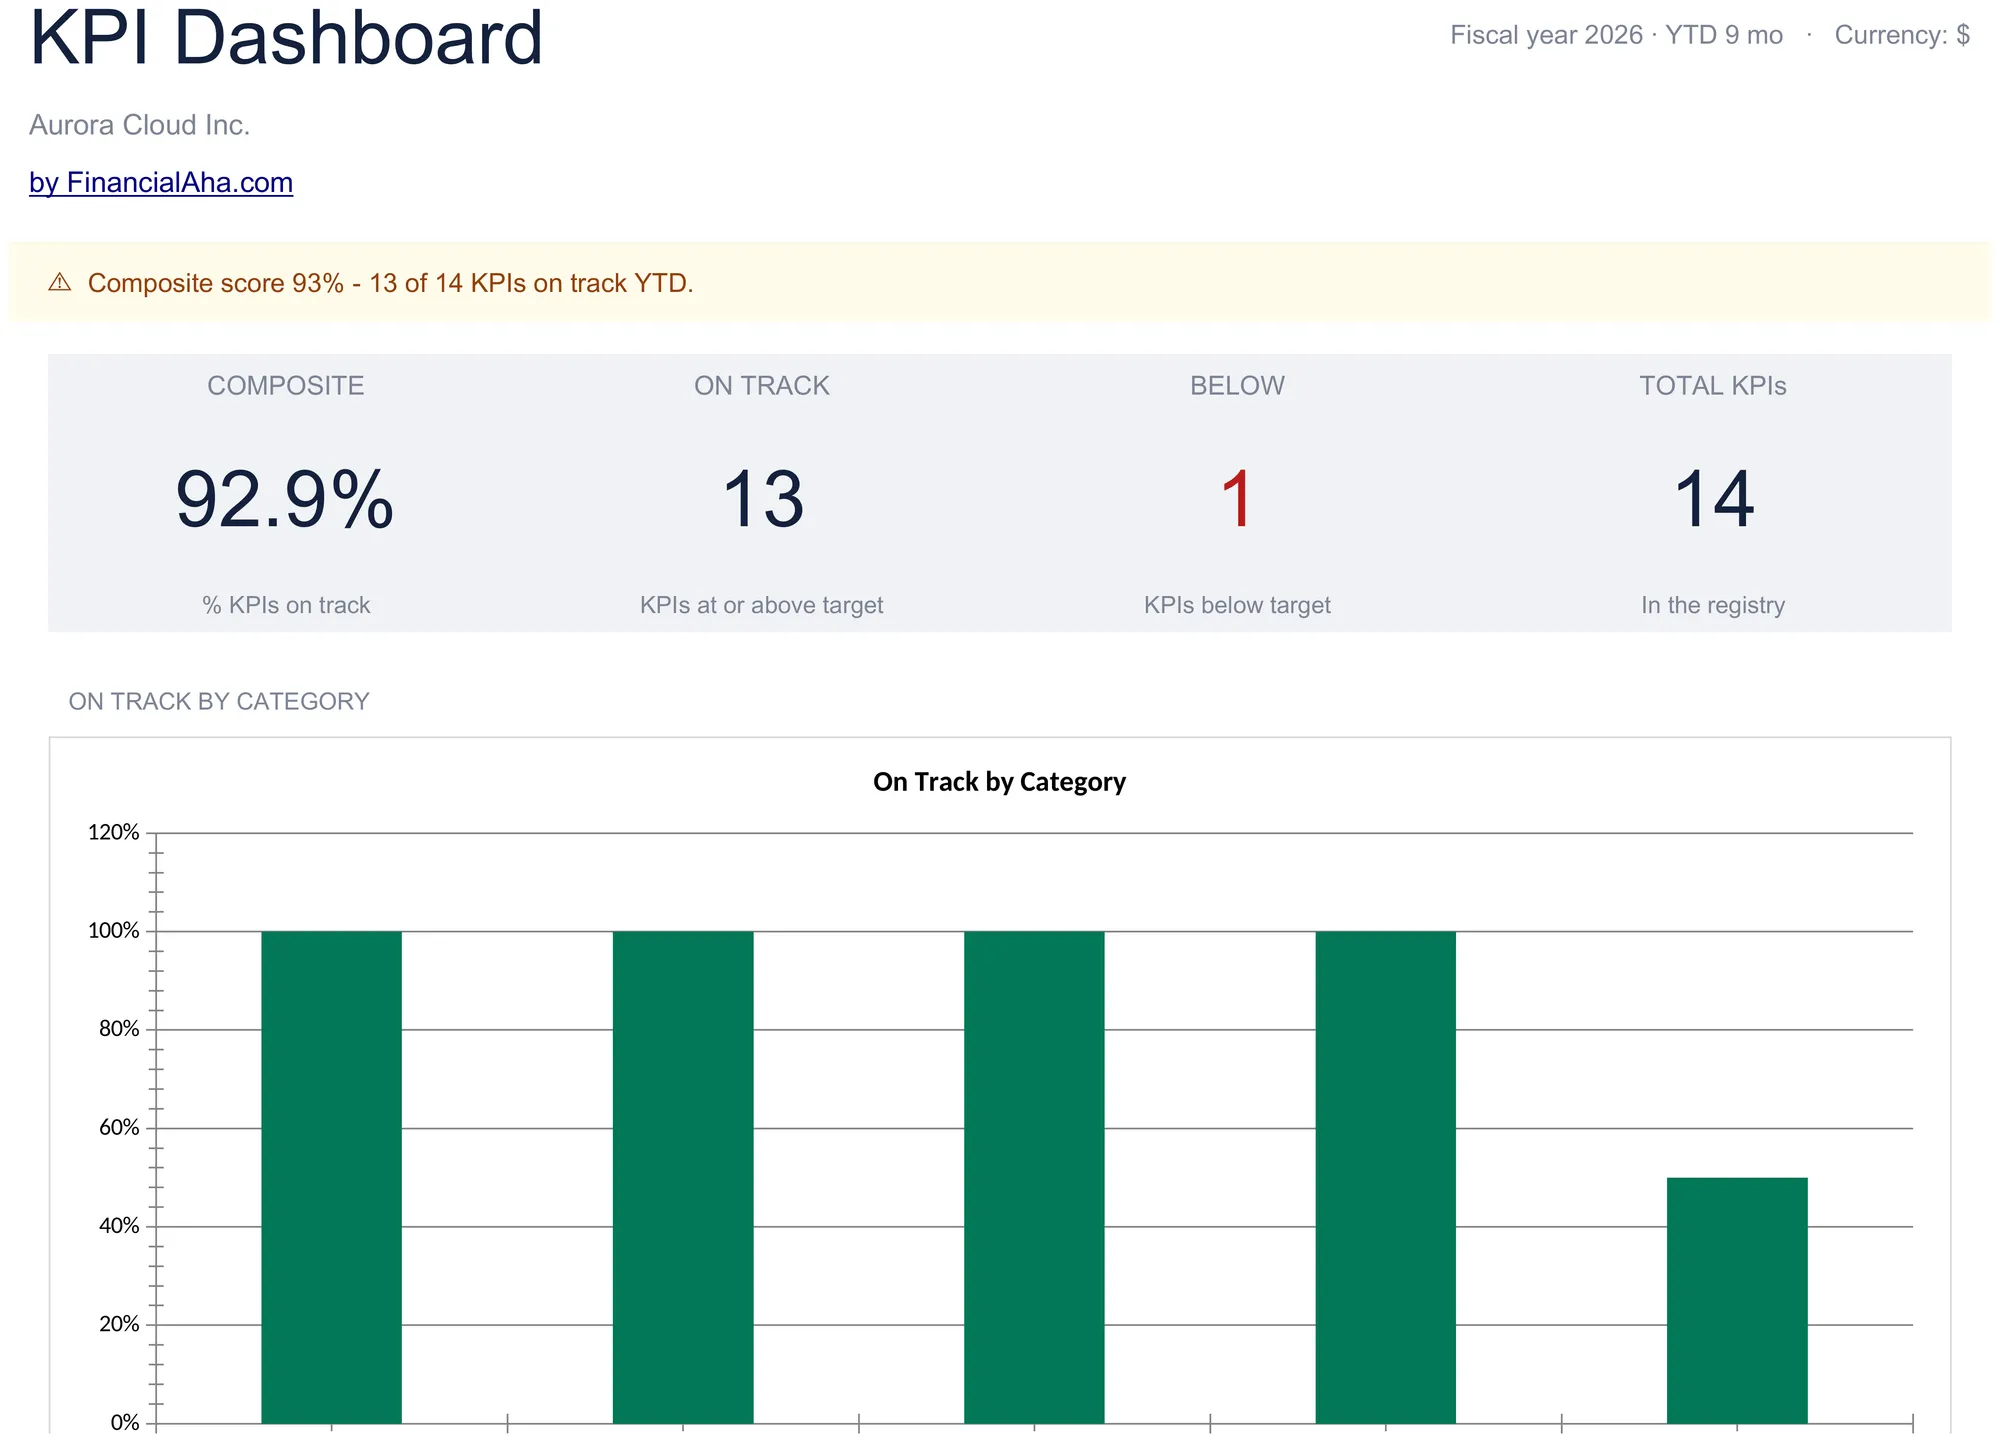 The KPI Dashboard (Premium business template) rolls every metric into one composite score and flags which categories are lagging.
- 5-Year Financial Projections - Income statement, balance sheet, cash flow, all three linked and projected out five years. The version investors ask for. Most founders build a version of this anyway; might as well start from one that’s already wired up.
- Break-Even Analysis - Fixed costs, variable costs, contribution margin, break-even quantity. The sensitivity view walks price, variable cost and fixed cost from minus 20 percent to plus 20 percent and shows what each does to break-even units. Worth keeping open during pricing conversations.
- Sales Forecasting - Twelve-month forecast grown off your own last twelve months, so seasonal months keep their shape, with a pipeline weighted by the win probability at each stage and a low / base / high confidence band. Captures the math behind “how confident are we in the number?”, which is the question that actually matters, not the number itself.
- Business Valuation - DCF and multiples-based valuation in one workbook. The model you want to walk into a negotiation with, not invent on the back of a napkin while the other side is doing the same.
Industry models
These are the ones we’re most happy with. Each one captures the metrics that vertical actually runs on, not a generic P&L with relabeled rows.
- Restaurant Financial Model - Food cost percent, labor cost percent, prime cost, cover counts, ticket averages. If you’ve worked in restaurants, you know these numbers tell the whole story.
- E-commerce Financial Model - Unit economics with ad spend, CAC, AOV, contribution margin. ROAS and the LTV to CAC ratio are the two the model flags against its benchmarks, and the funnel shows which stage is losing the most people.
- SaaS Metrics & Financial Model - MRR, ARR, churn, LTV, CAC payback, net dollar retention. Investors will ask for these in roughly that order. The team should be watching them weekly anyway.
- Startup Financial Model - Twenty-four months of burn and runway with headcount-driven costs, funding rounds, and a cap table tab. Helps with the unfun conversation about dilution at the next round.
Freelancers, agencies, creators
Solo operators and tiny services firms. We spent a lot of time on this category because the existing options (one giant “freelancer template” trying to do everything) felt wrong.
- Freelancer Finance Suite - One workbook for the whole freelance business: project ledger, income and expense tracking, tax setaside, runway. The all-in-one version for people who don’t want six workbooks.
- Solo Consultant Rate & Capacity - This one was fun to build. It prices your work based on the hours you actually have, not the hours you wish you had. Takes out vacation, holiday and sick weeks first, then the admin share of whatever is left.
- Tiny Agency Capacity - Team utilization for a 2-5 person agency. Who’s overbooked, who has slack, and whether blended utilization has crossed the hiring trigger you set. Built it after talking to three agency owners who all said the same thing: “I have no idea where the time goes.”
- Creator Revenue Tracker - Multi-stream income: sponsorships, ad share, products, affiliate. Quick way to find out which stream is actually paying the bills versus which one feels like the main thing.
- Course Launch P&L - Per-launch math from audience and conversion rate down to net revenue, after refunds, payment processing and delivery costs come out. Ad spend, ROAS and break-even ROAS sit beside it, with a twelve-month evergreen baseline underneath.
Real estate
Property analysis and the financing math behind it.
- Rental Property Analysis - Long-term rental underwriting with gross rent, operating expenses, NOI, cap rate, cash-on-cash, year-one cash flow. Use it before you make an offer.
- Airbnb / STR Tracker - Per-listing short-term rental tracking. Occupancy, ADR, RevPAR, and the platform-fee and per-booking cleaning math that long-term models politely ignore.
- Commercial Property Analysis - Rent roll, NNN reimbursements, gross potential income down through vacancy to NOI, going-in and exit cap rates, and NOI per square foot. Office, retail, mixed-use.
- Mortgage Analysis - Three loans side by side, each with its own principal, rate and term. Monthly principal and interest, total interest, total paid, and a full month-by-month amortization schedule underneath. The math we wish we’d had during our last refi.
The bundles
Rather than category-mega-bundles (“here are all the freelancer templates, good luck”), we built smaller bundles around specific buyer personas. Each one is three templates that genuinely go together for a particular operator.
- Solo Freelancer Bundle - Finance Suite + Rate & Capacity + Tax Tracker. Earn, price, plan taxes.
- Agency Owner Bundle - Tiny Agency Capacity + Sales Forecasting + KPI Dashboard. Capacity, pipeline, operating metrics.
- Creator Business Bundle - Creator Revenue + Course Launch P&L + Tax Tracker. Multi-stream income, launches, 1099 planning.
- Restaurant Owner Bundle - Restaurant Model + Bookkeeping + Break-Even. The food cost, labor cost, prime cost math that drives every restaurant decision.
- E-commerce Seller Bundle - E-commerce Model + Break-Even + Sales Forecasting. Unit economics, ad-spend breakeven, twelve-month forecast.
- SaaS Founder Bundle - SaaS Metrics + KPI Dashboard + 5-Year Projections. MRR math plus the projection model investors expect.
- Startup Founder Bundle - Startup Model + 5-Year Projections + Valuation. Runway, projections, valuation for fundraising.
- Rental & STR Investor Bundle - Rental Analysis + Airbnb Tracker + Mortgage Analysis. Underwrite long-term, run short-term, compare financing.
- Commercial Real Estate Bundle - Commercial Property + Mortgage + Valuation. NOI / cap rate, financing, valuation for commercial deals.
- Small Business Books Bundle - Bookkeeping + AR/AP + Tax Tracker. Daily admin for service businesses.
We also broke up the old Business Operations Bundle (which had quietly grown to six templates, too many for one bundle to feel coherent) into two:
- Small Business Budget Bundle - Monthly + Annual Budget + Expense Report.
- Day-to-Day Operations Bundle - Invoice Tracker + Payroll Tracker + Inventory Management.
Excel and Google Sheets, both
Almost every business workbook ships as a real .xlsx file. Excel opens it natively. So does Google Sheets: upload to Drive, right-click, “Open with Google Sheets”, and the workbook converts. Formulas, charts, formatting, everything. The Cash Flow Forecast is the exception in this library, delivered as a Google Sheet you copy to your own Drive.
A few of the older templates are Google-Sheets-only too (Financial Planning, Net Worth Tracker, the monthly budget family from the personal finance side). Every product page now shows which apps it works in, so there’s no guessing.
What’s next
The Spring Sprint is the larger build of the year for business templates. Summer is going to be lighter and more focused: multi-currency support on the workbooks that don’t yet have it, FAQ pages for the new templates, and an investing-focused workbook (portfolio tracker with rebalancing math). The full picture, as always, sits on the roadmap page.
If there’s a template you’ve been waiting on that isn’t in this list, tell us. The next sprint’s list usually starts with the questions people asked first.
Related
- Cash flow forecast template for a business - a closer look at the workbook we ship first.
- How to forecast cash flow for a small business - the method behind the forecast.
- Freelancer cash flow spreadsheet - the solo-operator angle on the same math.
- Rental property cash flow spreadsheet - underwriting a rental before you make an offer.
- QuickBooks vs Wave for freelancers - where the bookkeeping workbooks sit against the accounting apps.
- Google Sheets templates for financial advisors - the client-work bundle built on the same library.
Frequently asked questions
Why so many templates? Wouldn't fewer, deeper ones be better?
Honestly, we wrestled with this. The thing is, most of them solve the same five questions from different angles: am I profitable, can I make payroll, where's the margin leaking, is this deal worth doing, what does next year look like. A restaurant owner needs the labor cost ratio. A SaaS founder needs MRR and churn. Same questions, completely different math. So we built them as separate workbooks instead of forcing one to do every job.
Are the new templates separate products or replacements?
Separate. The existing Cash Flow Forecast, P&L, and Balance Sheet keep working the way they always have. We just filled in everything around them: daily bookkeeping, receivables, payables, planning models, industry-specific math, and so on.
Do the persona bundles overlap?
A few templates show up in more than one. Mortgage Analysis is in both the Rental & STR Investor bundle and the Commercial Real Estate bundle, for instance: same workbook, different buyer who'd want it for different reasons. If you already own one of the templates in a bundle you want, contact us and we'll work something out.
How are these different from the Ultimate and Essentials templates?
Different shape. Our business templates are multi-sheet workbooks: dashboard, the data sheets you type into, one or two derived views, settings. Ultimate templates are single-purpose Excel files that go deep on one thing. Essentials are simpler single-purpose files. The business library is where most of the recent work landed.
Can I see what's in each one before buying?
Yes. Every product page shows the dashboard, lists the sheets included, and explains what's calculated. If you want a walk-through after buying, just reply to your purchase email and we'll send a short loom of how the workbook is structured.
About this article
Every template and bundle named here was checked on 2026-09-10 against the shipped workbook: sheet names, labelled inputs, calculated outputs and dropdowns. Bundle contents and Excel / Google Sheets support were checked against the product catalog on the same date. Last reviewed September 2026.