KPI Dashboard Spreadsheet Template for Excel & Google Sheets
A single-source-of-truth scoreboard for your business. Each KPI has 12 monthly actuals, 12 monthly targets, and a direction flag - the workbook derives YTD attainment, current status, and a composite score automatically. Not a P&L and not a project tracker - it answers one question: are we on track this year on the things we set targets for? One spreadsheet, dual compatible with Microsoft Excel and Google Sheets.
One-time purchase
KPI Dashboard Spreadsheet
Everything in This KPI Dashboard Spreadsheet
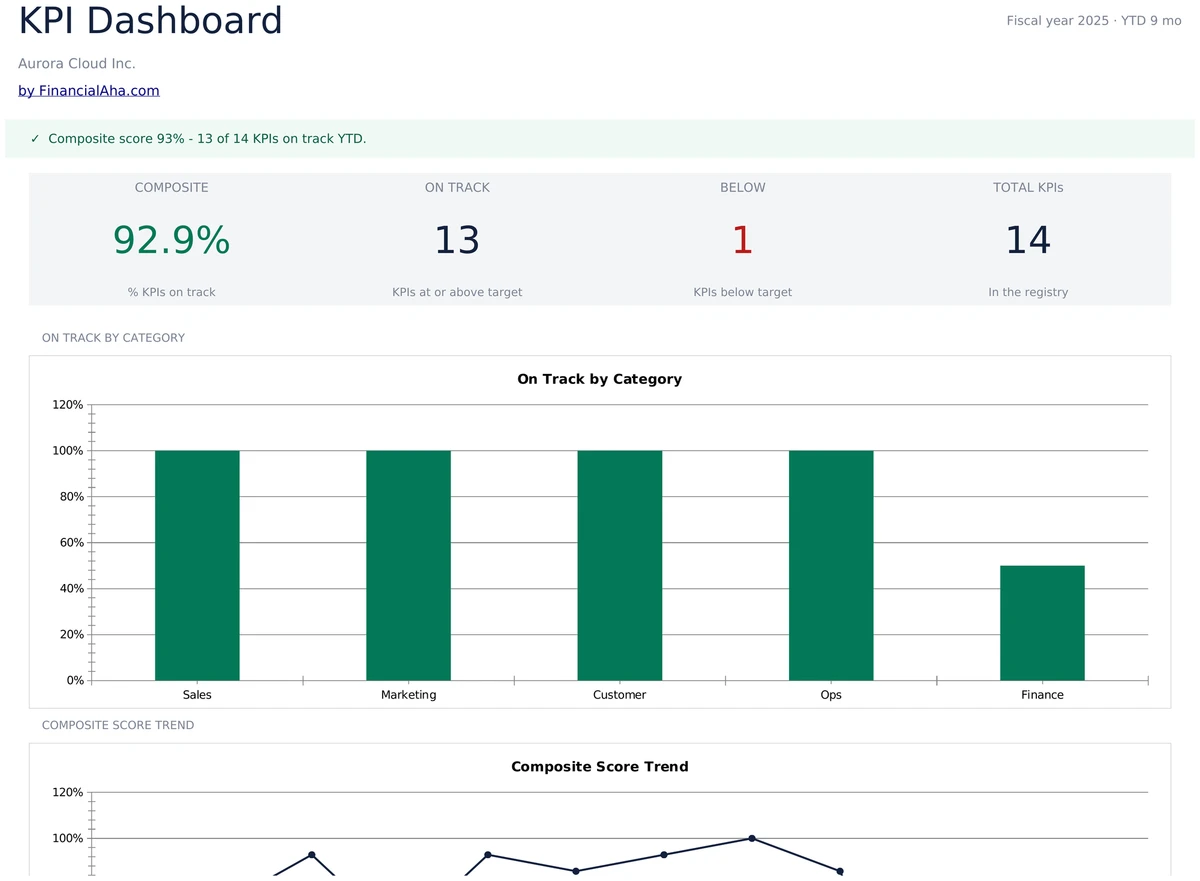
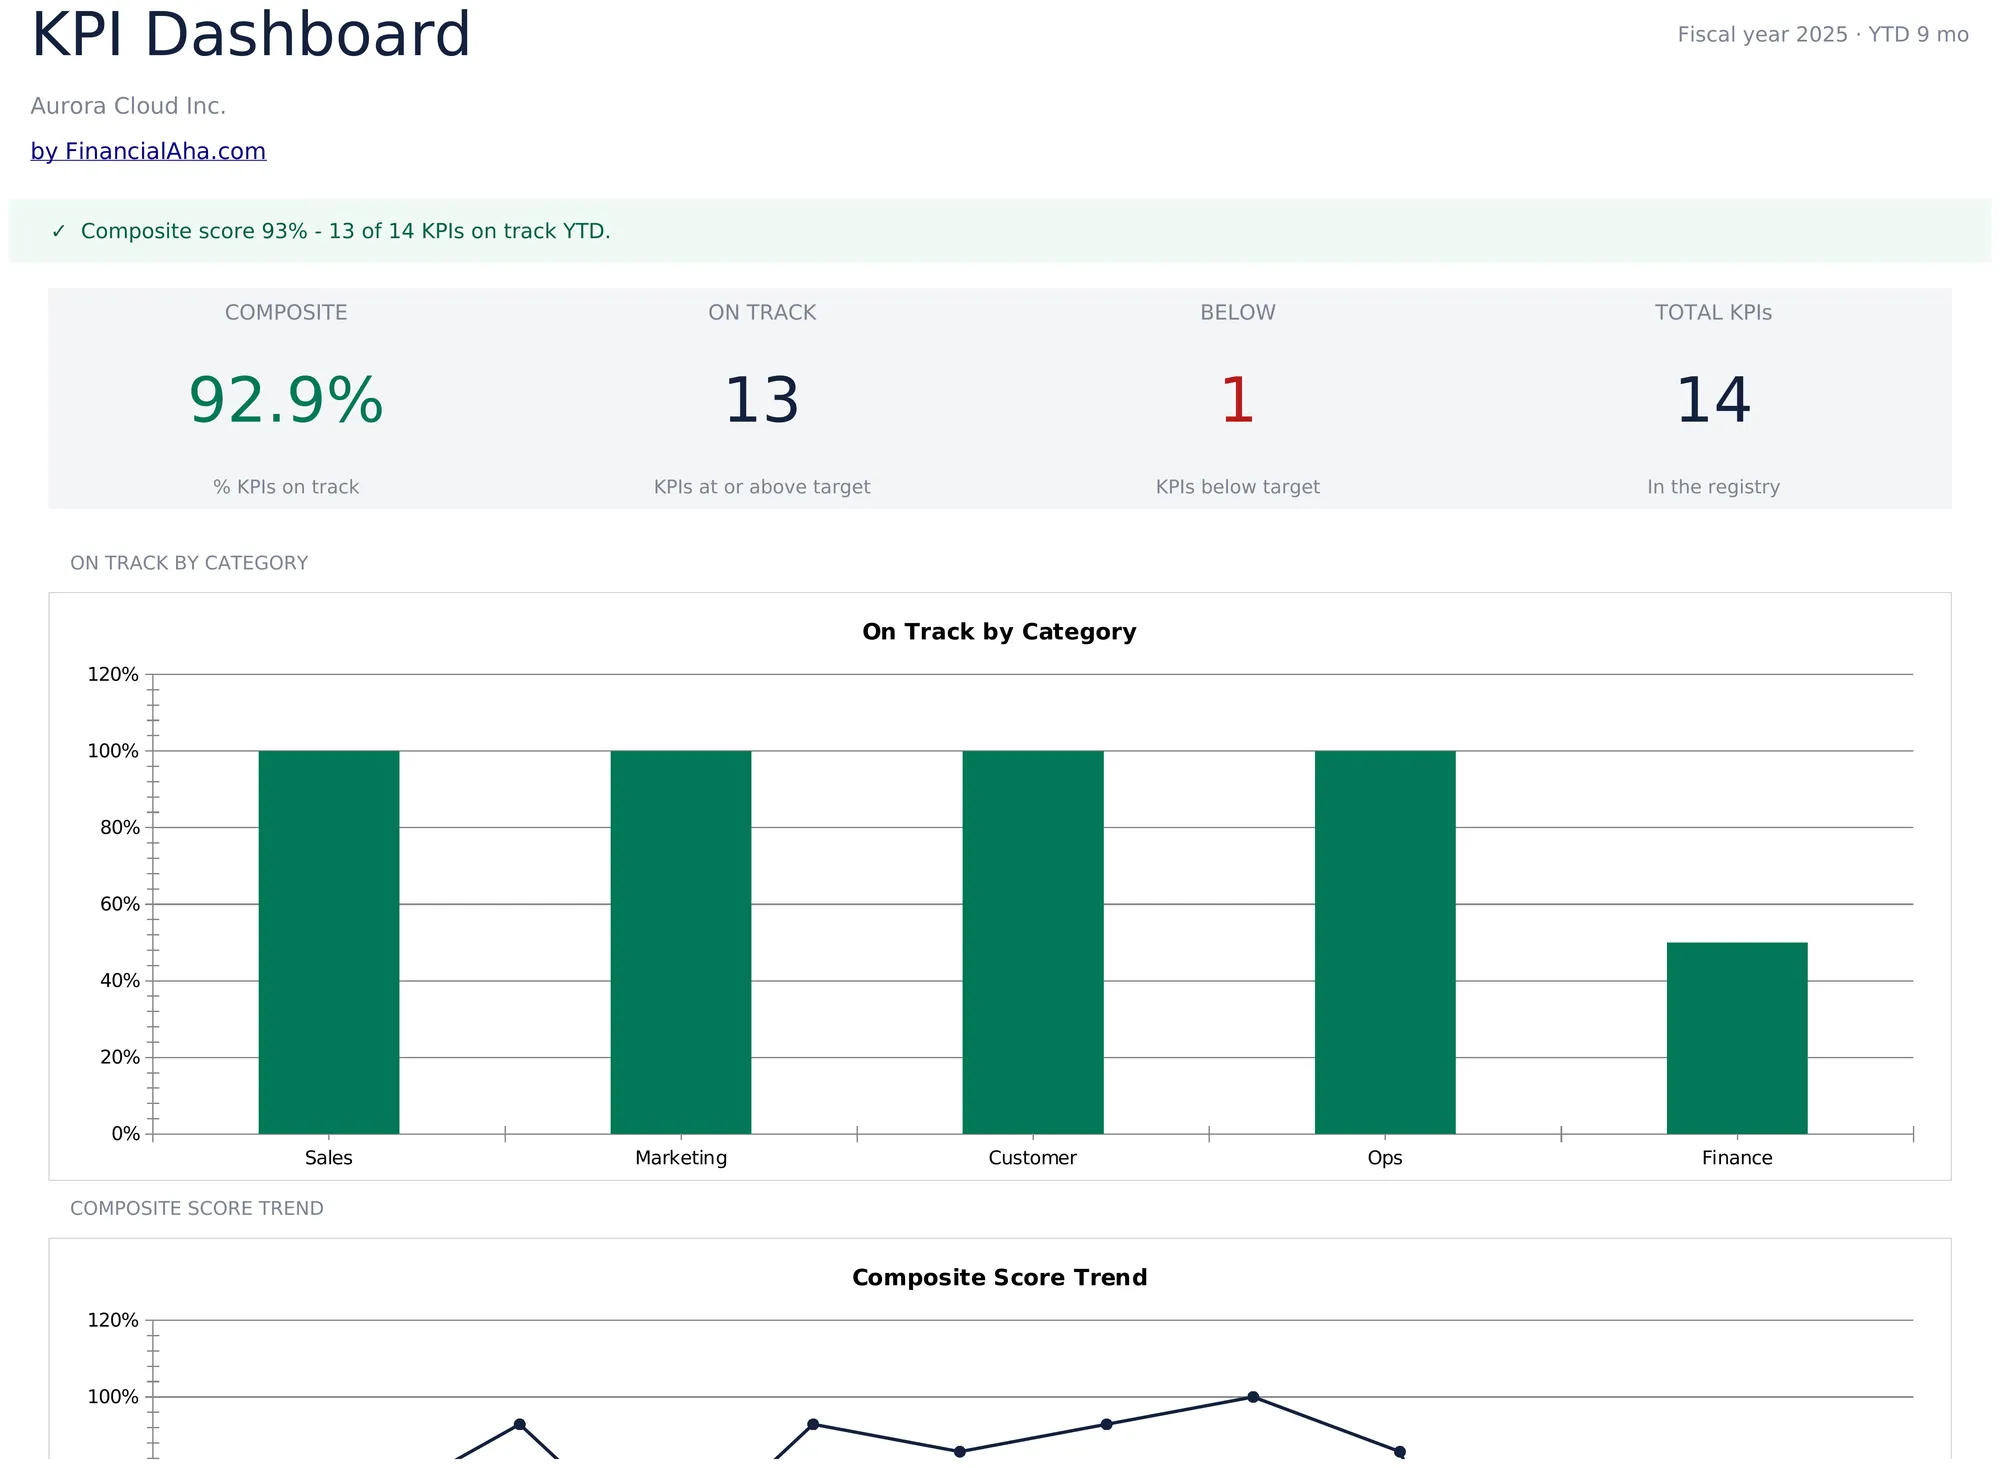
Your Scoreboard at a Glance
Open the Dashboard and see the four headline numbers - composite score, on-track count, below-target count, and total KPIs in the registry. A pacing alert banner sums it up in a sentence, and a column chart breaks on-track percent down by category.
- 4 headline KPI cards plus pacing alert banner
- On-track by category column chart
- Composite score trend line for the year
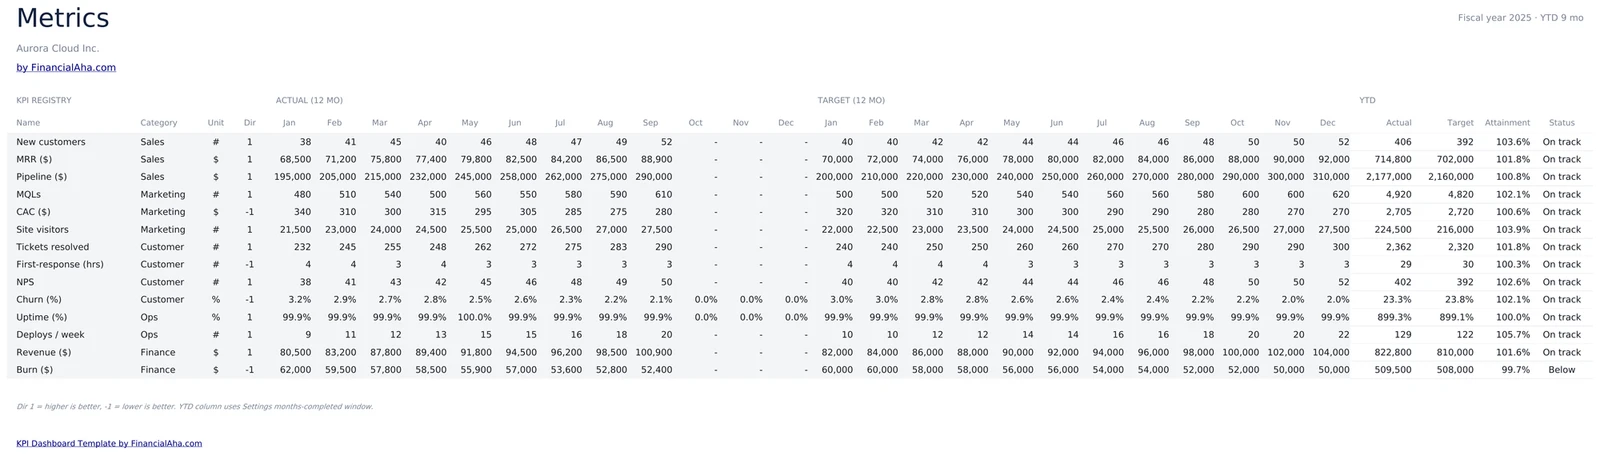
One Row Per KPI, Twelve Months Each
The Metrics sheet is the registry. Enter 12 monthly actuals and 12 monthly targets for each KPI, set the direction flag, and YTD attainment, current status, and trend calculate from there. Sample data shows 14 KPIs - swap in your own.
- 12 monthly actuals plus 12 monthly targets per KPI
- Direction flag for higher-or-lower-is-better
- YTD attainment and current status auto-compute
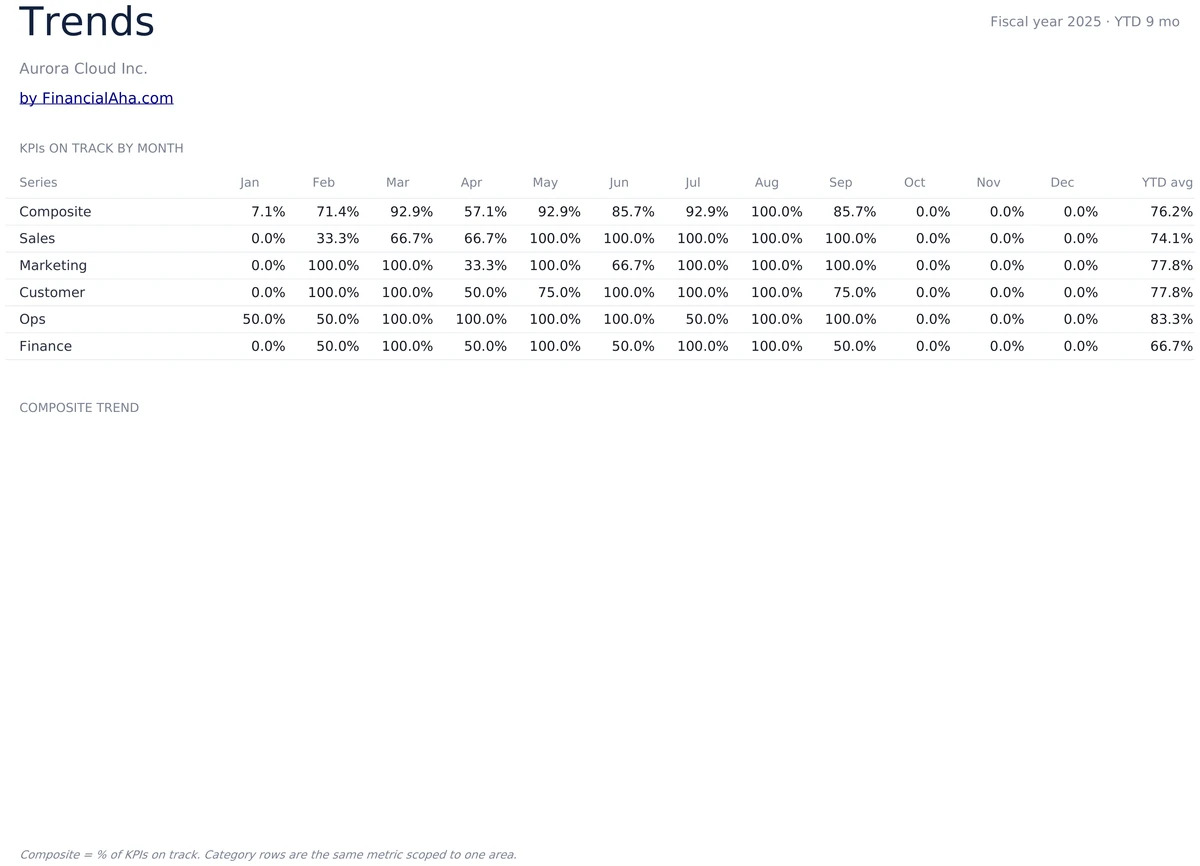
Month-by-Month On-Track Percent
The Trends sheet shows the share of KPIs on track each month - one row for the composite, then one row per category. Read across a row to see how Sales pacing or Marketing pacing has moved through the year, with a YTD average column at the end.
- Composite and per-category on-track percent
- 12 monthly columns plus YTD average
- Spot a category sliding before it shows up YTD
Five Categories Out of the Box
Sales, Marketing, Customer, Ops, and Finance ship with sample KPIs - MRR, pipeline, MQLs, CAC, NPS, churn, uptime, revenue, burn, and more. Rename a category, drop a KPI, or add your own - the dashboard rolls up the same way.
- Sales, Marketing, Customer, Ops, Finance
- Sample KPIs you can swap or rename
- Category bar chart rolls up automatically
One Number for the Whole Quarter
The composite score is the share of KPIs on track YTD - a single percent you can read in a stand-up or paste into a board update. A line chart on the Dashboard plots the composite month by month so the direction of the year is obvious.
- Single percent for the whole scoreboard
- Composite trend line on the dashboard
- Board-ready in two clicks
On Track or Below, Per KPI
The Metrics sheet tags each KPI with current-month status and YTD status, direction-aware - so a CAC below target counts as a win, not a miss. Below-target KPIs roll up into the headline below count on the dashboard.
- Current-month status per KPI
- YTD status drives the on-track count
- Lower-is-better KPIs scored correctly
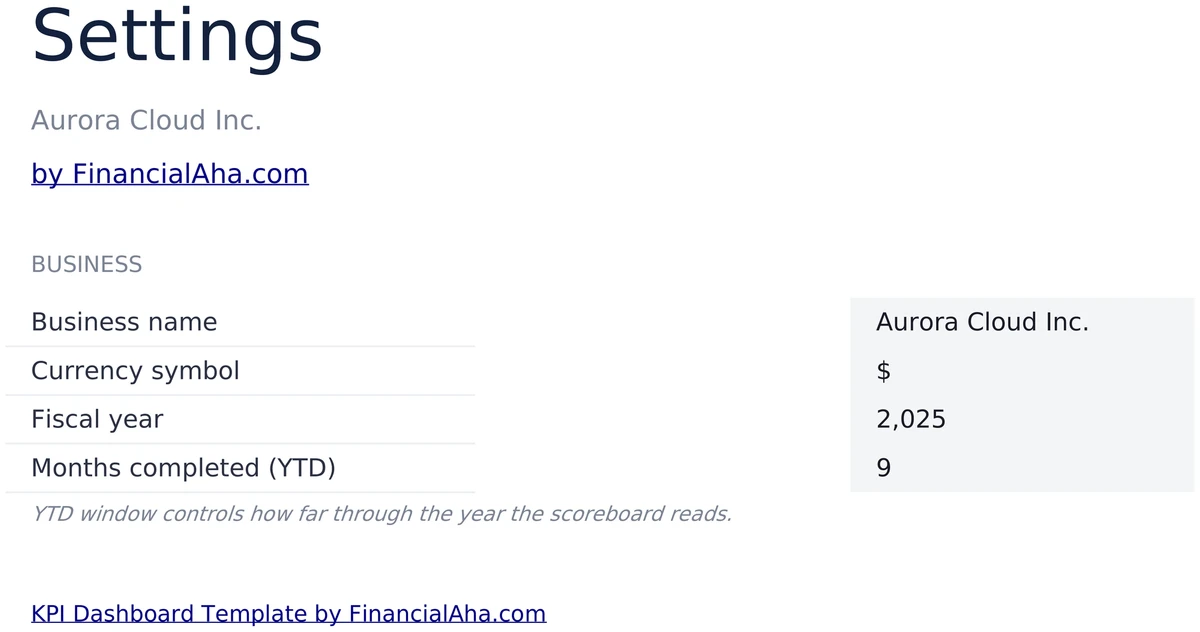
Configure It for Your Business
Set your business name, currency symbol, fiscal year, and Months completed (YTD). The whole workbook reads from these values - the YTD window controls how far through the year the scoreboard reads, so you can preview where the year ends up.
- Business name, currency, fiscal year
- Months completed drives the YTD window
- Set once - workbook reads these values
Up and Running in 15 Minutes
Start on Settings, edit the KPI registry on Metrics, then read the Dashboard and Trends sheets. Months completed drives the YTD window, so set it to the last closed month and the scoreboard updates everywhere.
- Settings, then Metrics, then read the Dashboard
- 15-minute initial setup
- Update actuals once a month
Customizable & Flexible
Adapt the dashboard to your business. Rename categories, swap KPIs, set higher-or-lower-is-better per row - the dashboard and Trends sheet update automatically. Works identically in Excel and Google Sheets.
- Rename categories and swap KPIs
- Direction flag per KPI
- Excel and Google Sheets compatible
Ready to take control of your finances?
Set Up in 15 Minutes
How the KPI Dashboard Works
Open in Excel or Google Sheets
Get instant access after purchase. Open in Microsoft Excel directly, or import into Google Sheets - no software to install, no add-ons.
Configure Your Business
Set your business name, currency symbol, fiscal year, and Months completed on the Settings sheet. Takes about 5 minutes.
Edit the KPI Registry
On the Metrics sheet, swap in your own KPIs and enter monthly actuals and targets. The dashboard rolls up the same way.
Read the Scoreboard
The Dashboard shows composite score, on-track count, and trend. Update actuals once a month - everything else recalculates.
Customer Reviews
Used by Operators Worldwide
"If I get half as good at handling my finances as you are at customer service, this'll be the best $26 I've spent lately."
"Great tool! Simplifies financial planning without the hassle of complex spreadsheets."
"I recently purchased your super convenient spreadsheet, it really helps me!"
"They're great and super intuitive. Thank you!"
Built for Results
Why This KPI Dashboard Works
Composite Score in One Glance
A single percent for the whole scoreboard - share of KPIs on track YTD - plus an on-track count, below count, and total KPIs in the registry.
No Formulas to Write
Enter actuals and targets in highlighted input cells. Attainment, status, trend, and the composite score are pre-built and update automatically.
Excel and Google Sheets
Works identically in Microsoft Excel and Google Sheets. No macros, no add-ons, no proprietary functions.
Free Lifetime Updates
All future improvements to the KPI dashboard included at no extra cost.
Your KPI Data Stays Private
Runs entirely in your spreadsheet. Your data stays in your file - we never see or store it.
One-Time Purchase
Pay once, use forever. No subscriptions, no monthly fees, no recurring charges.
Got Questions?
Frequently Asked Questions
Is this template free to use?
This template is not free, but it is available for a one-time purchase. This purchase gives you lifetime access to the template and all future updates.
What do you mean by lifetime access?
Lifetime access means that you will have access to this template for as long as you need it. You will not be required to pay any additional fees for continued access to the template or any future updates.
Do I need to sign up to use this template?
You don't need to create an account with us. The template works in Google Sheets, so you'll need a Google account. If you don't have one, you can create one for free at google.com. After you purchase the template, copy it to your Google Drive, and start using.
What are the benefits of using this template?
This template offers a range of benefits, including: Easy-to-use interface, Customizable to suit your needs, Secure and private, Regular updates and improvements, One-time purchase for lifetime access.
Can I get future updates?
Yes, you will receive all future updates to this template at no additional cost. This ensures that you always have access to the latest features and improvements.
Do you offer any discounts?
At this time, we do not offer any discounts on this template. However, the template is available for a one-time purchase, which provides lifetime access and free updates.
Do you have any access to my financial data?
No, we do not have access to your financial data when you use this template. The template is designed to be used in your own Google Sheets account, ensuring that your financial information remains private and secure.
Is this template financial advice?
Our templates are not financial advice. They are tools designed to help you manage your personal finances more effectively. If you need personalized financial advice, consider consulting with a financial advisor or accountant.
Can I make my own changes and customize this template?
Yes, you can make your own changes and customize this template to suit your needs. The template is designed to be flexible and adaptable, allowing you to add or remove sections, change formulas, and adjust formatting as needed.
Do you offer technical support?
This is a self-service product, and we do not offer technical support. However, if you encounter any issues or have any questions about the template, please contact our team for assistance. Because everyone's financial situation is unique, consider consulting with a financial advisor or accountant if you need personalized financial advice.
Do you offer refunds?
All sales are final. Because these are digital products delivered instantly, we do not offer refunds.
Can't find the answer you're looking for? Contact our team
Highlights:
Run Your Business by the Numbers
Get the KPI Dashboard template and start tracking composite score, on-track count, and category trends in Excel or Google Sheets.