5-Year Financial Projections Spreadsheet Template for Excel & Google Sheets
A three-statement 5-year forecast - Income Statement, Cash Flow, and Balance Sheet - all driven by a single Drivers sheet. Year 1 is a hard-input baseline; Years 2 through 5 are derived from per-year drivers (revenue growth %, gross margin %, opex %, CapEx %, working-capital days, tax rate). The balance sheet ties back to assets equal liabilities plus equity in every year. Built for fundraising, board reviews, and strategic planning. One spreadsheet, dual compatible with Microsoft Excel and Google Sheets.
One-time purchase
5-Year Financial Projections Model
Everything in This 5-Year Projections Model
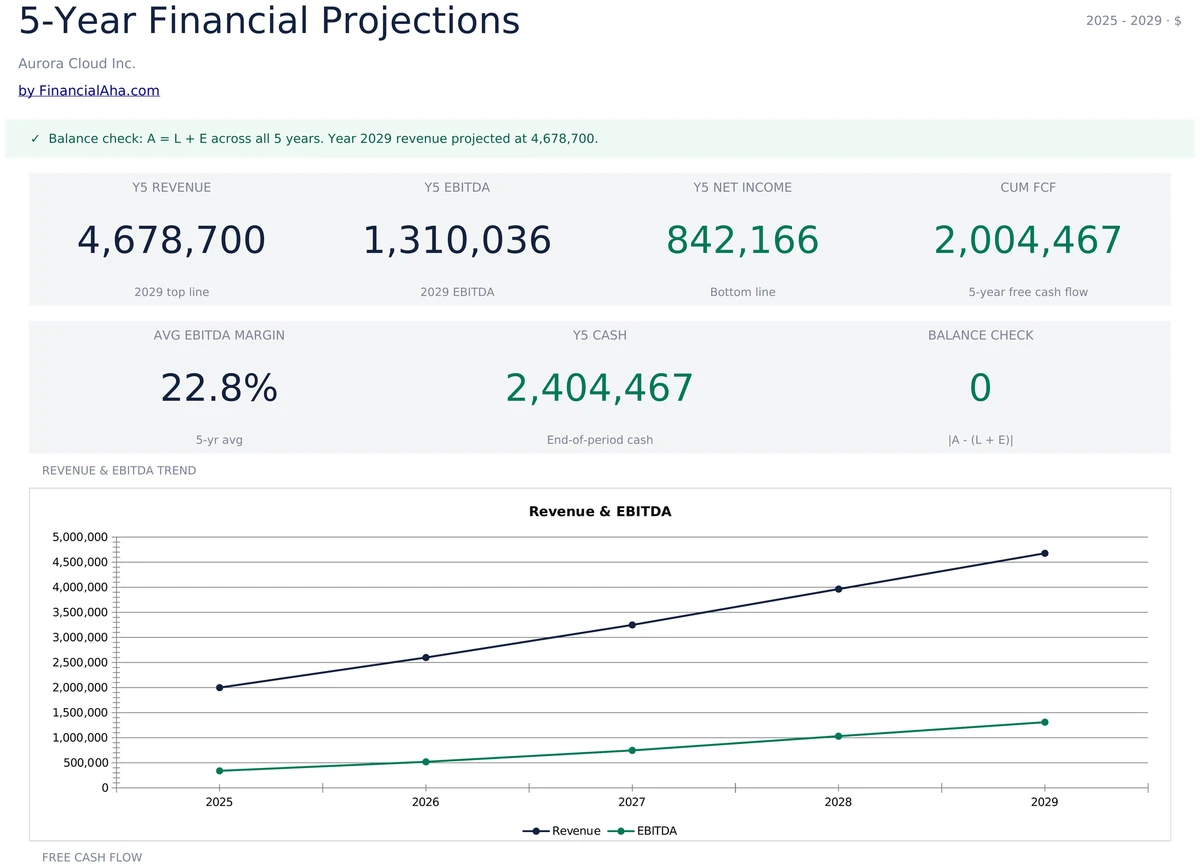
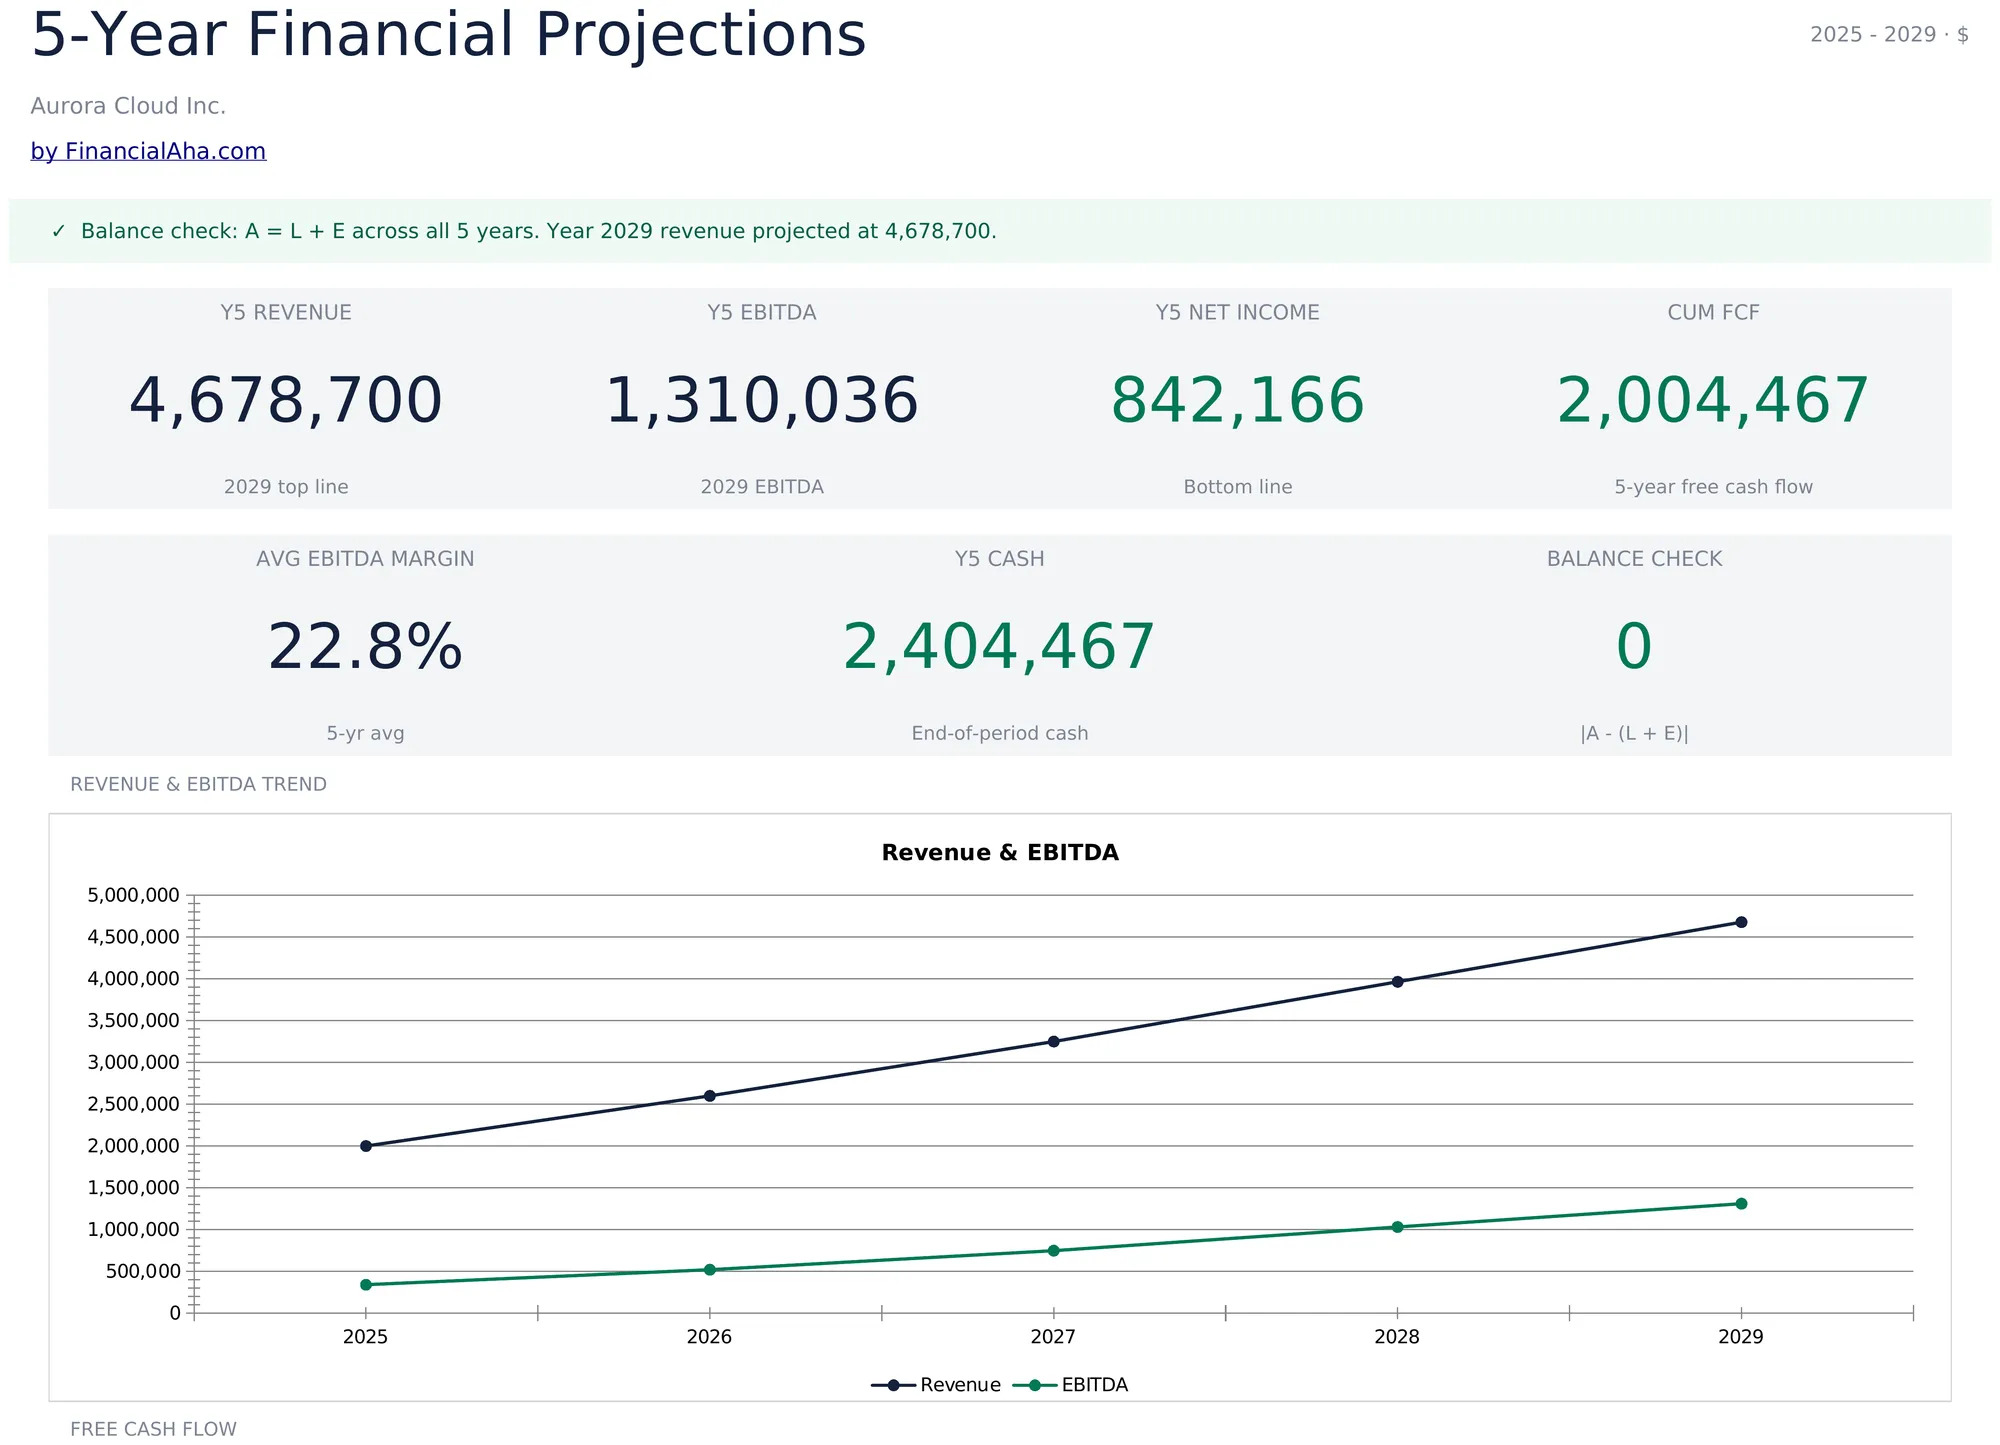
Five Years on One Page
Open the Dashboard and see Year-5 revenue, EBITDA, net income, cumulative free cash flow, average EBITDA margin, end-of-period cash, and the balance check. A revenue and EBITDA trend line plots all 5 years, and a free cash flow chart sits underneath.
- 7 headline KPIs covering P&L, cash, and balance check
- Revenue and EBITDA trend line over 5 years
- Free cash flow chart and pacing banner
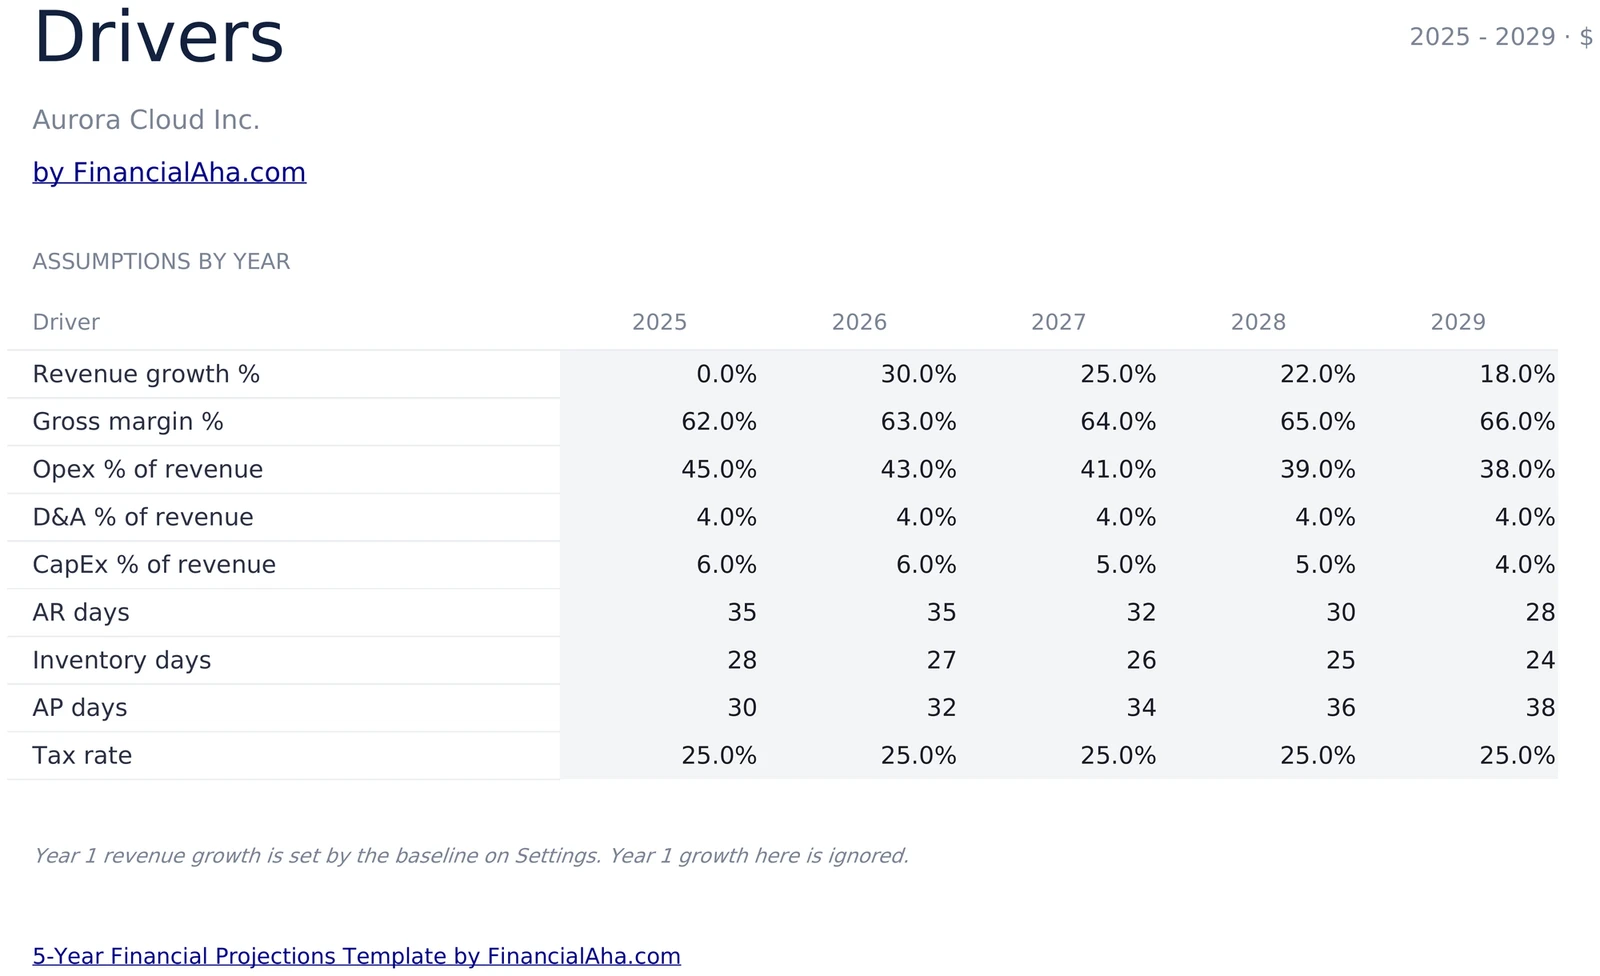
One Sheet Drives the Whole Model
The Drivers sheet holds nine assumptions per year - revenue growth %, gross margin %, opex % of revenue, D&A % of revenue, CapEx % of revenue, AR days, inventory days, AP days, and tax rate. Change a single cell and the three statements update.
- 9 driver lines across 5 years
- Revenue, margins, working capital, tax
- Year 1 growth ignored - baseline drives it
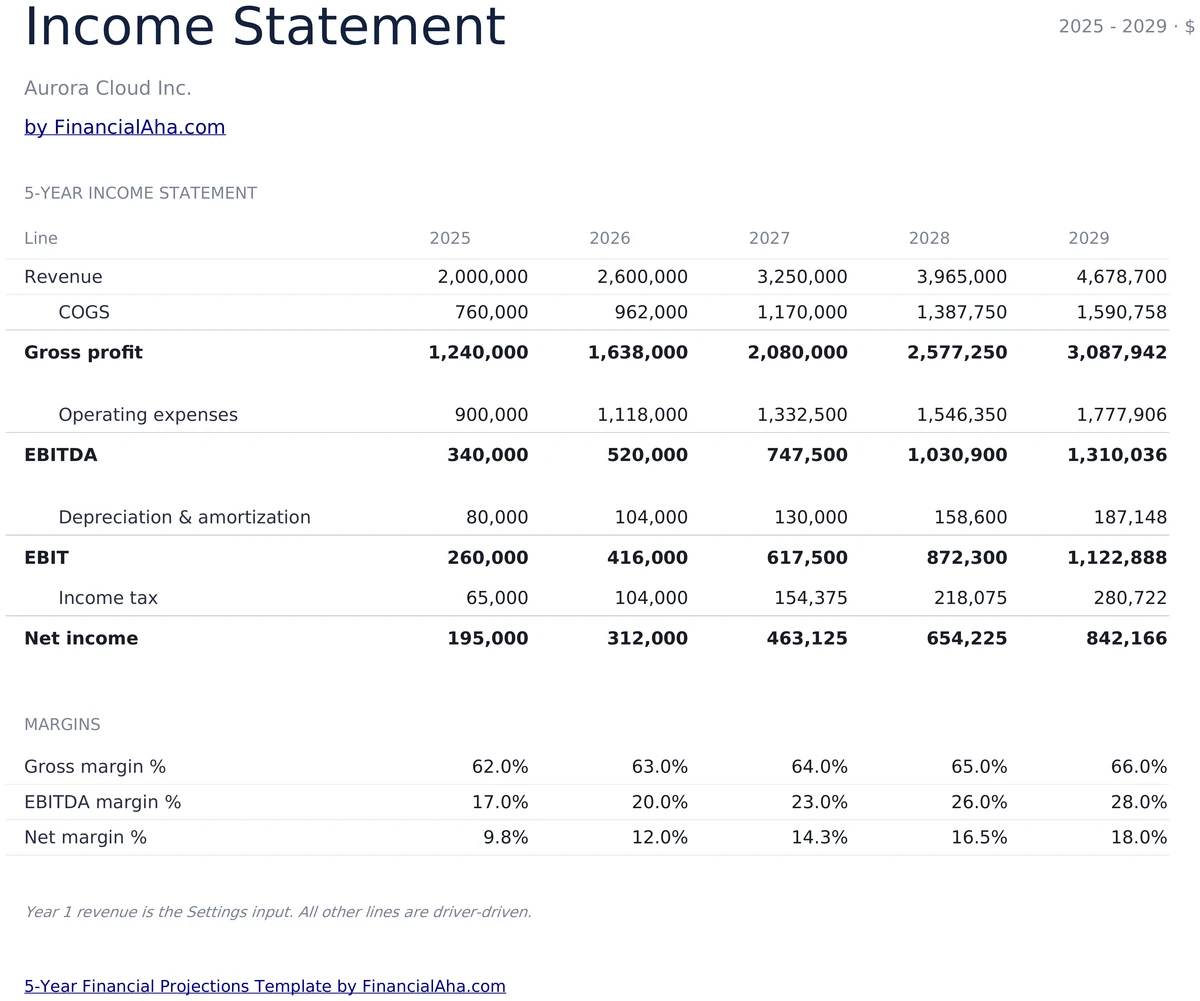
P&L Built from Drivers
Revenue, COGS, gross profit, operating expenses, EBITDA, depreciation, EBIT, income tax, and net income for all 5 years. A margins block underneath shows gross margin, EBITDA margin, and net margin per year so the trajectory is obvious.
- Full P&L across 5 years
- Gross profit, EBITDA, EBIT, net income
- Margin block per year (gross, EBITDA, net)
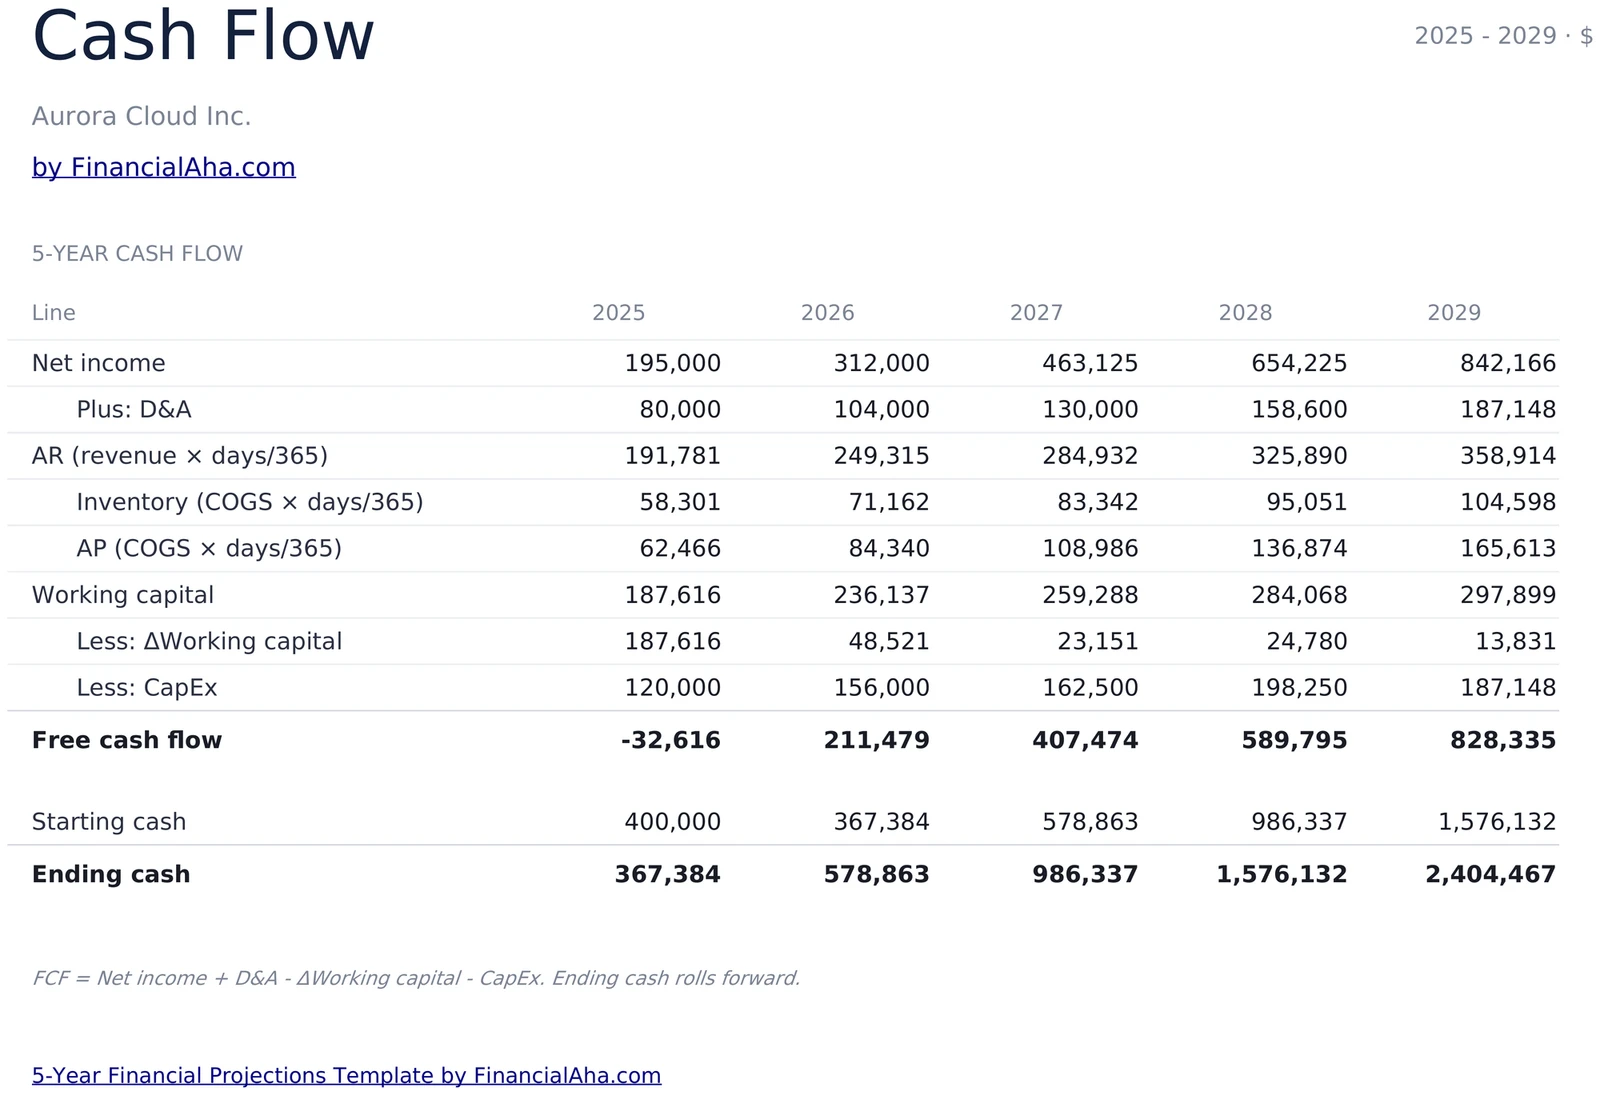
Operating, Investing, Financing
Net income reconciles to cash through D&A, working capital movements (AR, inventory, AP), CapEx, and any financing. Free cash flow rolls up to the dashboard and feeds the cumulative FCF KPI on the headline card.
- Three-section cash flow statement
- Working capital movements per year
- Free cash flow into end-of-period cash
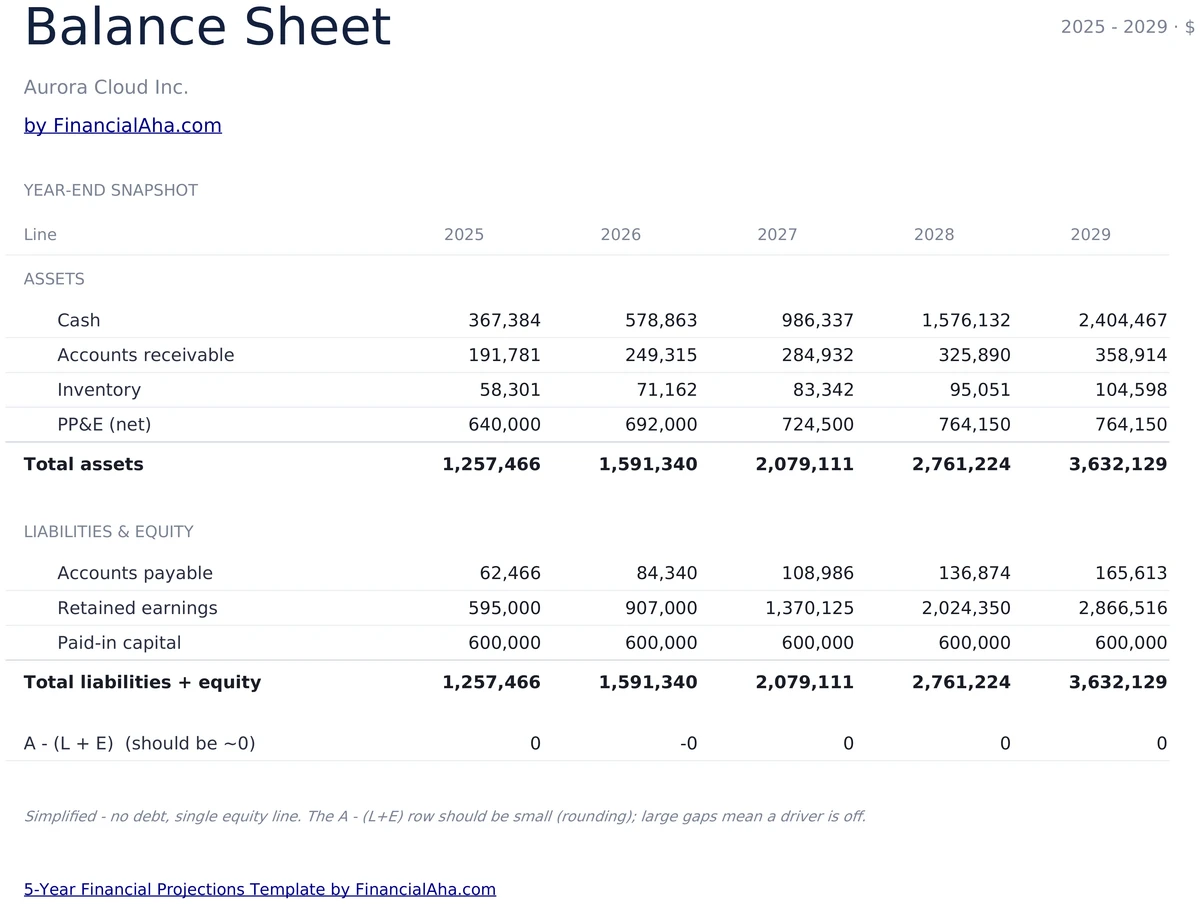
Assets, Liabilities, and Equity That Tie
Cash, AR, inventory, and PP&E on the asset side. AP and retained earnings build over time. The balance check on the Dashboard confirms A = L + E in every year - if you break it, the banner turns amber and tells you.
- Cash, AR, inventory, PP&E
- AP, paid-in, retained earnings
- Balance check confirms A = L + E
See the Direction at a Glance
Two charts on the Dashboard - revenue and EBITDA over 5 years, and free cash flow per year. Spot the year EBITDA crosses into healthy territory, or the year cash flow flips from negative to positive, without scrolling through statements.
- Revenue and EBITDA line chart
- Free cash flow chart per year
- Margin trajectory in the income statement
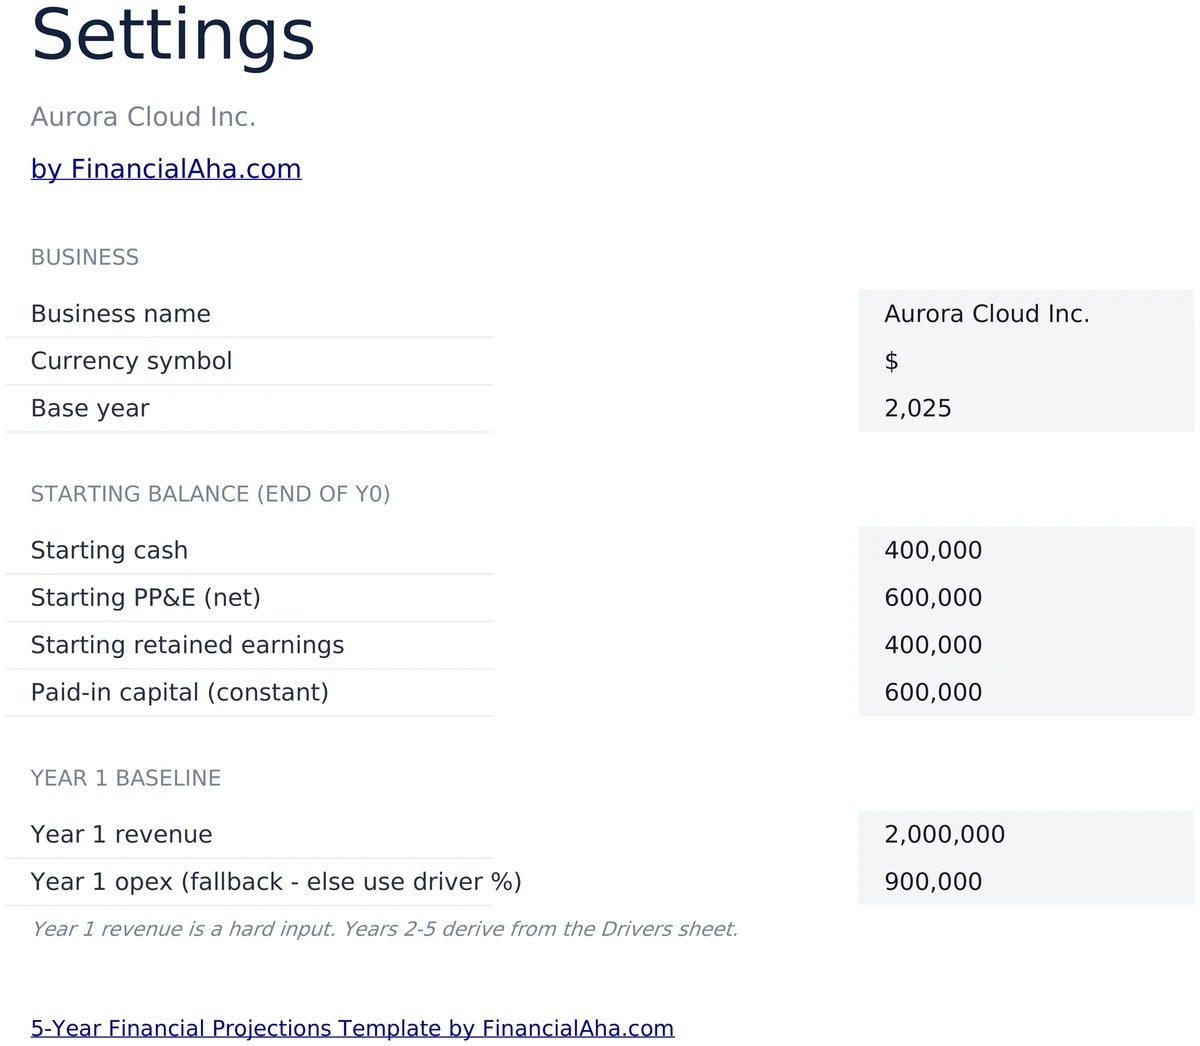
Configure It for Your Business
Set your business name, currency symbol, base year, and Year-1 baseline numbers (revenue, opex, D&A, CapEx, starting cash, starting PP&E, paid-in capital). The whole model anchors to Year 1 and projects from there.
- Business name, currency, base year
- Year-1 baseline numbers
- Opening balance sheet positions
Up and Running in 20 Minutes
Start on Settings, enter the Year-1 baseline, then move to Drivers and set per-year assumptions for Years 2 through 5. The Income Statement, Cash Flow, and Balance Sheet calculate from there - and the Dashboard sums it all up.
- Settings, then Drivers, then read the Dashboard
- 20-minute initial setup
- Change drivers, re-read in seconds
Customizable & Flexible
Adapt the model to your business. Change drivers, rebase Year 1, model a faster-growth or slower-growth case - the three statements tie automatically. Works identically in Excel and Google Sheets.
- Change drivers, rebase the baseline
- Three statements stay tied
- Excel and Google Sheets compatible
Ready to take control of your finances?
Set Up in 20 Minutes
How the 5-Year Projections Model Works
Open in Excel or Google Sheets
Get instant access after purchase. Open in Microsoft Excel directly, or import into Google Sheets - no software to install, no add-ons.
Anchor Year 1
Enter your business name, base year, Year-1 revenue, opex, CapEx, and the opening balance sheet on Settings. Takes about 10 minutes.
Set the Drivers
On the Drivers sheet, enter revenue growth %, margin %, opex %, CapEx %, working-capital days, and tax rate for Years 2 through 5.
Read the Three Statements
The Income Statement, Cash Flow, and Balance Sheet calculate from the drivers. The Dashboard sums it up and confirms A = L + E.
Customer Reviews
Used by Founders and Finance Teams Worldwide
"If I get half as good at handling my finances as you are at customer service, this'll be the best $26 I've spent lately."
"Great tool! Simplifies financial planning without the hassle of complex spreadsheets."
"I recently purchased your super convenient spreadsheet, it really helps me!"
"They're great and super intuitive. Thank you!"
Built for Results
Why This Projections Model Works
Three Statements That Tie
Income Statement, Cash Flow, and Balance Sheet across 5 years, with a balance check that confirms A = L + E in every year.
No Formulas to Write
Enter drivers in highlighted input cells. The three statements, margins, free cash flow, and balance check are pre-built and update automatically.
Excel and Google Sheets
Works identically in Microsoft Excel and Google Sheets. No macros, no add-ons, no proprietary functions.
Free Lifetime Updates
All future improvements to the projections model included at no extra cost.
Your Financial Data Stays Private
Runs entirely in your spreadsheet. Your data stays in your file - we never see or store it.
One-Time Purchase
Pay once, use forever. No subscriptions, no monthly fees, no recurring charges.
Got Questions?
Frequently Asked Questions
Is this template free to use?
This template is not free, but it is available for a one-time purchase. This purchase gives you lifetime access to the template and all future updates.
What do you mean by lifetime access?
Lifetime access means that you will have access to this template for as long as you need it. You will not be required to pay any additional fees for continued access to the template or any future updates.
Do I need to sign up to use this template?
You don't need to create an account with us. The template works in Google Sheets, so you'll need a Google account. If you don't have one, you can create one for free at google.com. After you purchase the template, copy it to your Google Drive, and start using.
What are the benefits of using this template?
This template offers a range of benefits, including: Easy-to-use interface, Customizable to suit your needs, Secure and private, Regular updates and improvements, One-time purchase for lifetime access.
Can I get future updates?
Yes, you will receive all future updates to this template at no additional cost. This ensures that you always have access to the latest features and improvements.
Do you offer any discounts?
At this time, we do not offer any discounts on this template. However, the template is available for a one-time purchase, which provides lifetime access and free updates.
Do you have any access to my financial data?
No, we do not have access to your financial data when you use this template. The template is designed to be used in your own Google Sheets account, ensuring that your financial information remains private and secure.
Is this template financial advice?
Our templates are not financial advice. They are tools designed to help you manage your personal finances more effectively. If you need personalized financial advice, consider consulting with a financial advisor or accountant.
Can I make my own changes and customize this template?
Yes, you can make your own changes and customize this template to suit your needs. The template is designed to be flexible and adaptable, allowing you to add or remove sections, change formulas, and adjust formatting as needed.
Do you offer technical support?
This is a self-service product, and we do not offer technical support. However, if you encounter any issues or have any questions about the template, please contact our team for assistance. Because everyone's financial situation is unique, consider consulting with a financial advisor or accountant if you need personalized financial advice.
Do you offer refunds?
All sales are final. Because these are digital products delivered instantly, we do not offer refunds.
Can't find the answer you're looking for? Contact our team
Highlights:
Project the Next Five Years
Get the 5-Year Financial Projections template and start modeling revenue, margins, cash, and balance sheet in Excel or Google Sheets.