Sales Forecasting Spreadsheet Template for Excel & Google Sheets
A 12-month forward sales forecast that combines trend extrapolation, a seasonal index built from last year's data, and a pipeline-driven snapshot. Every month gets a base, low, and high band driven by a confidence percent on Settings, so you can plan against a range instead of a single number. One spreadsheet, dual compatible with Microsoft Excel and Google Sheets.
One-time purchase
Sales Forecasting Spreadsheet
Everything in This Sales Forecasting Spreadsheet
Forecast at a Glance
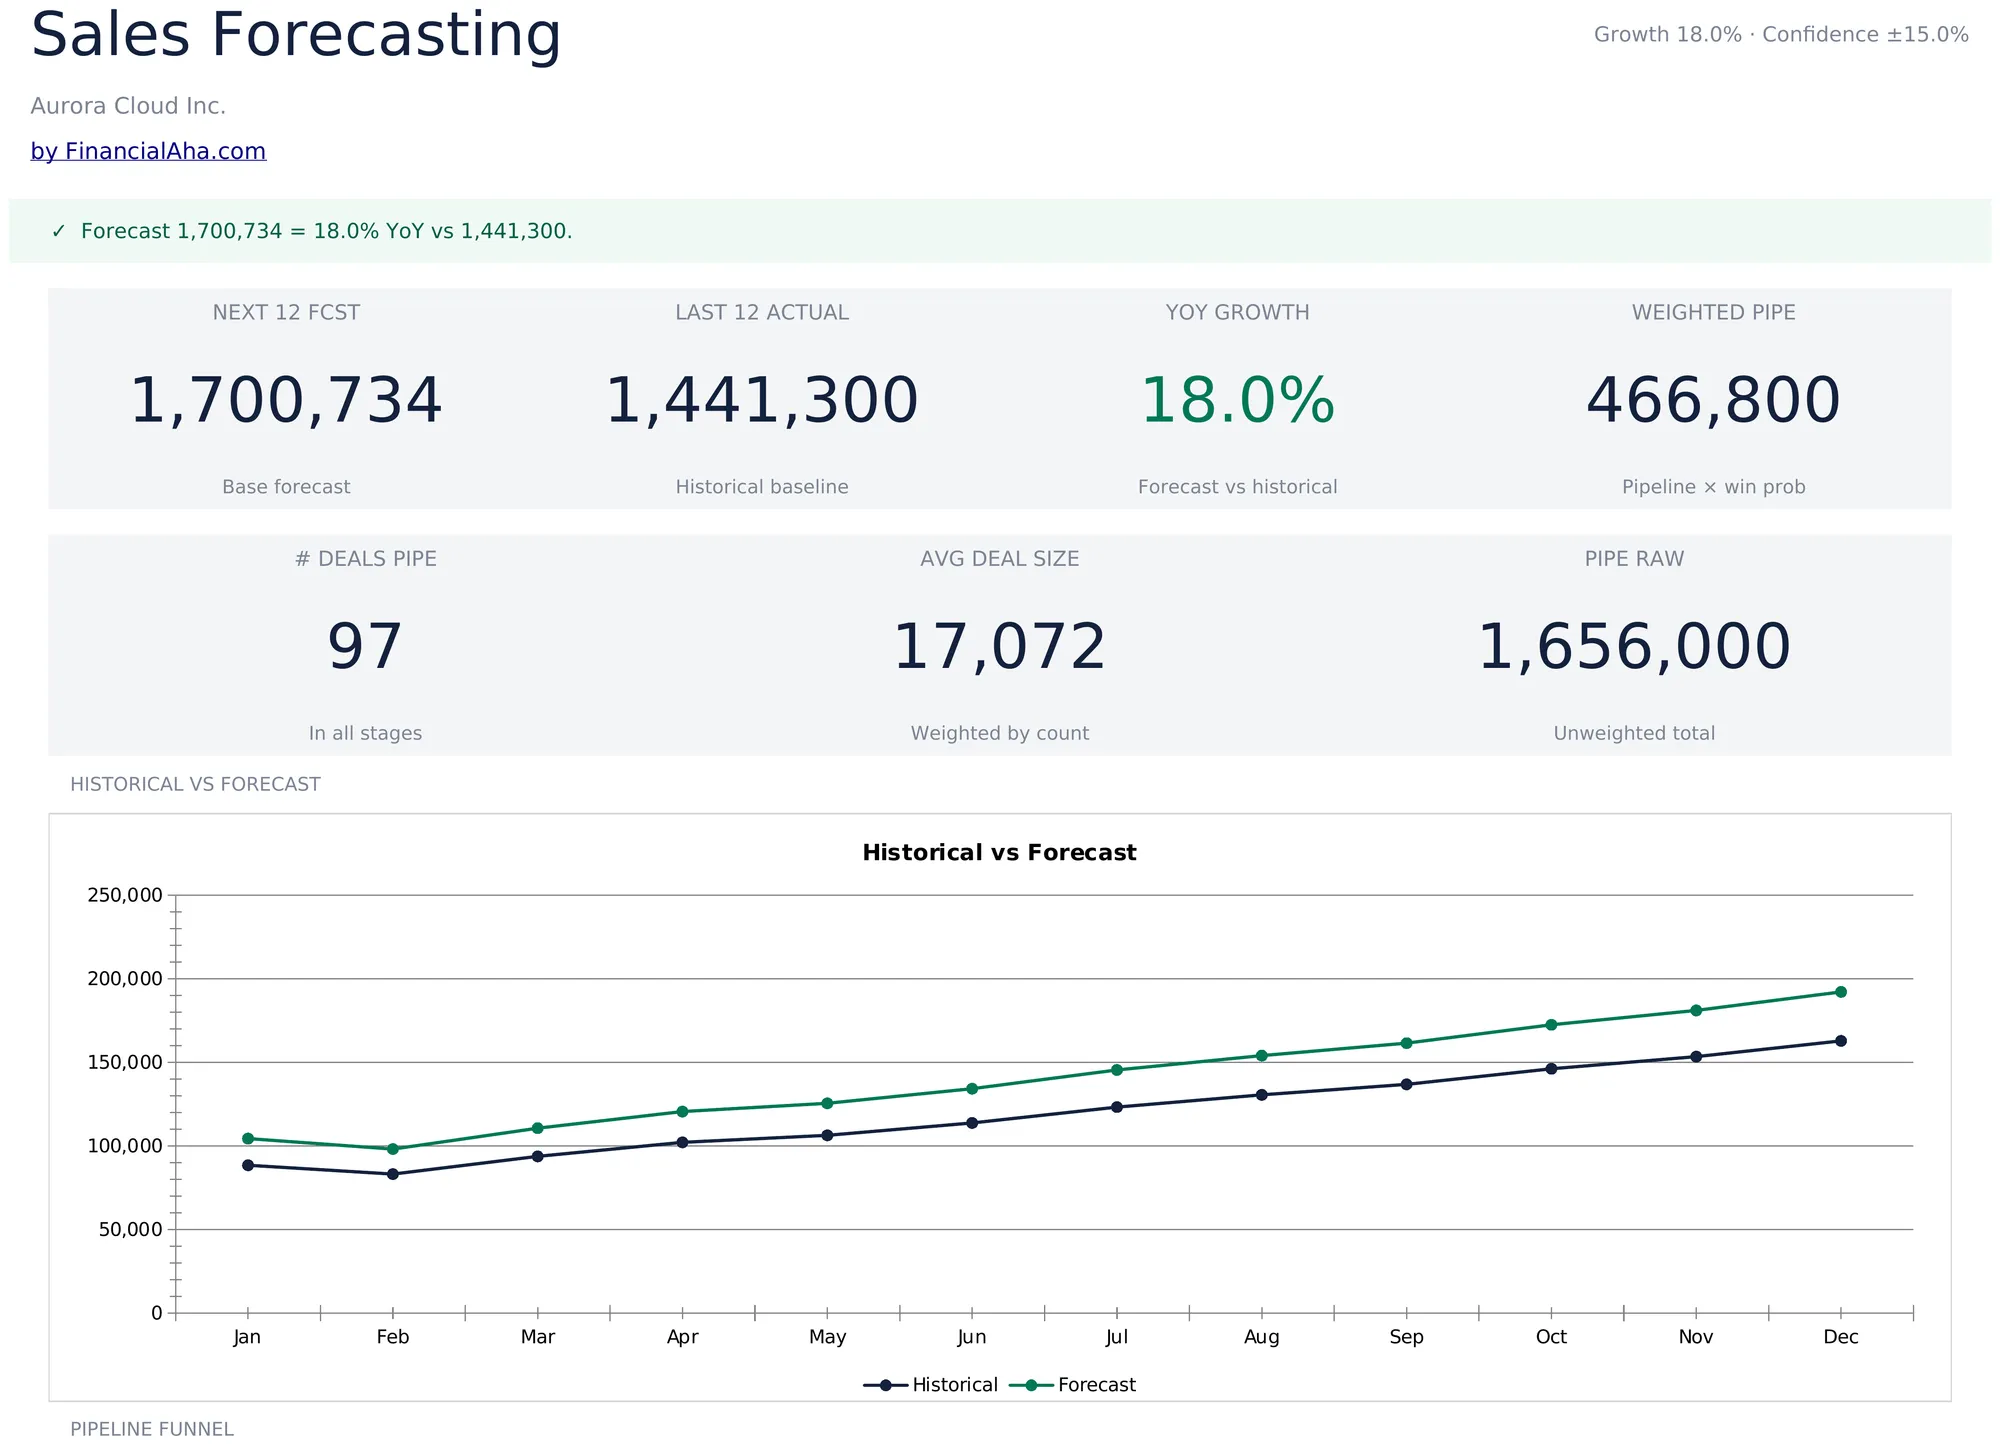
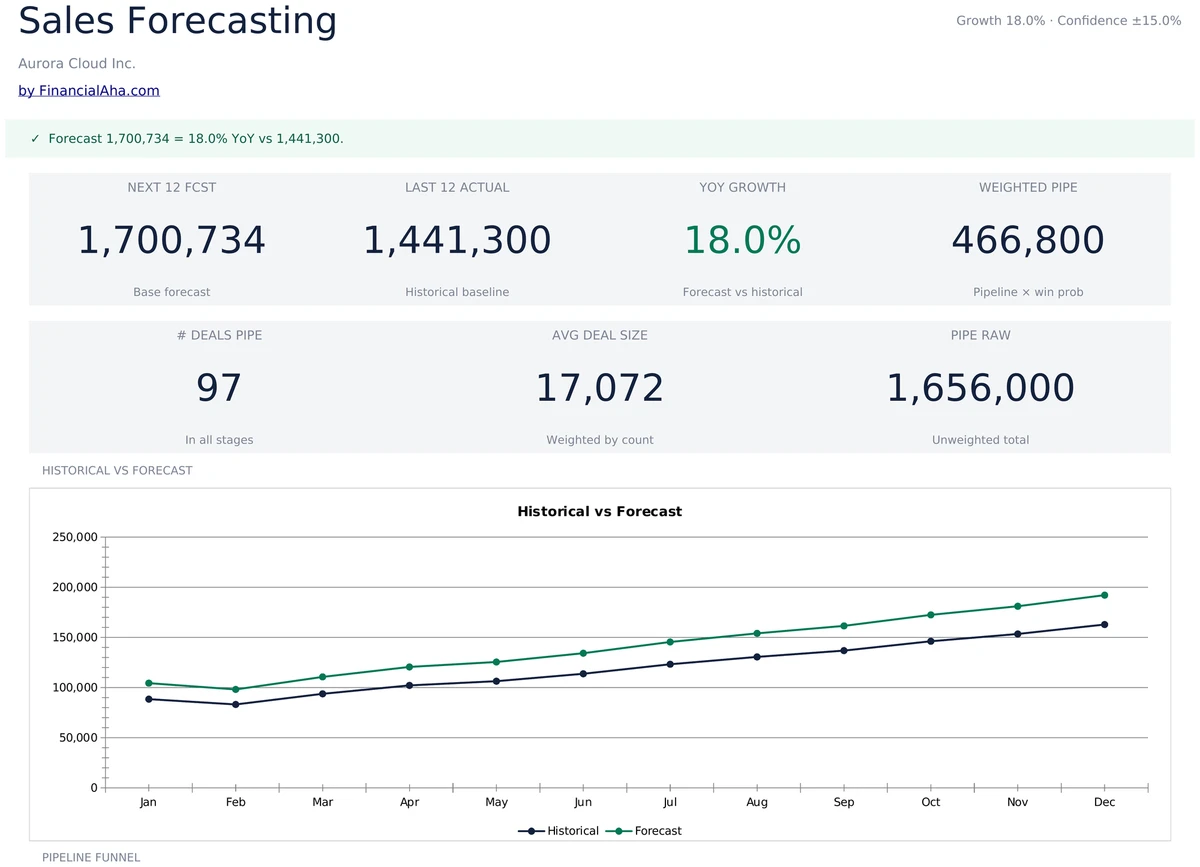
Open the Dashboard and see seven headline numbers - next 12 forecast, last 12 actual, YoY growth, weighted pipeline, deals in pipe, average deal size, and raw pipeline value. A historical vs forecast line chart sits underneath, plus a pipeline funnel by stage.
- 7 headline KPIs covering forecast, history, and pipeline
- Historical vs forecast line chart over 12 months
- Pipeline funnel chart by stage
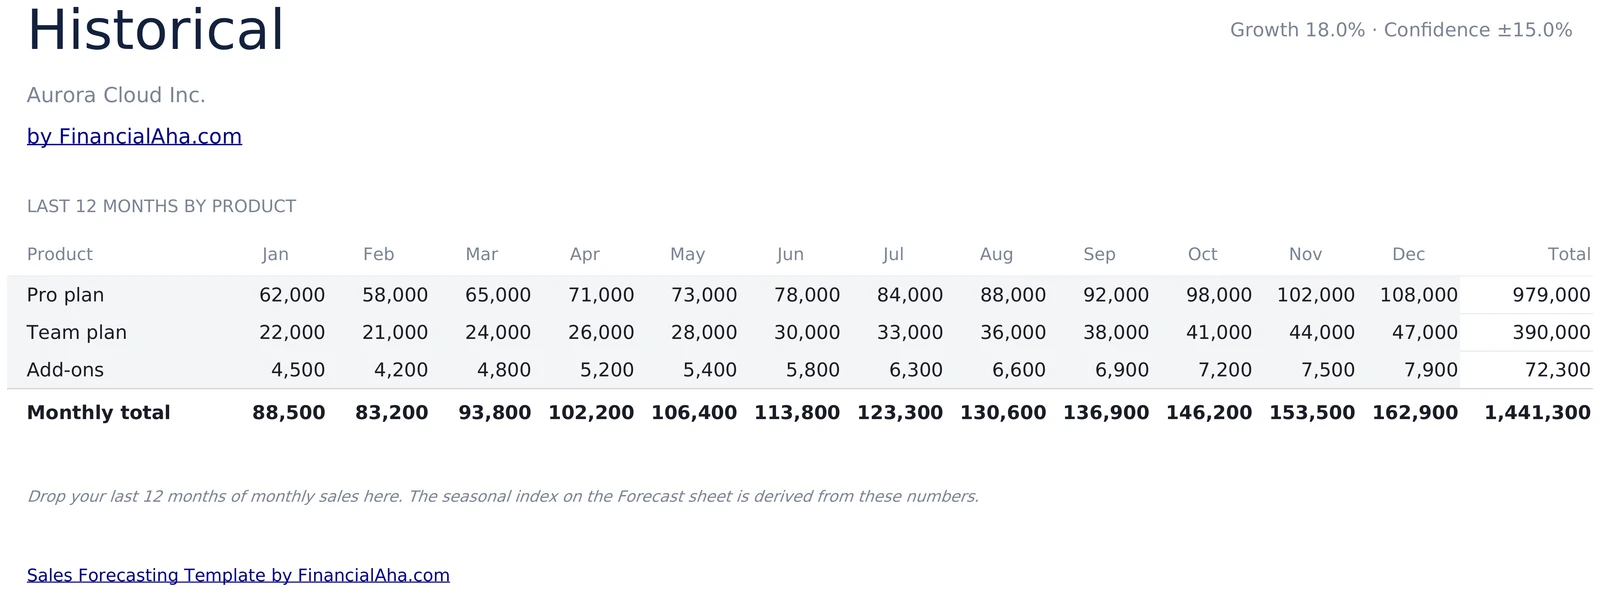
Twelve Months Per Product
Drop your last 12 months of monthly sales here, one row per product. Monthly totals roll up automatically and feed the seasonal index on the Forecast sheet. Add or remove product rows freely.
- 12 monthly inputs per product
- Monthly total row auto-sums
- Drives the seasonal index on Forecast
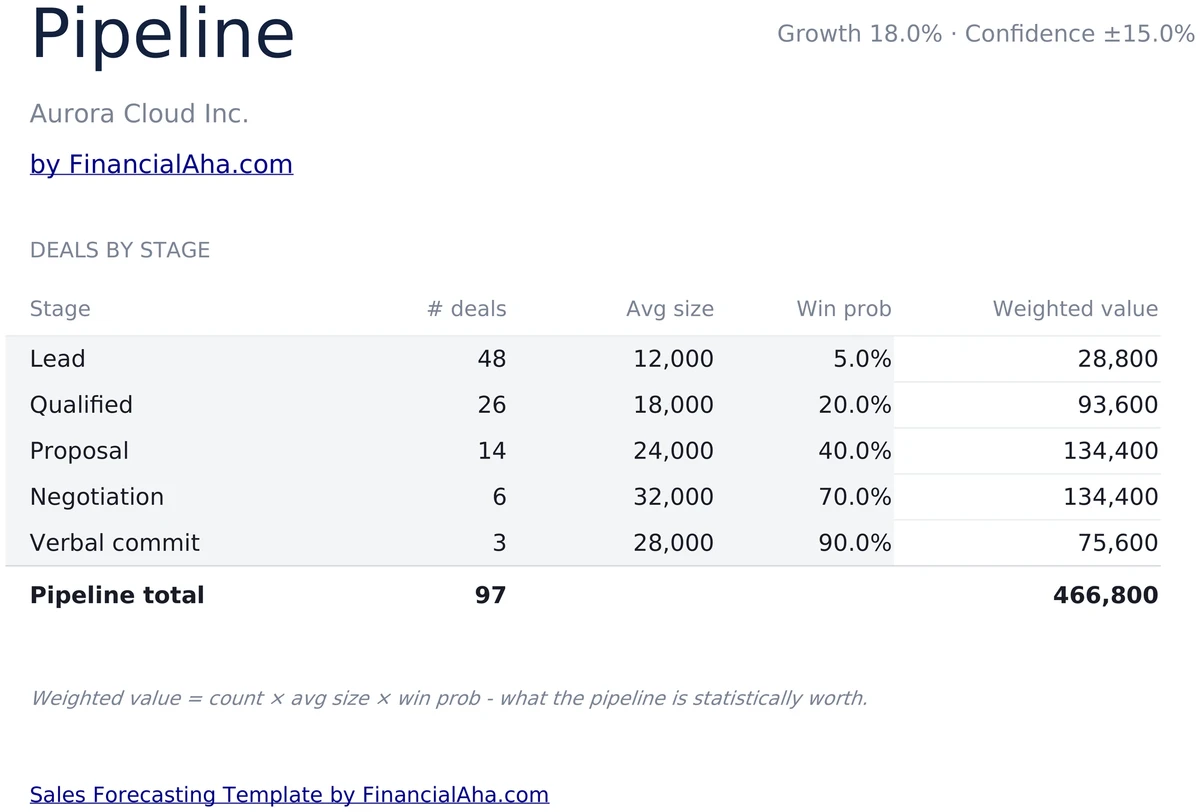
Stage-by-Stage Weighted Value
Five default stages - Lead, Qualified, Proposal, Negotiation, Verbal commit. For each enter deal count, average size, and win probability. Weighted value equals count times size times probability, summed to a single pipeline total at the bottom.
- 5 stages with deal count, size, and win prob
- Weighted value per stage and total
- Feeds weighted pipeline KPI on dashboard
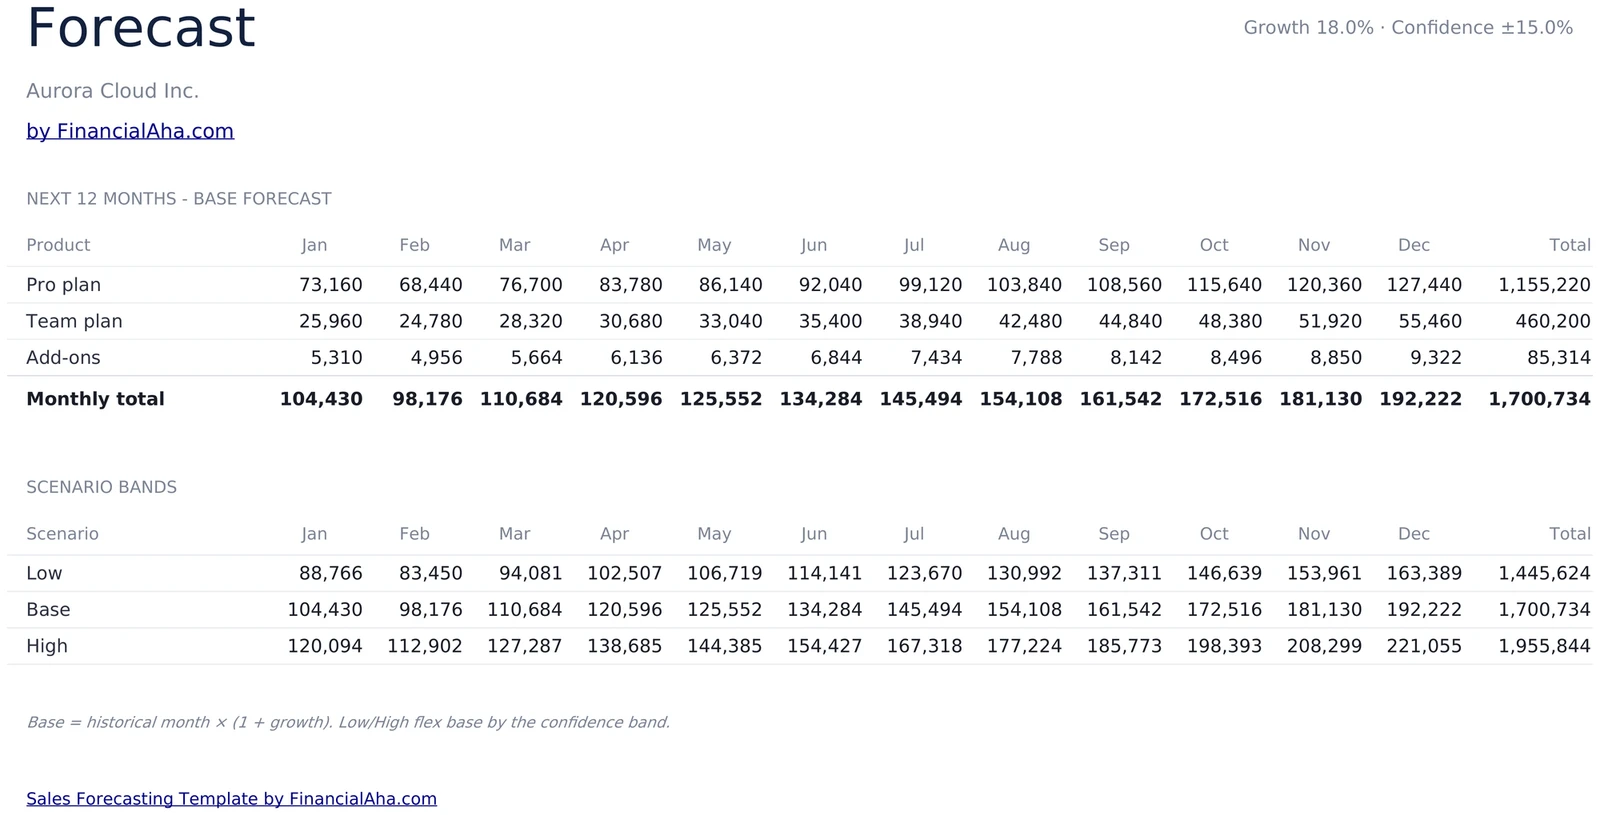
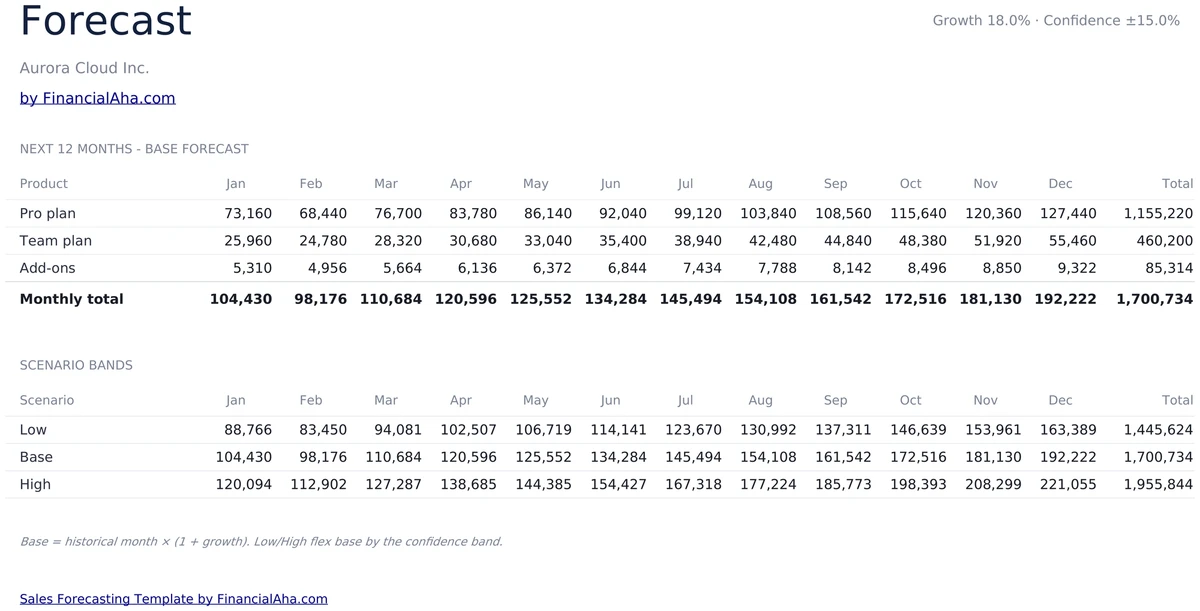
Next 12 Months in Three Bands
Each month gets a base forecast - historical mean times one plus growth, multiplied by the seasonal index. Low and high bands flex the base by the confidence percent on Settings. Per-product rows and a monthly total roll up to the dashboard.
- Per-product monthly forecast for 12 months
- Scenario bands - low, base, high
- Base = historical month x (1 + growth)
Plan to a Range, Not a Number
Set a confidence percent on Settings - the default is 15%. The Forecast sheet builds Low, Base, and High monthly totals from it, and the headline numbers on the Dashboard reflect the base case so you can commit to a number while seeing the spread.
- Single confidence % drives the bands
- Low, Base, High monthly totals
- Headline KPIs reflect the base case
Historical vs Forecast on One Chart
The Dashboard plots last year's monthly actuals against next year's monthly forecast on the same axis. The pacing banner sums it up - forecast total equals X percent YoY versus last year - so the growth story is one line.
- Historical and forecast on the same line chart
- YoY growth banner explains the move
- Side-by-side monthly totals
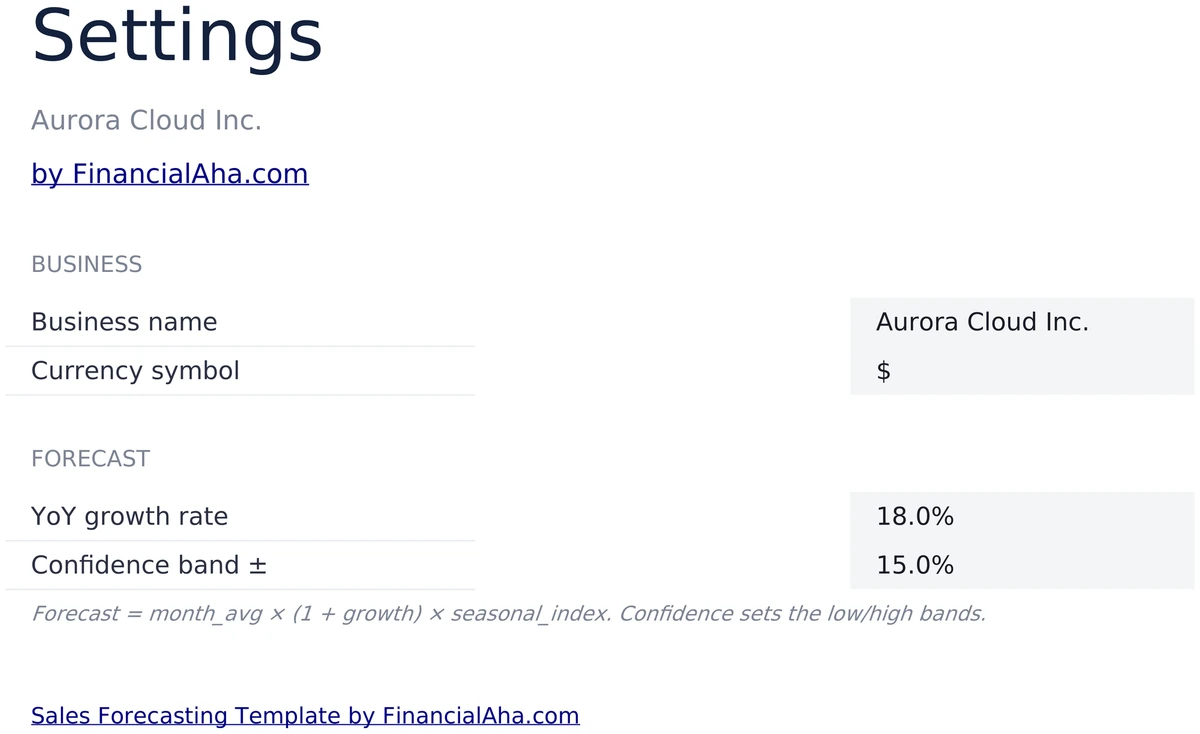
Configure It for Your Business
Set your business name, currency symbol, target YoY growth percent, and confidence percent. Growth applies on top of the historical baseline, and confidence flexes the base into low and high bands - the whole workbook reads from these values.
- Business name and currency symbol
- Target growth % drives base forecast
- Confidence % drives scenario bands
Up and Running in 15 Minutes
Start on Settings, paste last year's monthly sales onto Historical, fill in your pipeline on Pipeline, and read the Forecast and Dashboard. Growth and confidence on Settings drive every forward number.
- Settings, Historical, Pipeline, then read the forecast
- 15-minute initial setup
- Refresh monthly as actuals come in
Customizable & Flexible
Adapt the model to your business. Change the growth %, flex the confidence band, add product lines - the forecast, scenarios, and pipeline view update automatically. Works identically in Excel and Google Sheets.
- Change growth and confidence freely
- Add product lines and stages
- Excel and Google Sheets compatible
Ready to take control of your finances?
Set Up in 15 Minutes
How the Sales Forecast Works
Open in Excel or Google Sheets
Get instant access after purchase. Open in Microsoft Excel directly, or import into Google Sheets - no software to install, no add-ons.
Configure Your Business
Set your business name, currency, growth %, and confidence % on Settings. Takes about 5 minutes.
Drop in Historical and Pipeline
Paste 12 months of sales per product onto Historical. Fill in stage counts, sizes, and win probabilities on Pipeline.
Read the Forecast
The Forecast sheet builds base, low, and high monthly totals. The Dashboard sums it up with historical vs forecast charts.
Customer Reviews
Used by Sales and Finance Teams Worldwide
"If I get half as good at handling my finances as you are at customer service, this'll be the best $26 I've spent lately."
"Great tool! Simplifies financial planning without the hassle of complex spreadsheets."
"I recently purchased your super convenient spreadsheet, it really helps me!"
"They're great and super intuitive. Thank you!"
Built for Results
Why This Sales Forecast Works
Trend Plus Seasonal Forecast
12 months forward, built from your historical baseline times one plus growth, with each month carrying its own seasonal index.
No Formulas to Write
Enter historical sales, pipeline stages, growth, and confidence in highlighted input cells. Seasonal index, base forecast, scenario bands, and weighted pipeline are pre-built and update automatically.
Excel and Google Sheets
Works identically in Microsoft Excel and Google Sheets. No macros, no add-ons, no proprietary functions.
Free Lifetime Updates
All future improvements to the sales forecast included at no extra cost.
Your Sales Data Stays Private
Runs entirely in your spreadsheet. Your data stays in your file - we never see or store it.
One-Time Purchase
Pay once, use forever. No subscriptions, no monthly fees, no recurring charges.
Got Questions?
Frequently Asked Questions
Is this template free to use?
This template is not free, but it is available for a one-time purchase. This purchase gives you lifetime access to the template and all future updates.
What do you mean by lifetime access?
Lifetime access means that you will have access to this template for as long as you need it. You will not be required to pay any additional fees for continued access to the template or any future updates.
Do I need to sign up to use this template?
You don't need to create an account with us. The template works in Google Sheets, so you'll need a Google account. If you don't have one, you can create one for free at google.com. After you purchase the template, copy it to your Google Drive, and start using.
What are the benefits of using this template?
This template offers a range of benefits, including: Easy-to-use interface, Customizable to suit your needs, Secure and private, Regular updates and improvements, One-time purchase for lifetime access.
Can I get future updates?
Yes, you will receive all future updates to this template at no additional cost. This ensures that you always have access to the latest features and improvements.
Do you offer any discounts?
At this time, we do not offer any discounts on this template. However, the template is available for a one-time purchase, which provides lifetime access and free updates.
Do you have any access to my financial data?
No, we do not have access to your financial data when you use this template. The template is designed to be used in your own Google Sheets account, ensuring that your financial information remains private and secure.
Is this template financial advice?
Our templates are not financial advice. They are tools designed to help you manage your personal finances more effectively. If you need personalized financial advice, consider consulting with a financial advisor or accountant.
Can I make my own changes and customize this template?
Yes, you can make your own changes and customize this template to suit your needs. The template is designed to be flexible and adaptable, allowing you to add or remove sections, change formulas, and adjust formatting as needed.
Do you offer technical support?
This is a self-service product, and we do not offer technical support. However, if you encounter any issues or have any questions about the template, please contact our team for assistance. Because everyone's financial situation is unique, consider consulting with a financial advisor or accountant if you need personalized financial advice.
Do you offer refunds?
All sales are final. Because these are digital products delivered instantly, we do not offer refunds.
Can't find the answer you're looking for? Contact our team
Highlights:
Forecast the Next Twelve Months
Get the Sales Forecasting template and start building trend-plus-seasonal monthly forecasts with low, base, and high bands in Excel or Google Sheets.