Tiny Agency Capacity Spreadsheet Template for Excel & Google Sheets
An operating model for a 2 to 5 person services firm. Track per-person utilization over a 12-week horizon, run a stage-weighted project pipeline, see revenue and gross margin from active work, and let the hiring trigger flag when capacity is too thin. Works in Microsoft Excel and Google Sheets.
One-time purchase
Tiny Agency Operating Model
Everything in This Agency Operating Model

Your Agency at a Glance
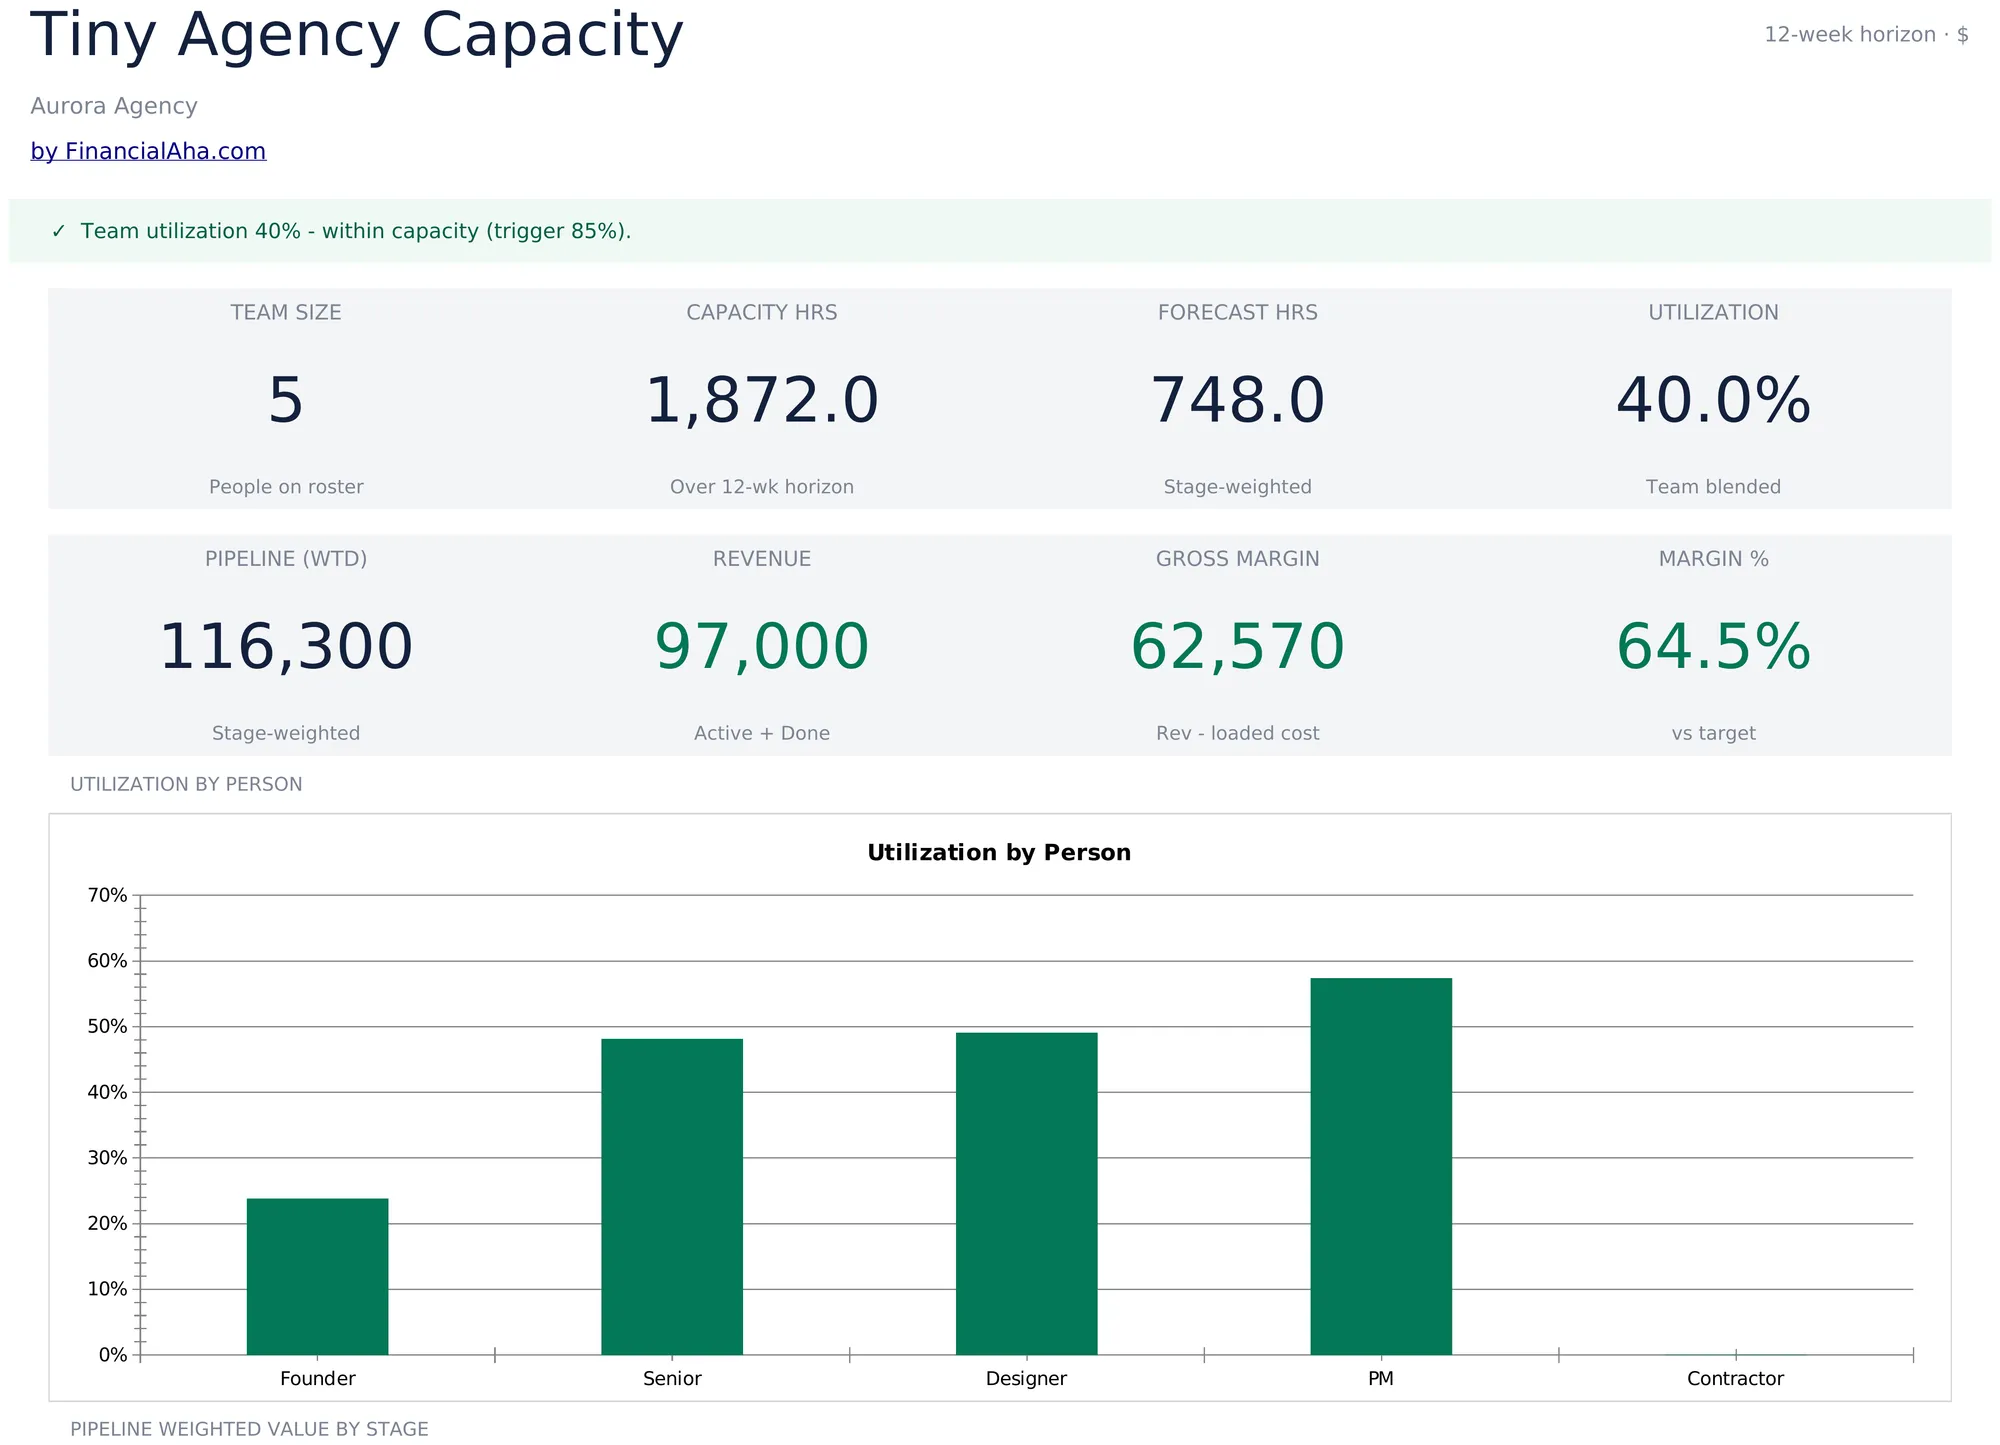
Open the dashboard and see where the agency stands. Team size, capacity hours, forecast hours, and blended utilization sit on the top row. Weighted pipeline, revenue, gross margin, and margin percent sit beneath. A banner flags whether utilization is above or below the hiring trigger.
- 8 KPI cards covering utilization, pipeline, and margin
- Banner flags utilization above the hiring trigger
- Utilization by person and pipeline by stage charts
Roster With Bill and Cost Rates
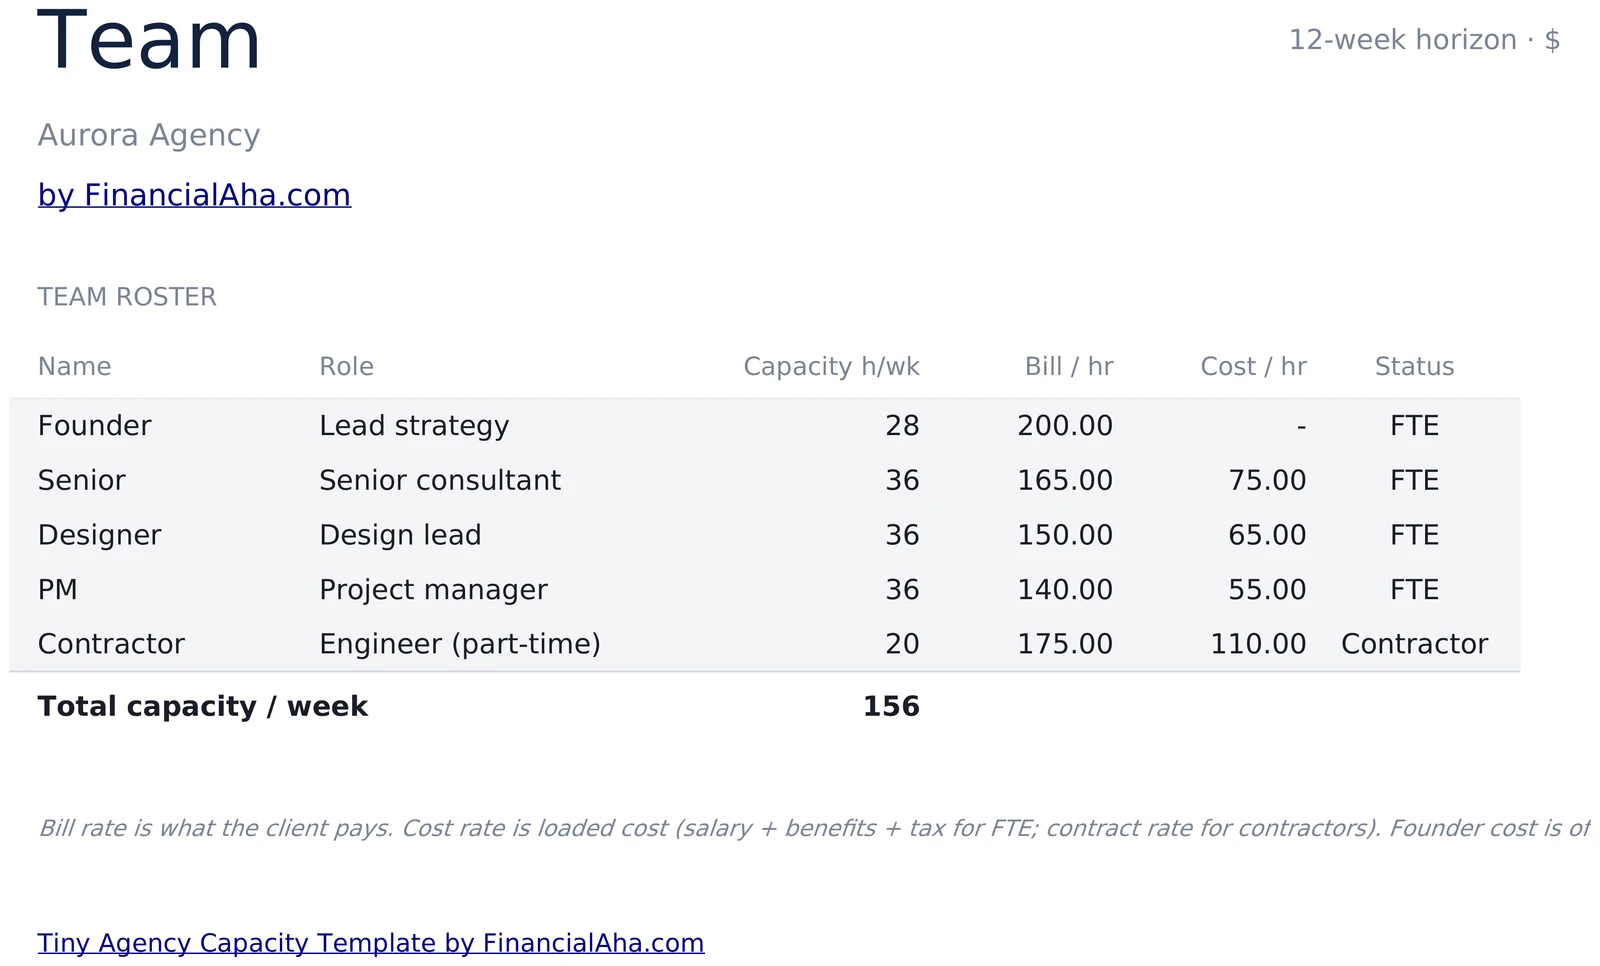
One row per person with role, weekly capacity hours, bill rate per hour, cost rate per hour, and status (FTE or Contractor). Total weekly capacity rolls up at the bottom. Founder cost is often zero since founders are not on salary.
- Name, role, capacity h/wk, bill rate, cost rate, status
- Mix FTEs and contractors in the same roster
- Total weekly capacity feeds every other sheet
Stage-Weighted Project Pipeline
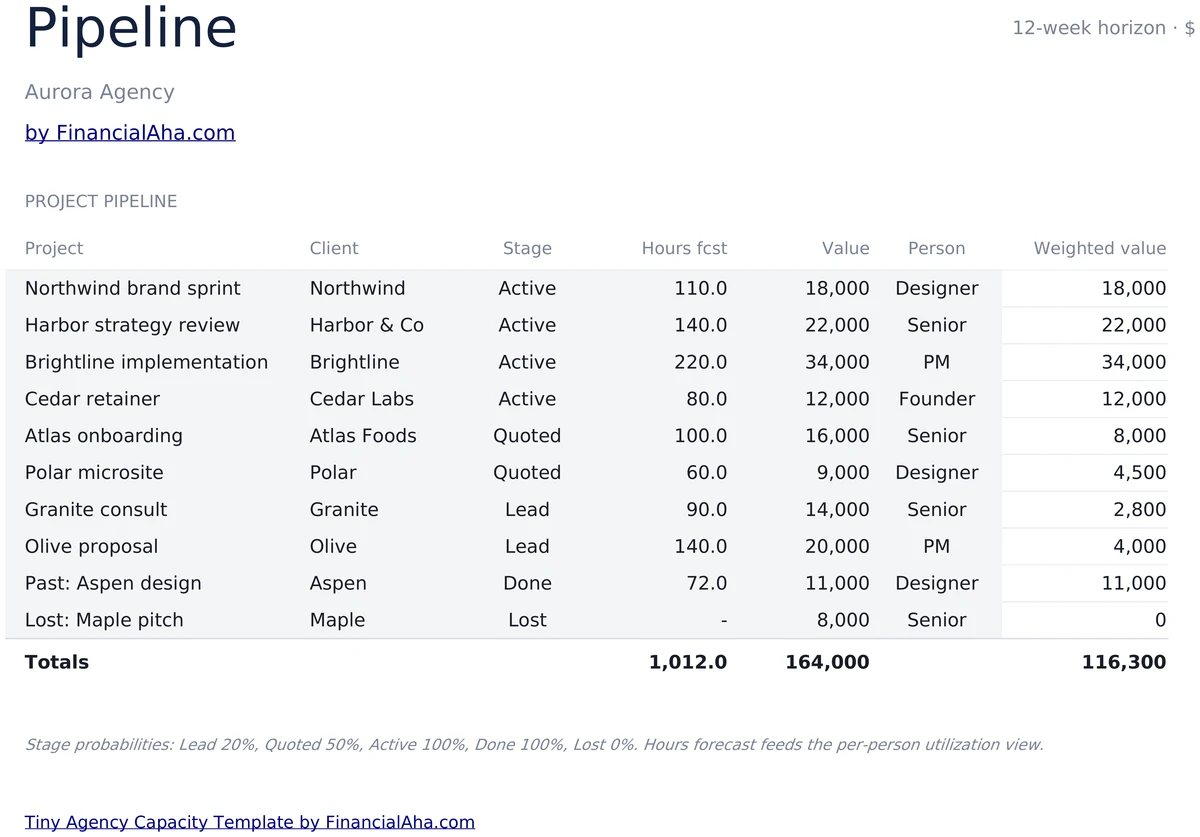
One row per project with client, stage, hours forecast, value, and assigned person. Stage probabilities (Lead 20%, Quoted 50%, Active 100%, Done 100%, Lost 0%) drive a weighted value column. Totals at the bottom feed the dashboard.
- Project, client, stage, hours forecast, value, person
- Stage weights: Lead 20%, Quoted 50%, Active 100%, Done 100%
- Weighted value totals roll into the dashboard
Per-Person Over, On, or Under
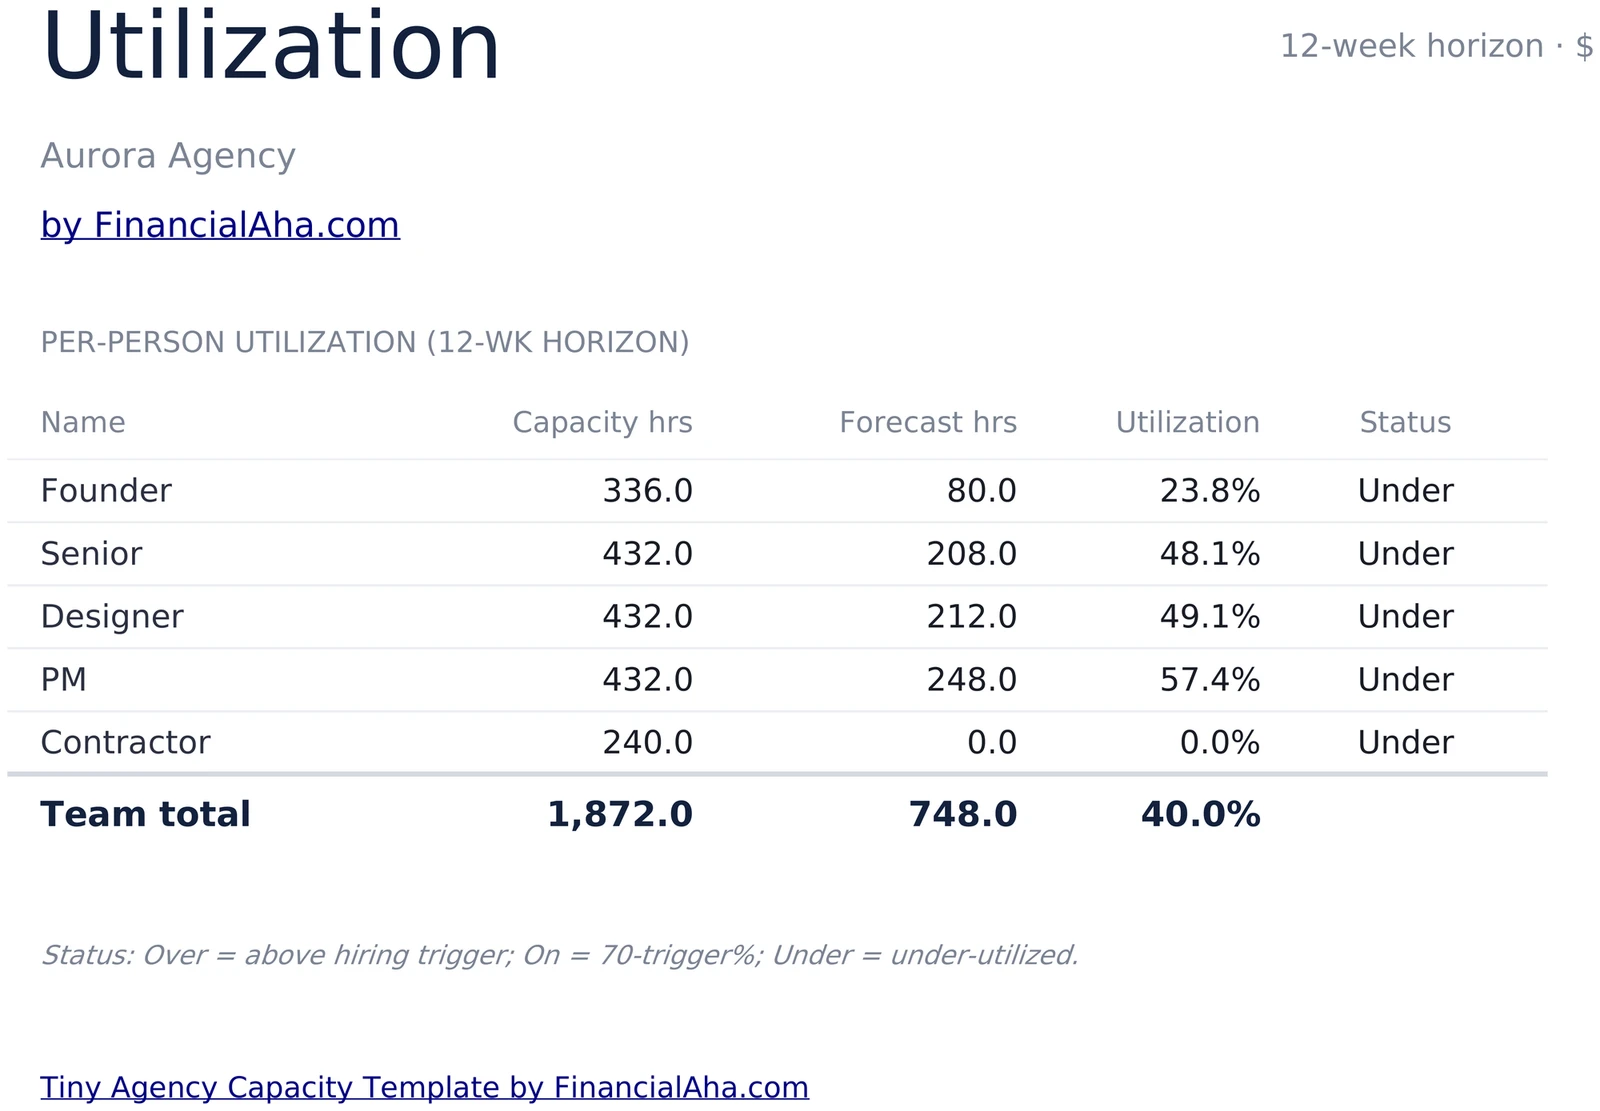
For each person, capacity hours equal weekly capacity times the forecast horizon. Forecast hours come from a SUMPRODUCT across the pipeline by assigned person and stage weight. Utilization equals forecast over capacity, and a status column flips Over, On, or Under against your hiring trigger.
- Capacity hours = h/wk × horizon weeks
- Forecast hours stage-weighted from pipeline
- Status: Over, On, or Under vs hiring trigger
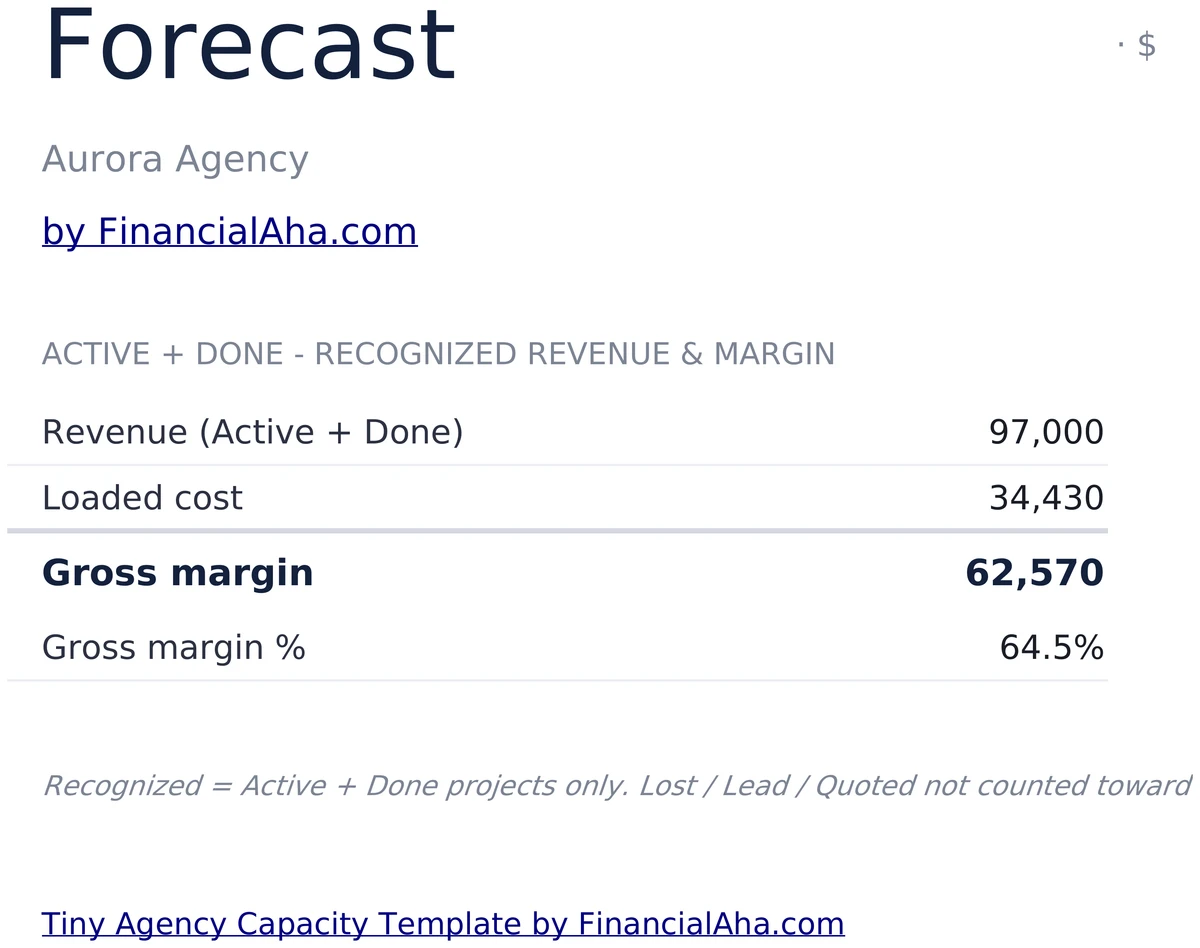
Revenue, Loaded Cost, and Gross Margin
Revenue equals the sum of Active and Done project values. Loaded cost is a SUMPRODUCT across the pipeline by person, matched to each person's cost rate on Team. Gross margin is revenue minus loaded cost, and margin percent is gross margin over revenue.
- Revenue = sum of Active + Done values
- Loaded cost = pipeline hours × cost rate per person
- Gross margin and margin % calculated for you
Two Charts on the Dashboard
A column chart shows utilization by person so you can see who is overloaded and who has runway. A second column chart shows weighted pipeline value by stage (Lead, Quoted, Active, Done) so you can see where the deal flow is concentrated.
- Utilization by person column chart
- Weighted pipeline by stage column chart
- Both charts update as you edit the team and pipeline
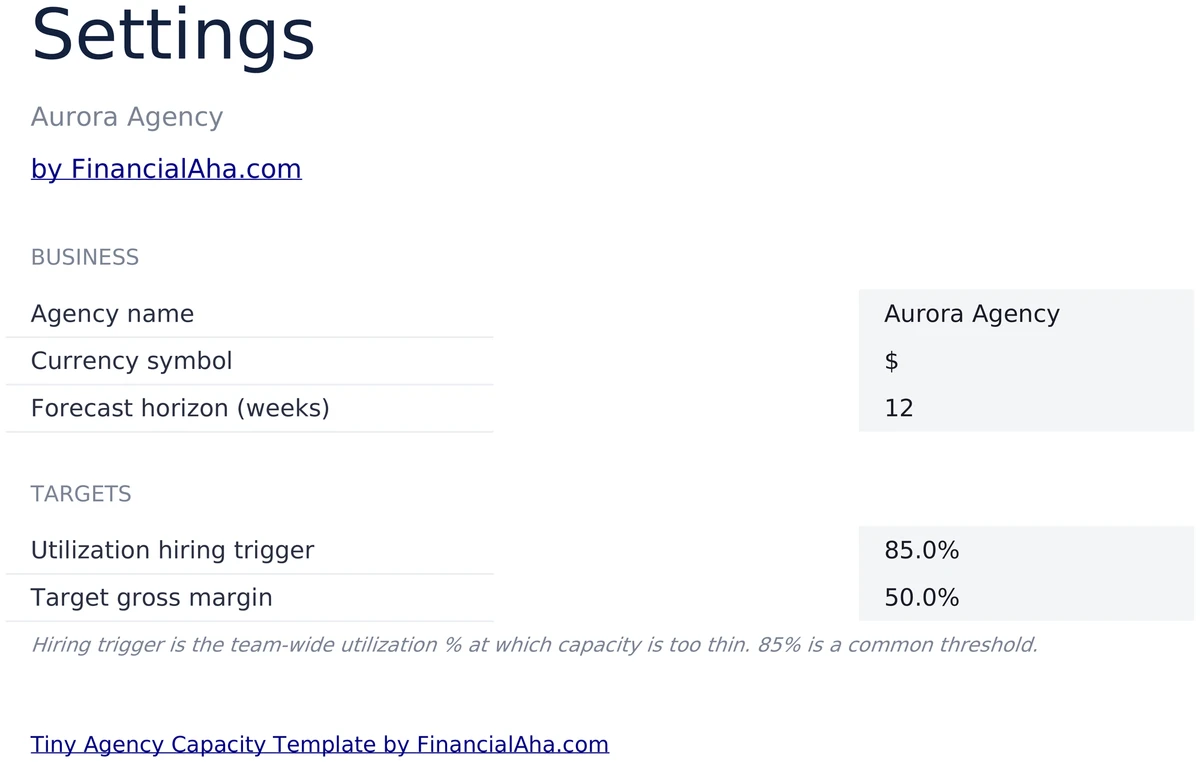
Configure It for Your Agency
Set your agency name, currency symbol, and forecast horizon in weeks. Set the utilization hiring trigger (85% is a common threshold) and target gross margin. The rest of the workbook reads these values, so the dashboard, utilization, and forecast all stay in sync.
- Agency name, currency, forecast horizon
- Utilization hiring trigger (default 85%)
- Target gross margin (default 50%)
Up and Running in 20 Minutes
Start on Settings, list your team with bill and cost rates, then add projects to Pipeline with a stage and assigned person. Utilization and Forecast update from there. Light gray cells are inputs - everything else is formulas.
- Settings, then Team, then Pipeline
- Light gray cells are inputs - the rest is formulas
- Built for 2 to 5 person services firms
Customizable & Flexible
Adapt the workbook to your agency. Add team members, change stage probabilities by editing the pipeline column, adjust the hiring trigger - the formulas update automatically. Works identically in Excel and Google Sheets.
- Add or remove team rows
- Adjust hiring trigger, margin target, and horizon
- Excel and Google Sheets compatible
Ready to take control of your finances?
Set Up in 20 Minutes
How the Tiny Agency Capacity Model Works
Open in Excel or Google Sheets
Get instant access after purchase. Open in Microsoft Excel directly, or import into Google Sheets - no software to install, no add-ons.
Configure Your Agency
On Settings, set agency name, currency, forecast horizon, utilization hiring trigger, and target gross margin. Takes a few minutes.
Add Team and Projects
List your team on Team with bill and cost rates. Add projects to Pipeline with stage, hours forecast, value, and assigned person.
Read Utilization and Margin
Utilization shows per-person status against the hiring trigger. Forecast shows revenue, loaded cost, gross margin, and margin percent.
Customer Reviews
Used by Small Agencies and Services Firms Worldwide
"If I get half as good at handling my finances as you are at customer service, this'll be the best $26 I've spent lately."
"Great tool! Simplifies financial planning without the hassle of complex spreadsheets."
"I recently purchased your super convenient spreadsheet, it really helps me!"
"They're great and super intuitive. Thank you!"
Built for 2 to 5 Person Firms
Why Small Agencies Use This Workbook
Built for Small Services Firms
Team, pipeline, utilization, and margin in one workbook. No PSA system, no time tracker, no monthly close.
No Formulas to Write
Enter team and pipeline data in highlighted input cells. Utilization, revenue, loaded cost, and margin are pre-built.
Excel and Google Sheets
Works identically in Microsoft Excel and Google Sheets. No macros, no add-ons, no proprietary functions.
Free Lifetime Updates
All future improvements to the capacity model included at no extra cost.
Your Agency Data Stays Private
Runs entirely in your spreadsheet. Your team and pipeline data stay in your file - we never see or store it.
One-Time Purchase
Pay once, use forever. No subscriptions, no monthly fees, no recurring charges.
Got Questions?
Frequently Asked Questions
Is this template free to use?
This template is not free, but it is available for a one-time purchase. This purchase gives you lifetime access to the template and all future updates.
What do you mean by lifetime access?
Lifetime access means that you will have access to this template for as long as you need it. You will not be required to pay any additional fees for continued access to the template or any future updates.
Do I need to sign up to use this template?
You don't need to create an account with us. The template works in Google Sheets, so you'll need a Google account. If you don't have one, you can create one for free at google.com. After you purchase the template, copy it to your Google Drive, and start using.
What are the benefits of using this template?
This template offers a range of benefits, including: Easy-to-use interface, Customizable to suit your needs, Secure and private, Regular updates and improvements, One-time purchase for lifetime access.
Can I get future updates?
Yes, you will receive all future updates to this template at no additional cost. This ensures that you always have access to the latest features and improvements.
Do you offer any discounts?
At this time, we do not offer any discounts on this template. However, the template is available for a one-time purchase, which provides lifetime access and free updates.
Do you have any access to my financial data?
No, we do not have access to your financial data when you use this template. The template is designed to be used in your own Google Sheets account, ensuring that your financial information remains private and secure.
Is this template financial advice?
Our templates are not financial advice. They are tools designed to help you manage your personal finances more effectively. If you need personalized financial advice, consider consulting with a financial advisor or accountant.
Can I make my own changes and customize this template?
Yes, you can make your own changes and customize this template to suit your needs. The template is designed to be flexible and adaptable, allowing you to add or remove sections, change formulas, and adjust formatting as needed.
Do you offer technical support?
This is a self-service product, and we do not offer technical support. However, if you encounter any issues or have any questions about the template, please contact our team for assistance. Because everyone's financial situation is unique, consider consulting with a financial advisor or accountant if you need personalized financial advice.
Do you offer refunds?
All sales are final. Because these are digital products delivered instantly, we do not offer refunds.
Can't find the answer you're looking for? Contact our team
Highlights:
Run Your Agency on Real Utilization, Not Gut Feel
Get the Tiny Agency Capacity and Utilization template and see who is overloaded, what the pipeline is worth, and what margin Active work is producing.