Lifetime Deal Complete Personal Financial Planning Bundle →
✓ Financial Planning✓ Net Worth Tracker✓ Monthly Budgeting✓ Travel Budget Planner✓ Annual Budgeting Planner✓ Monthly Expense Tracker✓ Annual Tax Planner✓ Retirement Planning
View Bundle →

Instant digital delivery · Terms & Conditions apply

Ultimate Template - Excel & Google Sheets

Ultimate Profit & Loss Projection Spreadsheet Template for Google Sheets & Excel

Ten revenue streams across twelve months, four cost of goods sold lines and nine operating expense categories, each on a sheet of its own. The Ultimate Profit & Loss Projection spreadsheet template consolidates all three into a monthly statement, adds an annual planned-against-actual block with variance in money and percent, and drives a scenario sheet from multipliers you set. Six working sheets, Google Sheets and Excel. No macros, no VBA.

See Preview

Instant digital delivery · Terms & Conditions apply

Profit & Loss Projection Spreadsheet Template - Ultimate version for Google Sheets and Excel

What's Included

  • Ten revenue streams across twelve months, each stream summarised annually
  • Cost of goods sold on its own sheet, with monthly gross profit and margin
  • Operating expense categories across the same twelve months
  • A monthly consolidated statement reading all three data sheets
  • An annual planned-against-actual block with variance in money and percent
  • Three revenue multipliers you set, driving a full scenario comparison
  • A monthly net income row per scenario across twelve months
  • Month-on-month growth per stream, derived from its own January and December
  • A dashboard with annual revenue, gross profit and net income, and two charts
  • A currency dropdown that relabels the money columns across every sheet
  • Works in Microsoft Excel and Google Sheets with no setup required

The FinancialAha Ultimate Profit & Loss Projection Spreadsheet Template is a six-sheet workbook for Google Sheets and Excel, with a How to Use guide on a seventh tab. It works as an Ultimate Profit & Loss Projection Excel template and an Ultimate P&L Projection Google Sheets template from the same download. Twelve months of revenue, cost of goods sold and operating expenses on sheets of their own, consolidated into a monthly statement, with a scenario sheet driven by multipliers you set. No macros, no VBA.

Inside the workbook

What's inside the FinancialAha Ultimate Profit & Loss Projection spreadsheet template

The FinancialAha Ultimate Profit & Loss Projection Spreadsheet Template runs on six working sheets, with the instructions on a tab of their own. It works in both Microsoft Excel and Google Sheets and here is what the Ultimate P&L Projection spreadsheet holds.

  1. 01 of 06

    Revenue Forecast

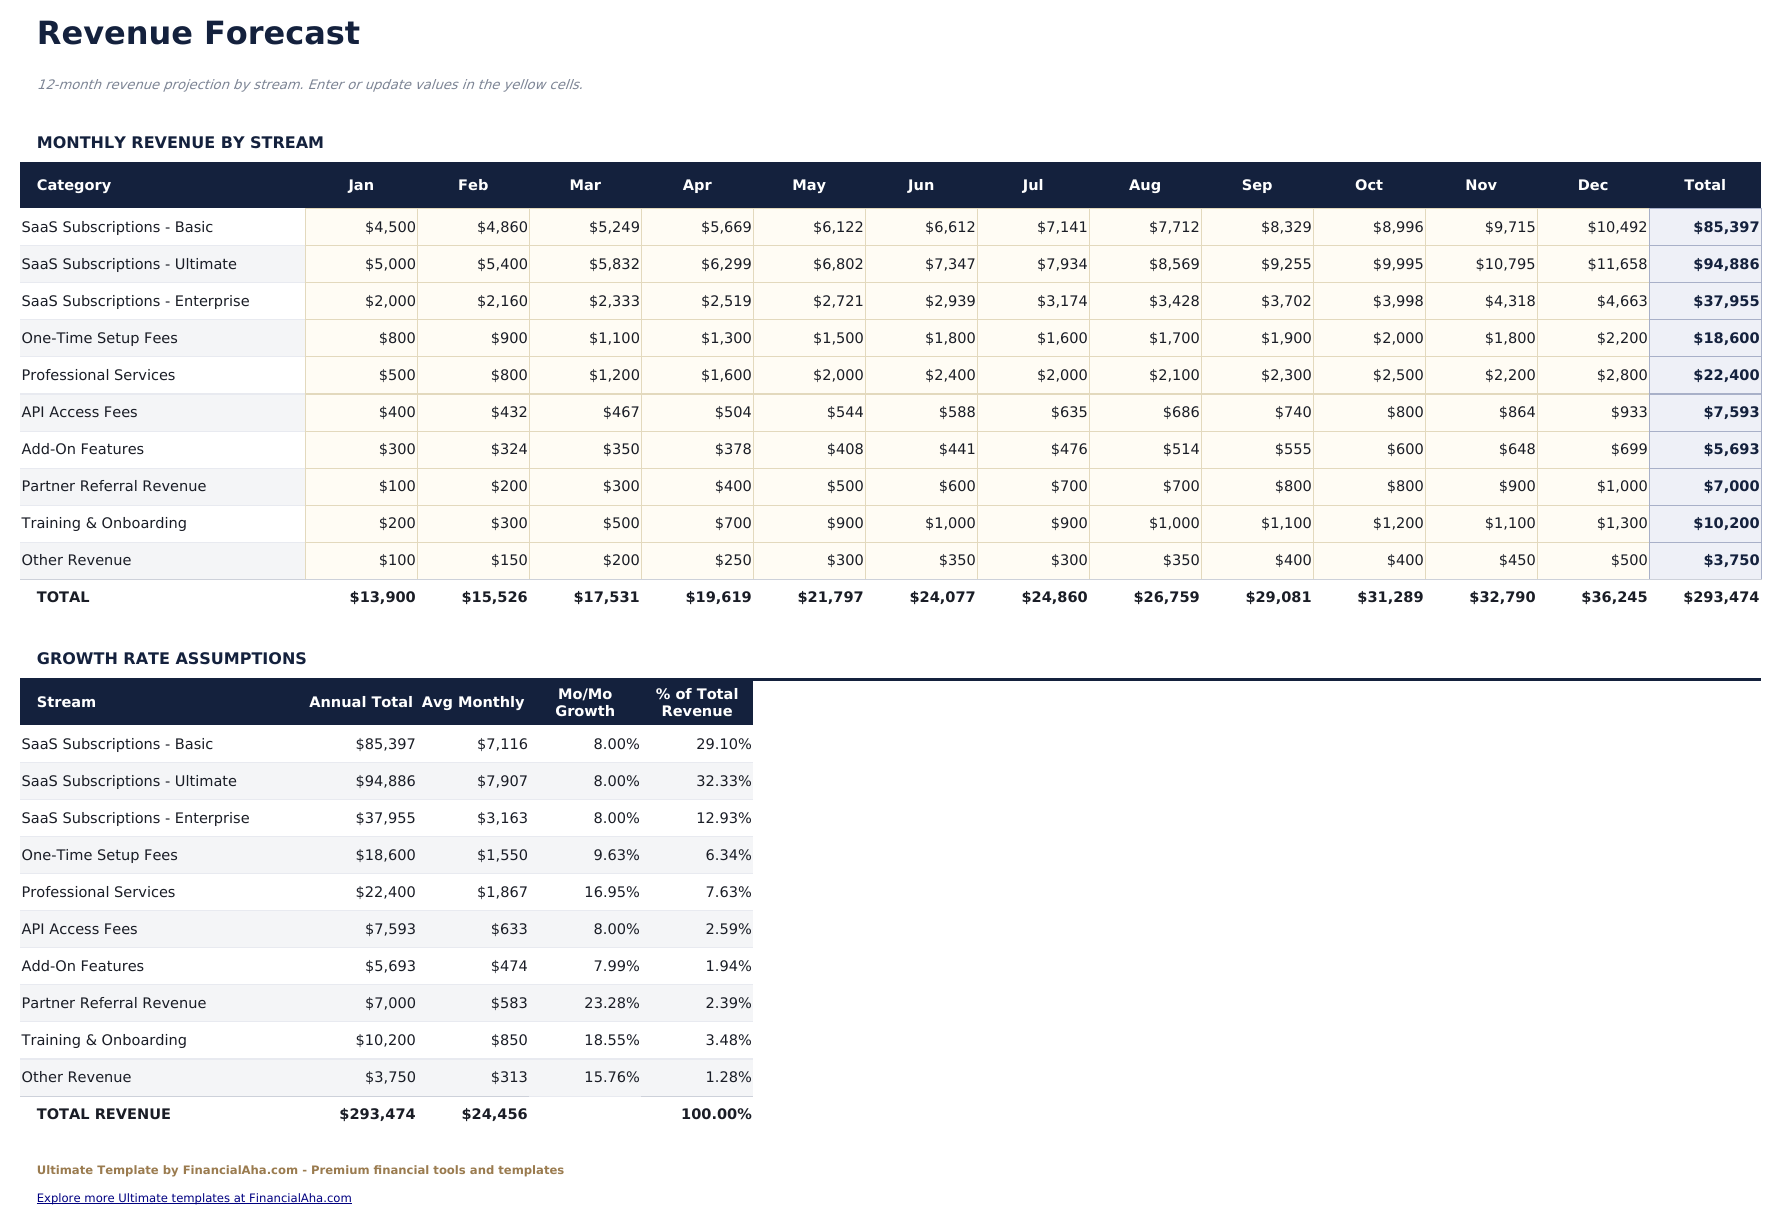
    Ten revenue streams across twelve months, each month typed and each row totalled. Beneath sits an annual block that reads the grid above it: each stream's annual total, its monthly average, its share of total revenue, and the month-on-month growth implied by its own January and December. Separating revenue into streams rather than one line is what makes the rest of the workbook answerable. A business whose recurring revenue is flat while one-off fees carry the year has a different problem from one growing evenly, and a single revenue row hides which of the two you are.

  2. 02 of 06

    COGS

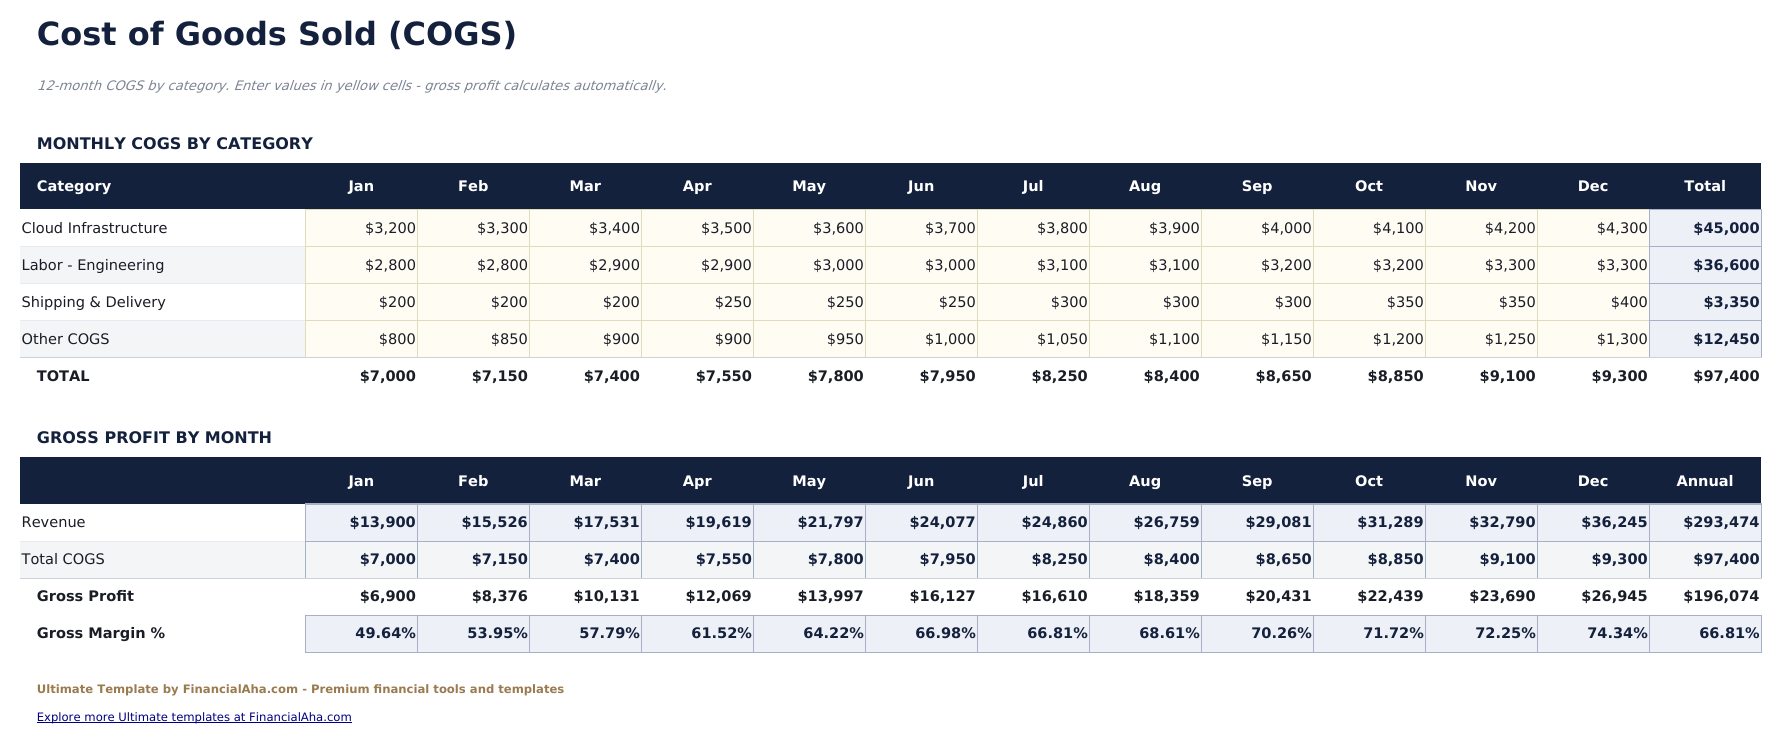
    Four cost of goods sold categories across the same twelve months, with a gross profit block underneath that sets the month's revenue against the month's direct costs and states the margin. Keeping cost of goods sold on its own sheet rather than mixed into operating expenses is what makes gross margin meaningful - it is the difference between what a sale costs to deliver and what it costs to run a business at all.

  3. 03 of 06

    Operating Expenses

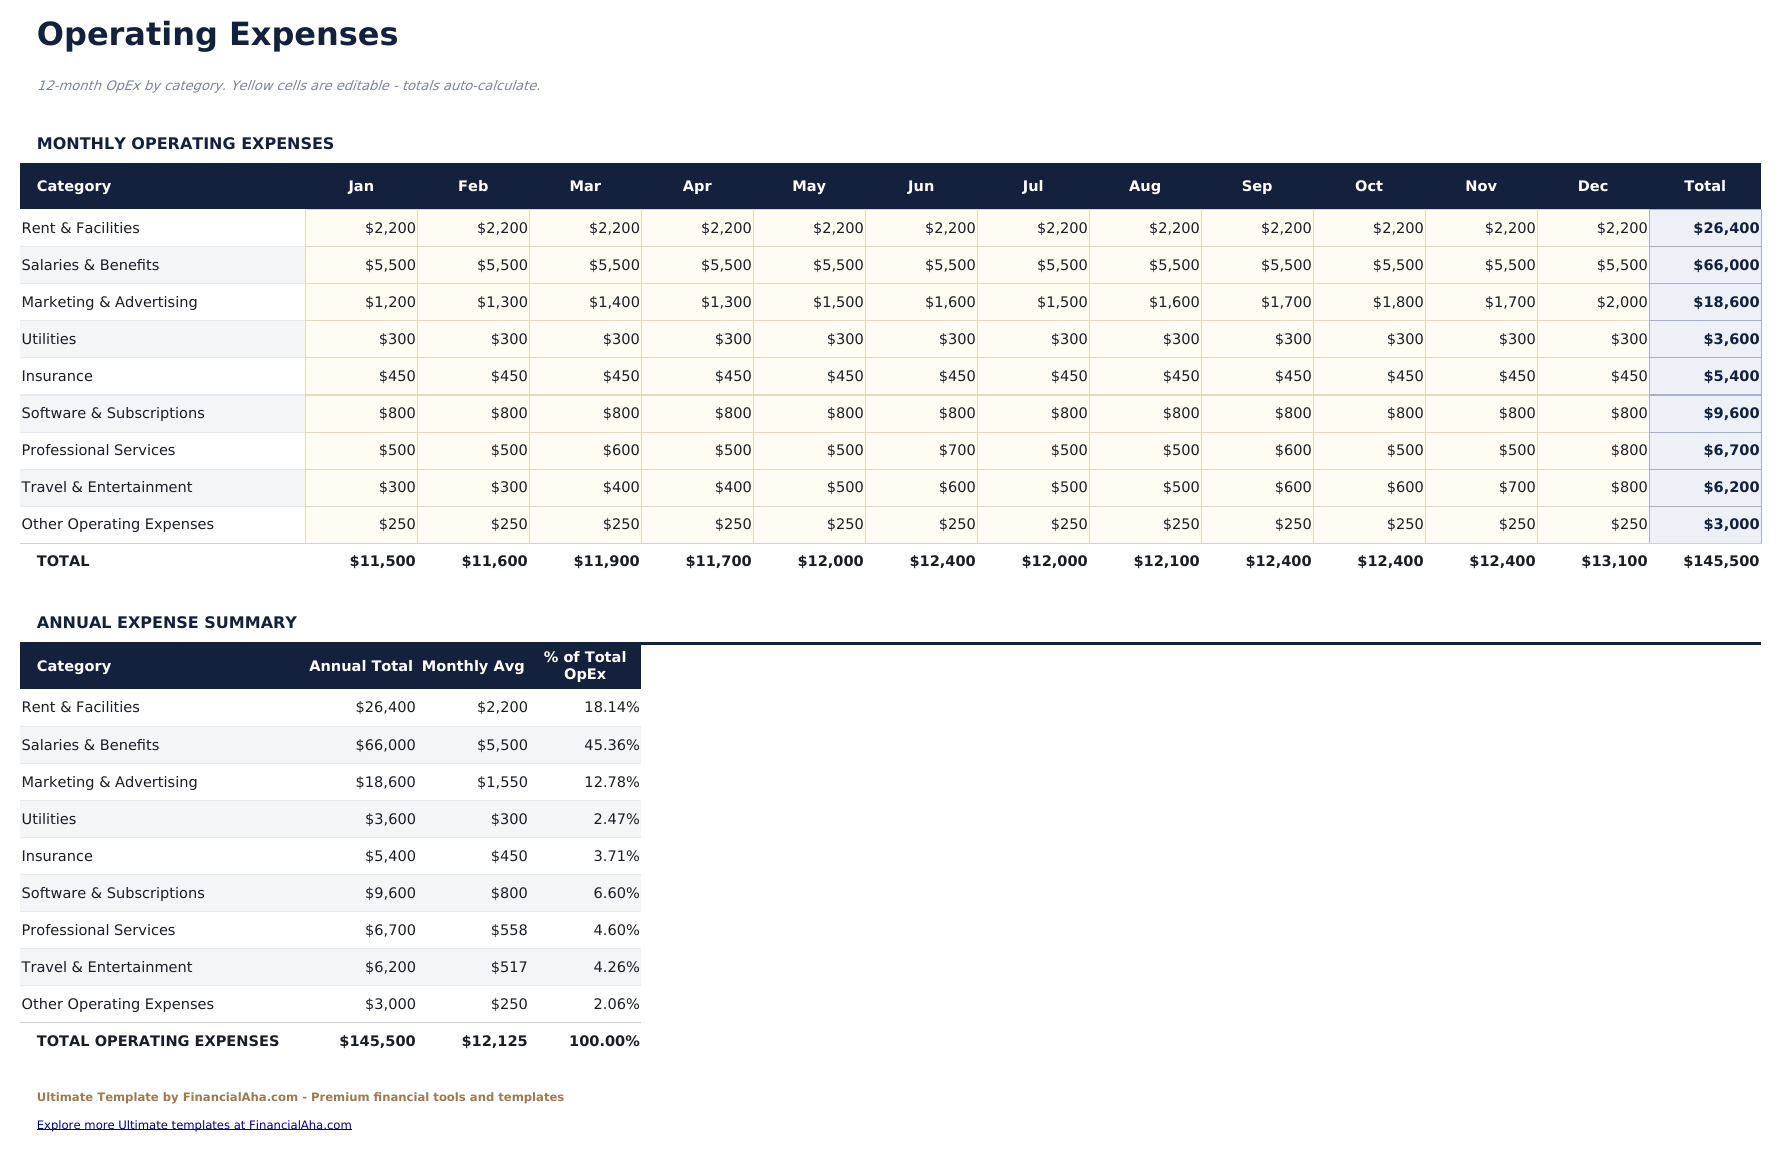
    Operating expense categories across twelve months, with an annual summary reading each category's total and monthly average. These are the costs that do not move with a sale, which is why they sit apart from cost of goods sold and why they stay put across all three scenarios.

  4. 04 of 06

    P&L Statement

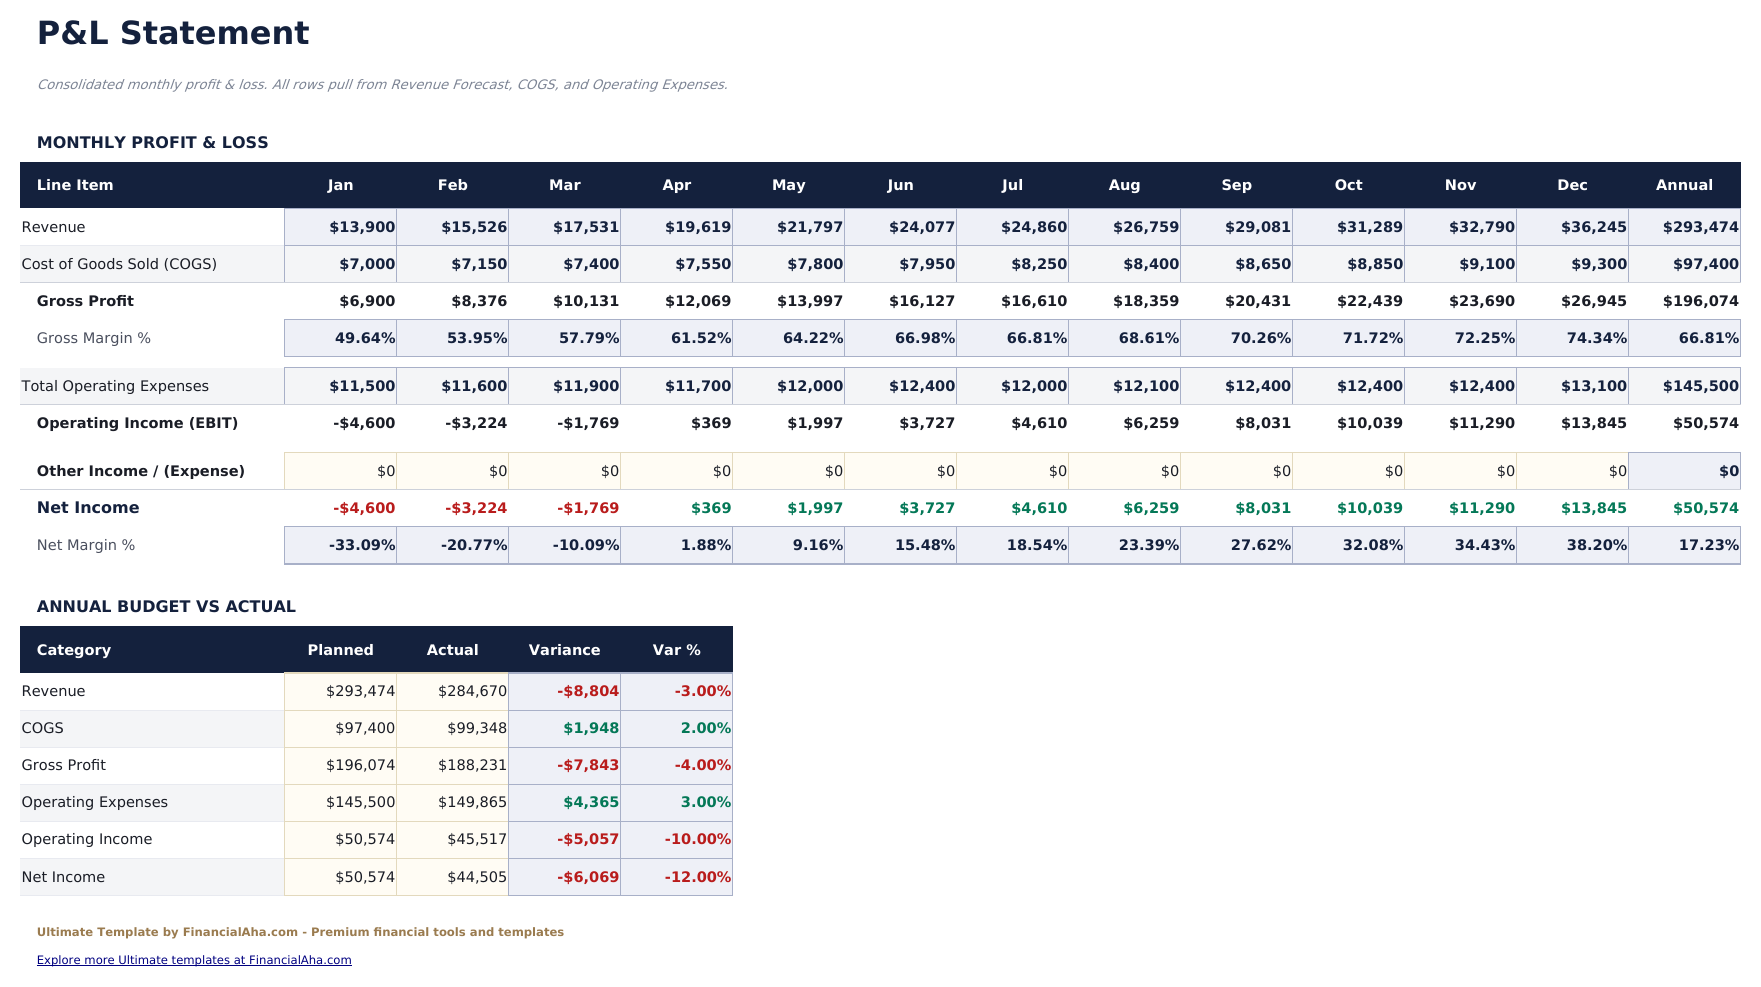
    The consolidation. Revenue, cost of goods sold, gross profit and margin, operating expenses, operating income, other income and net income and margin - every month across, an annual column down the right, and every figure read from the three data sheets rather than retyped. Underneath sits an annual block that sets the plan against the actual line by line, with the variance in money and as a percentage. The planned column is the annual column of the statement directly above it, so it moves when the forecast moves; the actual column is yours to fill in as the year closes.

  5. 05 of 06

    Scenario Analysis

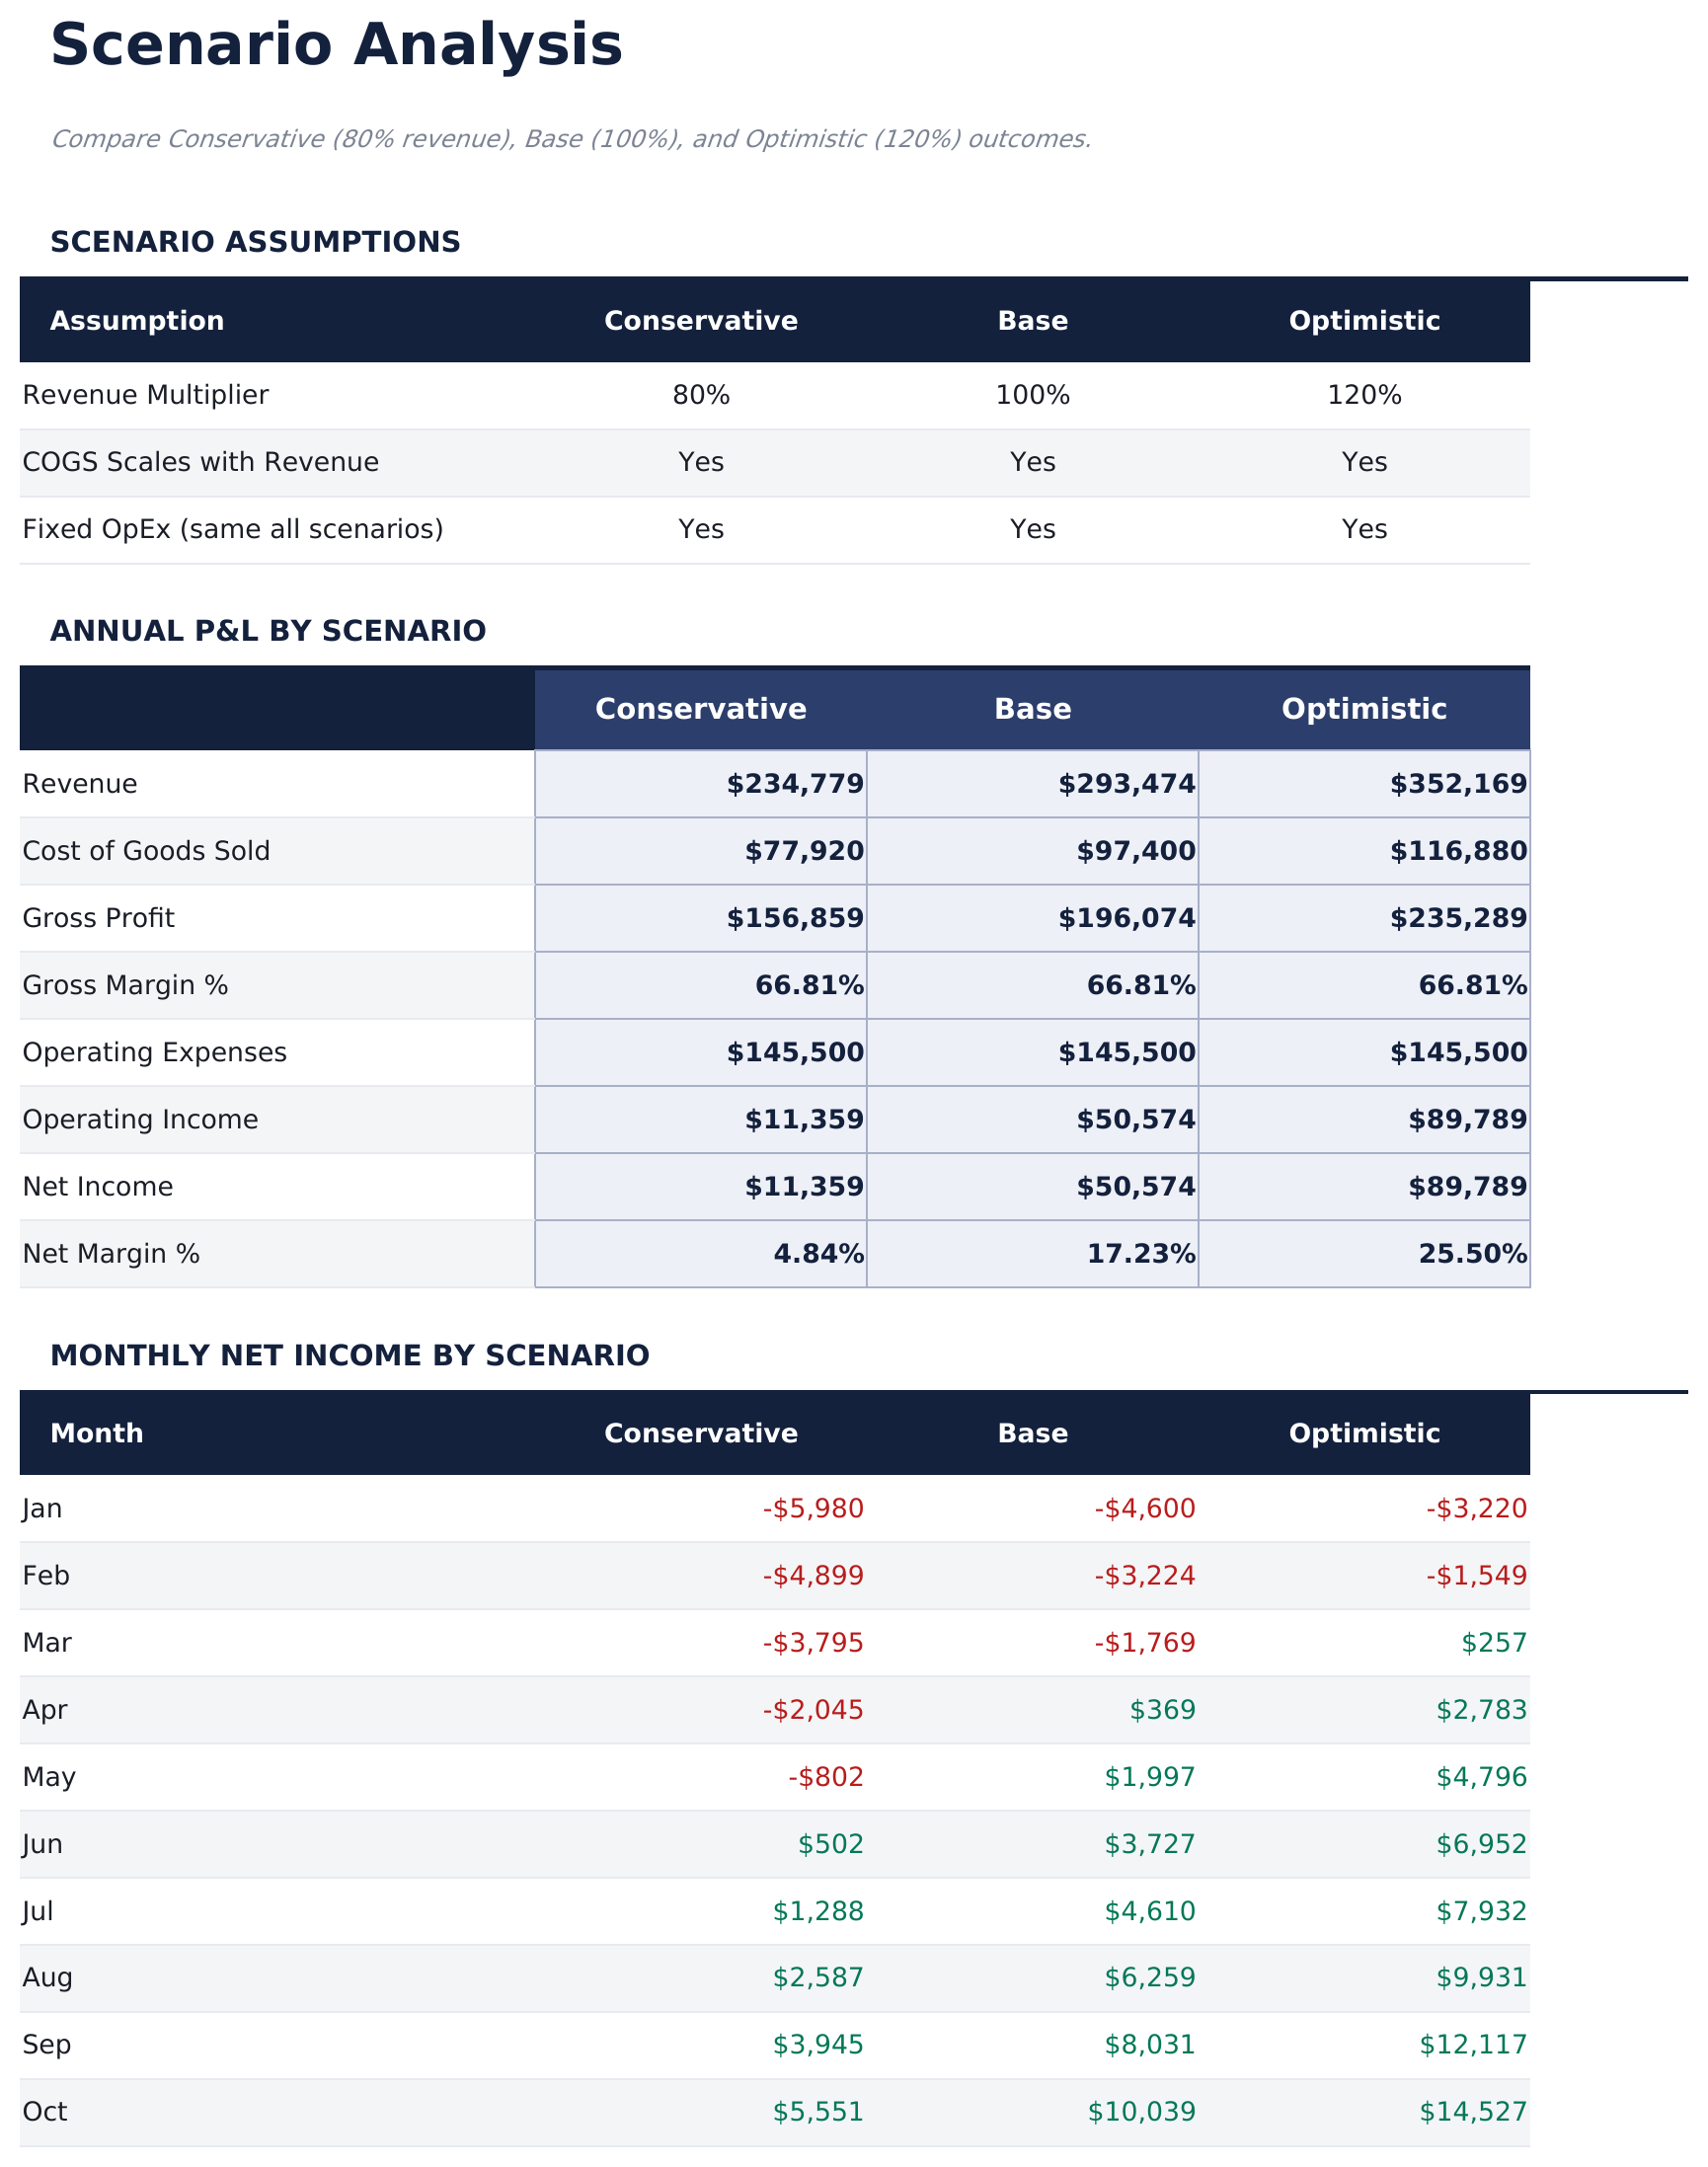
    Three revenue multipliers in editable cells - conservative, base and optimistic - and everything beneath them reads those cells and the statement. Revenue and cost of goods sold scale together, which leaves gross margin unchanged; operating expenses do not scale at all, which is what makes the three columns differ by much more than the multiplier does. That is the whole point of the sheet. A business with heavy fixed costs sees a twenty percent revenue shortfall arrive at the bottom line multiplied, and a comparison that scaled everything proportionally would never show it. The monthly net income rows follow the same logic, so the month a scenario turns from red to black is visible rather than inferred.

  6. 06 of 06

    Dashboard

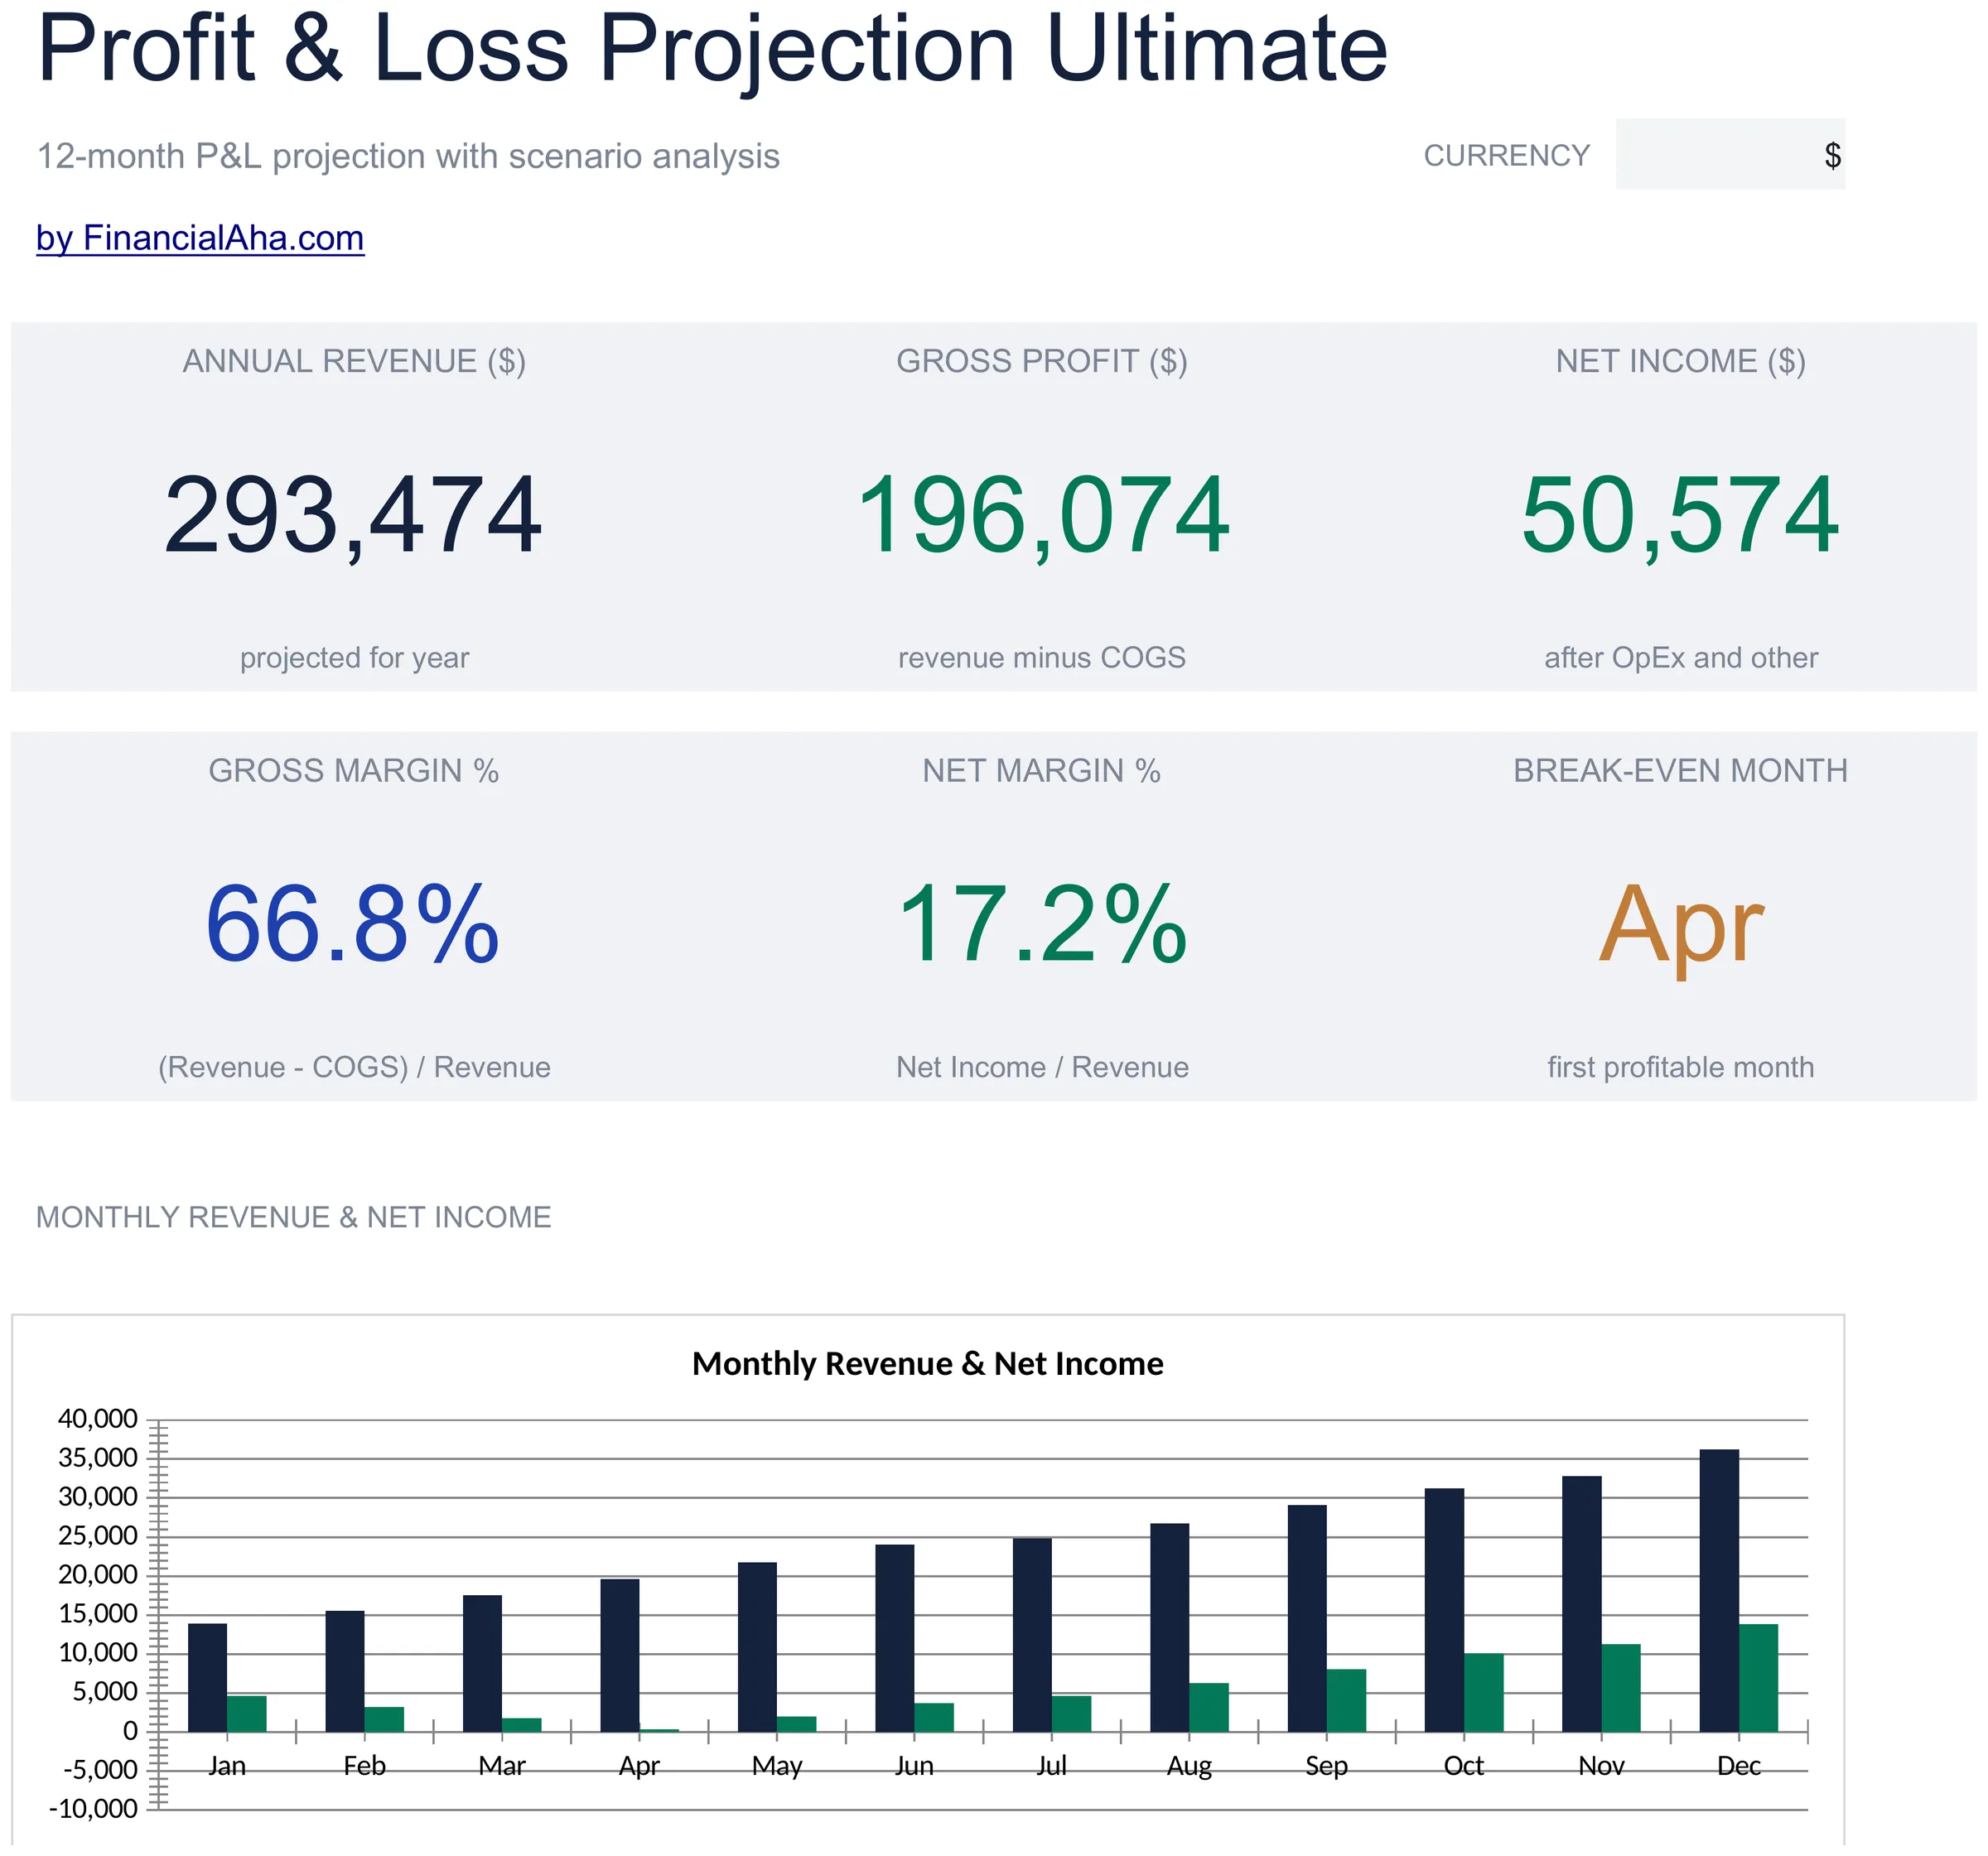
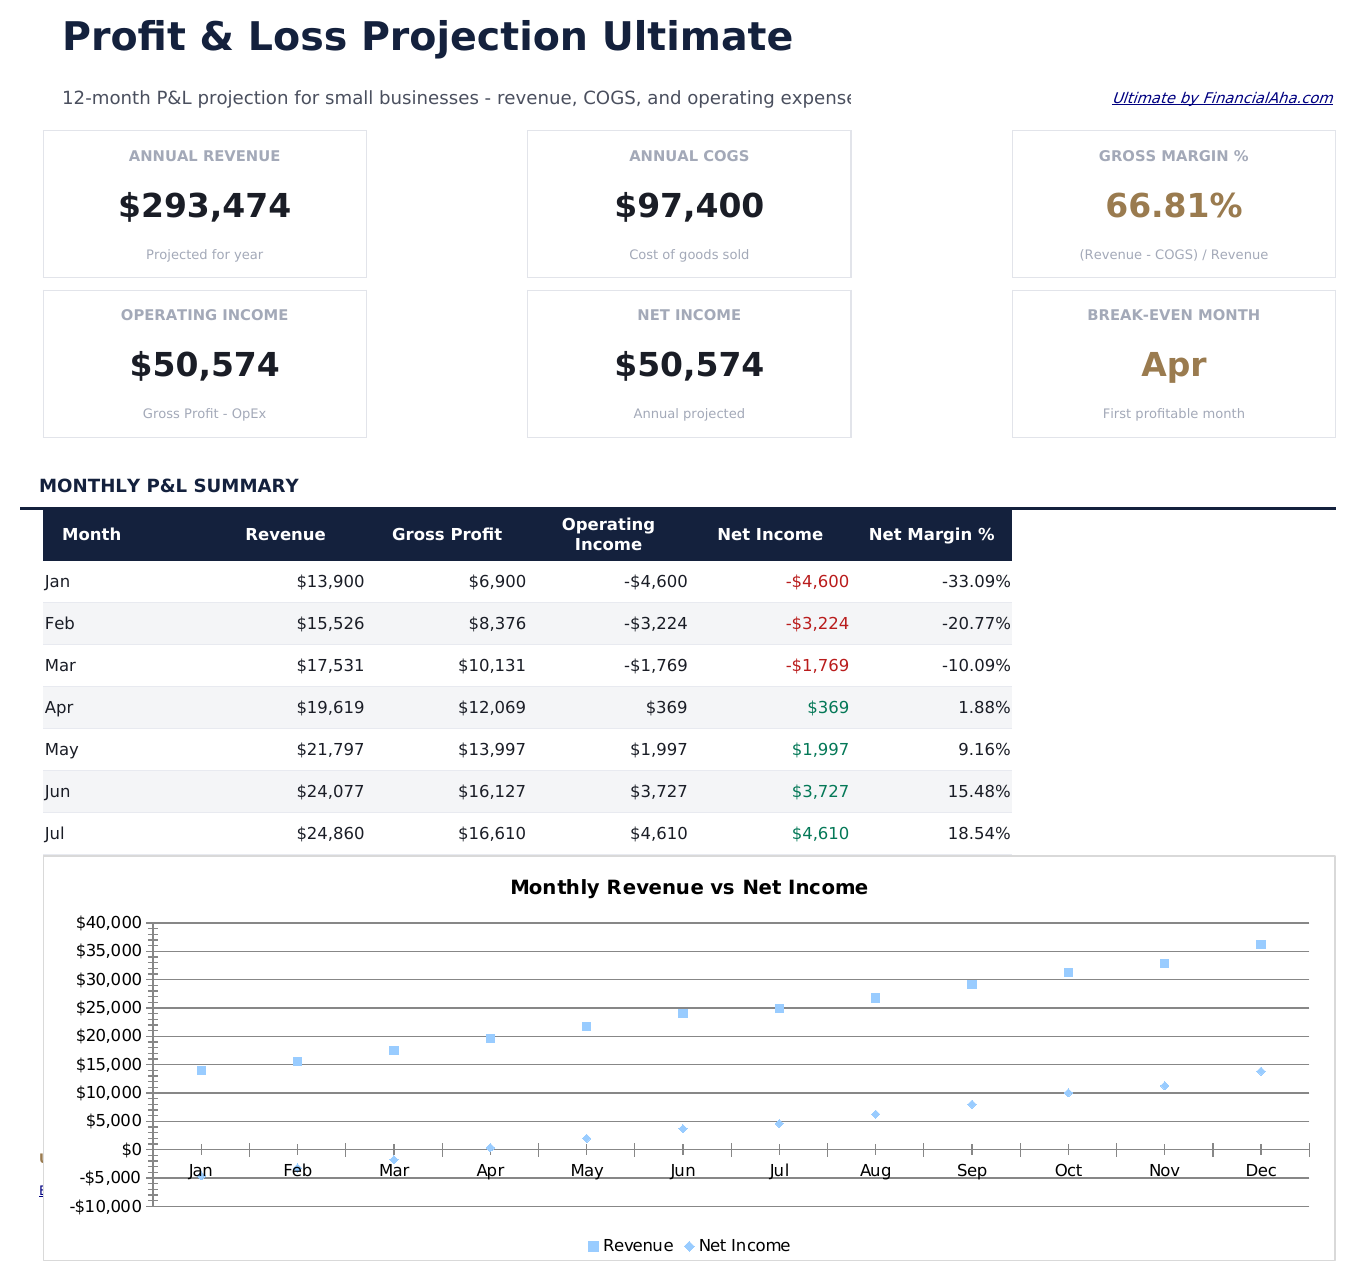
    Annual revenue, gross profit and net income across the top, read from the statement, with the gross and net margins those imply beneath them, plus the first month the statement turns profitable - and two charts: revenue against expenses month by month, and where the money goes by category. The two margins are worth reading together. A gross margin that holds while the net one falls says the cost of delivery is fine and the cost of running the business is not, which is a different problem with a different fix.

  7. Included guide

    How to Use

    A step-by-step guide on its own tab, covering which sheets take input, how the statement consolidates them, what the scenario multipliers drive, and how to change the currency. Because it ships inside the file, the instructions travel with the template wherever it is opened.

Works in both Google Sheets and Excel

Ultimate Profit & Loss Projection Spreadsheet template for Google Sheets

Upload the Ultimate Profit & Loss Projection Spreadsheet Template to Drive, right-click it, and choose "Open with Google Sheets". This Ultimate P&L Projection Google Sheets template needs no conversion step, the cross-sheet references resolve, and both charts come across intact.

Ultimate Profit & Loss Projection Google Sheets template setup

A shared copy of the Ultimate P&L Projection Google Sheets template suits a team where one person owns the revenue forecast and another the cost sheets, since the statement consolidates whatever each of them last entered.

Running the Ultimate Profit & Loss Projection Google Sheets template

The Ultimate Profit & Loss Projection Google Sheet is a model. Months get updated as they close, and the statement, the dashboard and all three scenarios follow from those edits.

Ultimate Profit & Loss Projection Spreadsheet template for Excel

The Ultimate Profit & Loss Projection spreadsheet Excel download is a plain .xlsx. Excel opens this Ultimate P&L Projection Excel template directly, with no import step, and both charts are native Excel charts. There are no macros and no VBA in the file.

Ultimate Profit & Loss Projection Excel template setup

The same Ultimate P&L Projection Excel template opens in Excel on Windows, Excel on Mac, and Excel for the web. It is also the identical file you would upload to Drive, so there is no separate Ultimate Profit & Loss Projection spreadsheet download to choose between.

Ultimate Profit & Loss Projection spreadsheet template notes for Excel

The Ultimate Profit & Loss Projection spreadsheet Excel file carries no macros and no VBA, so Excel opens it without a trust prompt.

Opening the Ultimate Profit & Loss Projection spreadsheet Excel file

Nothing in the Ultimate P&L Projection Excel template is version-specific, so this Ultimate Profit & Loss Projection spreadsheet Excel workbook behaves identically in Excel on Windows, Excel on Mac, and older builds.

Spreadsheet template highlights

What the Ultimate Profit & Loss Projection spreadsheet template tracks

The Revenue Forecast grid is where most of the entry happens. This is what it carries per stream:

Category
the revenue stream, named the way your business names it
Jan
that stream's revenue for January, typed, and the same again for every month across
Dec
the last of the twelve, which together with January sets the growth the summary reports
Annual Total auto
derived across the twelve months, with a monthly average and a share of total revenue beside it

Compare builds

FinancialAha Profit & Loss Projection spreadsheet template: Free, Essentials, and Ultimate compared

Feature Free View Spreadsheet Template Essentials View Spreadsheet Template Ultimate This page
Working sheets 1 2 6
Period covered One period Three years Twelve months
Revenue lines Shared with expenses 3 10
COGS lines Shared with expenses 3 4
Operating expense lines Shared with revenue 11 9
Gross profit and margin – Yes Yes
EBITDA, tax and net income – Yes Operating income and net income
Operating income line – Yes Yes
Growth assumptions drive future periods – Yes –
Planned against actual Per line – Six annual lines
Scenario comparison – – Three multipliers you set
Charts – 2 2

The Free Profit & Loss Projection Spreadsheet Template covers one period on one page. The Essentials Profit & Loss Projection Spreadsheet Template projects three years from growth rates you set. The FinancialAha Ultimate Profit & Loss Projection Spreadsheet Template models a single year month by month instead: ten revenue streams, cost of goods sold and operating expenses on sheets of their own, a monthly consolidated statement with a planned-against-actual block, and a scenario sheet where three revenue multipliers you set drive an annual and a monthly comparison.

Good to know

Notes on working in the Ultimate Profit & Loss Projection spreadsheet template

  • Revenue, cost of goods sold and operating expenses each get their own sheet, and the statement consolidates them.
  • The scenario multipliers are cells you edit, and every figure on that sheet reads them.
  • Revenue and cost of goods sold scale together, so gross margin holds; operating expenses stay fixed, which is what moves the bottom line.
  • The planned column of the variance block reads the statement above it, so it follows a changed forecast.
  • Month-on-month growth per stream is derived from that stream's own January and December, not stated.
  • The currency dropdown on the Dashboard relabels the money columns across every sheet. It changes the label only and does not convert the numbers.
  • The break-even month on the dashboard reads the statement directly - a chain of checks finds the first month with a positive net income and names it, so it moves if the forecast does.

How to Use This Template

1

Forecast the revenue

Ten streams across twelve months on their own sheet.

2

Enter the costs

Cost of goods sold and operating expenses, each on its own sheet.

3

Read the statement

Monthly and annual, consolidated from the three sheets.

4

Set the scenarios

Three revenue multipliers, and the comparison follows.

Stress-tested with AI.

Every template starts with deep research into how people actually track the topic. We design the layout, build the formulas, and polish the design until it feels like something we would use ourselves. Along the way, we use AI to stress-test the calculations: unusual inputs, edge cases, and formula behavior, checked until the numbers hold.

One-time purchase. No subscription. Works in Excel & Google Sheets.

Frequently Asked Questions

Is the FinancialAha Ultimate Profit & Loss Projection Spreadsheet Template a Google Sheets template?

Yes. Upload the file to Drive and choose "Open with Google Sheets". The cross-sheet references in the Ultimate P&L Projection Google Sheets template resolve on import and both charts come across intact.

Is the FinancialAha Ultimate Profit & Loss Projection Spreadsheet Template an Excel template?

Yes. The download is a plain .xlsx, so the Ultimate Profit & Loss Projection Excel template opens directly in Excel with no import step, and both charts are native Excel charts.

Will the FinancialAha Ultimate Profit & Loss Projection spreadsheet Excel file open in older versions of Excel?

Yes. The Ultimate P&L Projection spreadsheet Excel workbook ships as a plain .xlsx, so it opens identically in current Excel and in builds that predate dynamic arrays.

How does the scenario comparison work in the Ultimate Profit & Loss Projection spreadsheet?

Three revenue multipliers sit in editable cells, and every figure below them reads those cells and the statement. Revenue and cost of goods sold scale together, so gross margin holds; operating expenses do not scale, which is what makes the bottom line move by much more than the multiplier does.

Why does a twenty percent revenue difference change net income by more in the Ultimate Profit & Loss Projection spreadsheet?

Because operating expenses stay where they are. Fixed costs are what turn a modest revenue shortfall into a larger one at the bottom line, and a comparison that scaled every row proportionally would hide it.

Where do I type in the Ultimate Profit & Loss Projection spreadsheet?

On the Revenue Forecast, COGS and Operating Expenses sheets, in the actual column of the planned-against-actual block, in the other income row of the statement, and in the three scenario multipliers. Everything else is read from those.

What is the planned column of the variance block in the Ultimate Profit & Loss Projection spreadsheet?

The annual column of the statement directly above it, read as a formula. A changed forecast moves it, so the variance is always against what you are currently projecting rather than against a figure the file shipped with.

Where does the month-on-month growth figure come from in the Ultimate Profit & Loss Projection spreadsheet?

Each stream's own January and December, compounded over the eleven months between them. It is derived from the forecast rather than stated alongside it.

Does the FinancialAha Ultimate Profit & Loss Projection spreadsheet project more than one year?

No. This build models a single year month by month. A three-year projection driven by growth rates is the Essentials build, which is a different shape rather than a smaller one.

What do I get after buying the Ultimate Profit & Loss Projection spreadsheet template?

You receive the Ultimate Profit & Loss Projection spreadsheet template as an Excel file (.xlsx) that works in Microsoft Excel and Google Sheets. Download it immediately after purchase - no signup or account required.

Is there a free Ultimate Profit & Loss Projection spreadsheet template?

Yes. A free version of the Ultimate Profit & Loss Projection spreadsheet template is available with basic features. The Ultimate version adds advanced analysis, more capacity, and additional sheets.

What if the Ultimate Profit & Loss Projection spreadsheet template does not work for me?

Contact us and we will help troubleshoot. The Ultimate Profit & Loss Projection spreadsheet template works in Microsoft Excel and Google Sheets with no macros required.

Ultimate

Highlights:

Instant download after purchase
No macros or VBA required
All formulas auto-calculate
No subscription required
Works in
Excel Google Sheets

Looking for more Ultimate templates?

We offer Ultimate versions of our most popular spreadsheet templates with advanced features, more capacity, and deeper analysis.

Private & secure

Your financial data stays on your device. We never see it.

Learn more →

Need help?

Check our guides or reach out with questions.

View FAQ →