Free Profit & Loss Projection Spreadsheet Template for Google Sheets & Excel
Revenue and costs sit on the same list, told apart by sign, with a projected figure in one column and an actual in the next. The Free Profit & Loss Projection spreadsheet template runs sixteen lines to net income both ways, and its Difference column reads correctly whether the row is income or expense. Projected and actual net income are restated at the top. Google Sheets or Excel. No macros, no VBA.
The FinancialAha Free Profit & Loss Projection Spreadsheet Template is a one-sheet workbook for Google Sheets and Excel, with a How to Use guide on a second tab. It works as a Free Profit & Loss Projection Excel template and a Free P&L Projection Google Sheets template from the same download. Revenue and costs carried together on the same lines, projected in one column and actual in the next, ending on net income both ways. No macros, no VBA.
Inside the workbook
What's inside the FinancialAha Free Profit & Loss Projection spreadsheet template
The FinancialAha Free Profit & Loss Projection Spreadsheet Template runs on a single working sheet, with the instructions on a tab of their own. It works in both Microsoft Excel and Google Sheets and here is what the Free P&L Projection spreadsheet holds.
01of 01
P&L
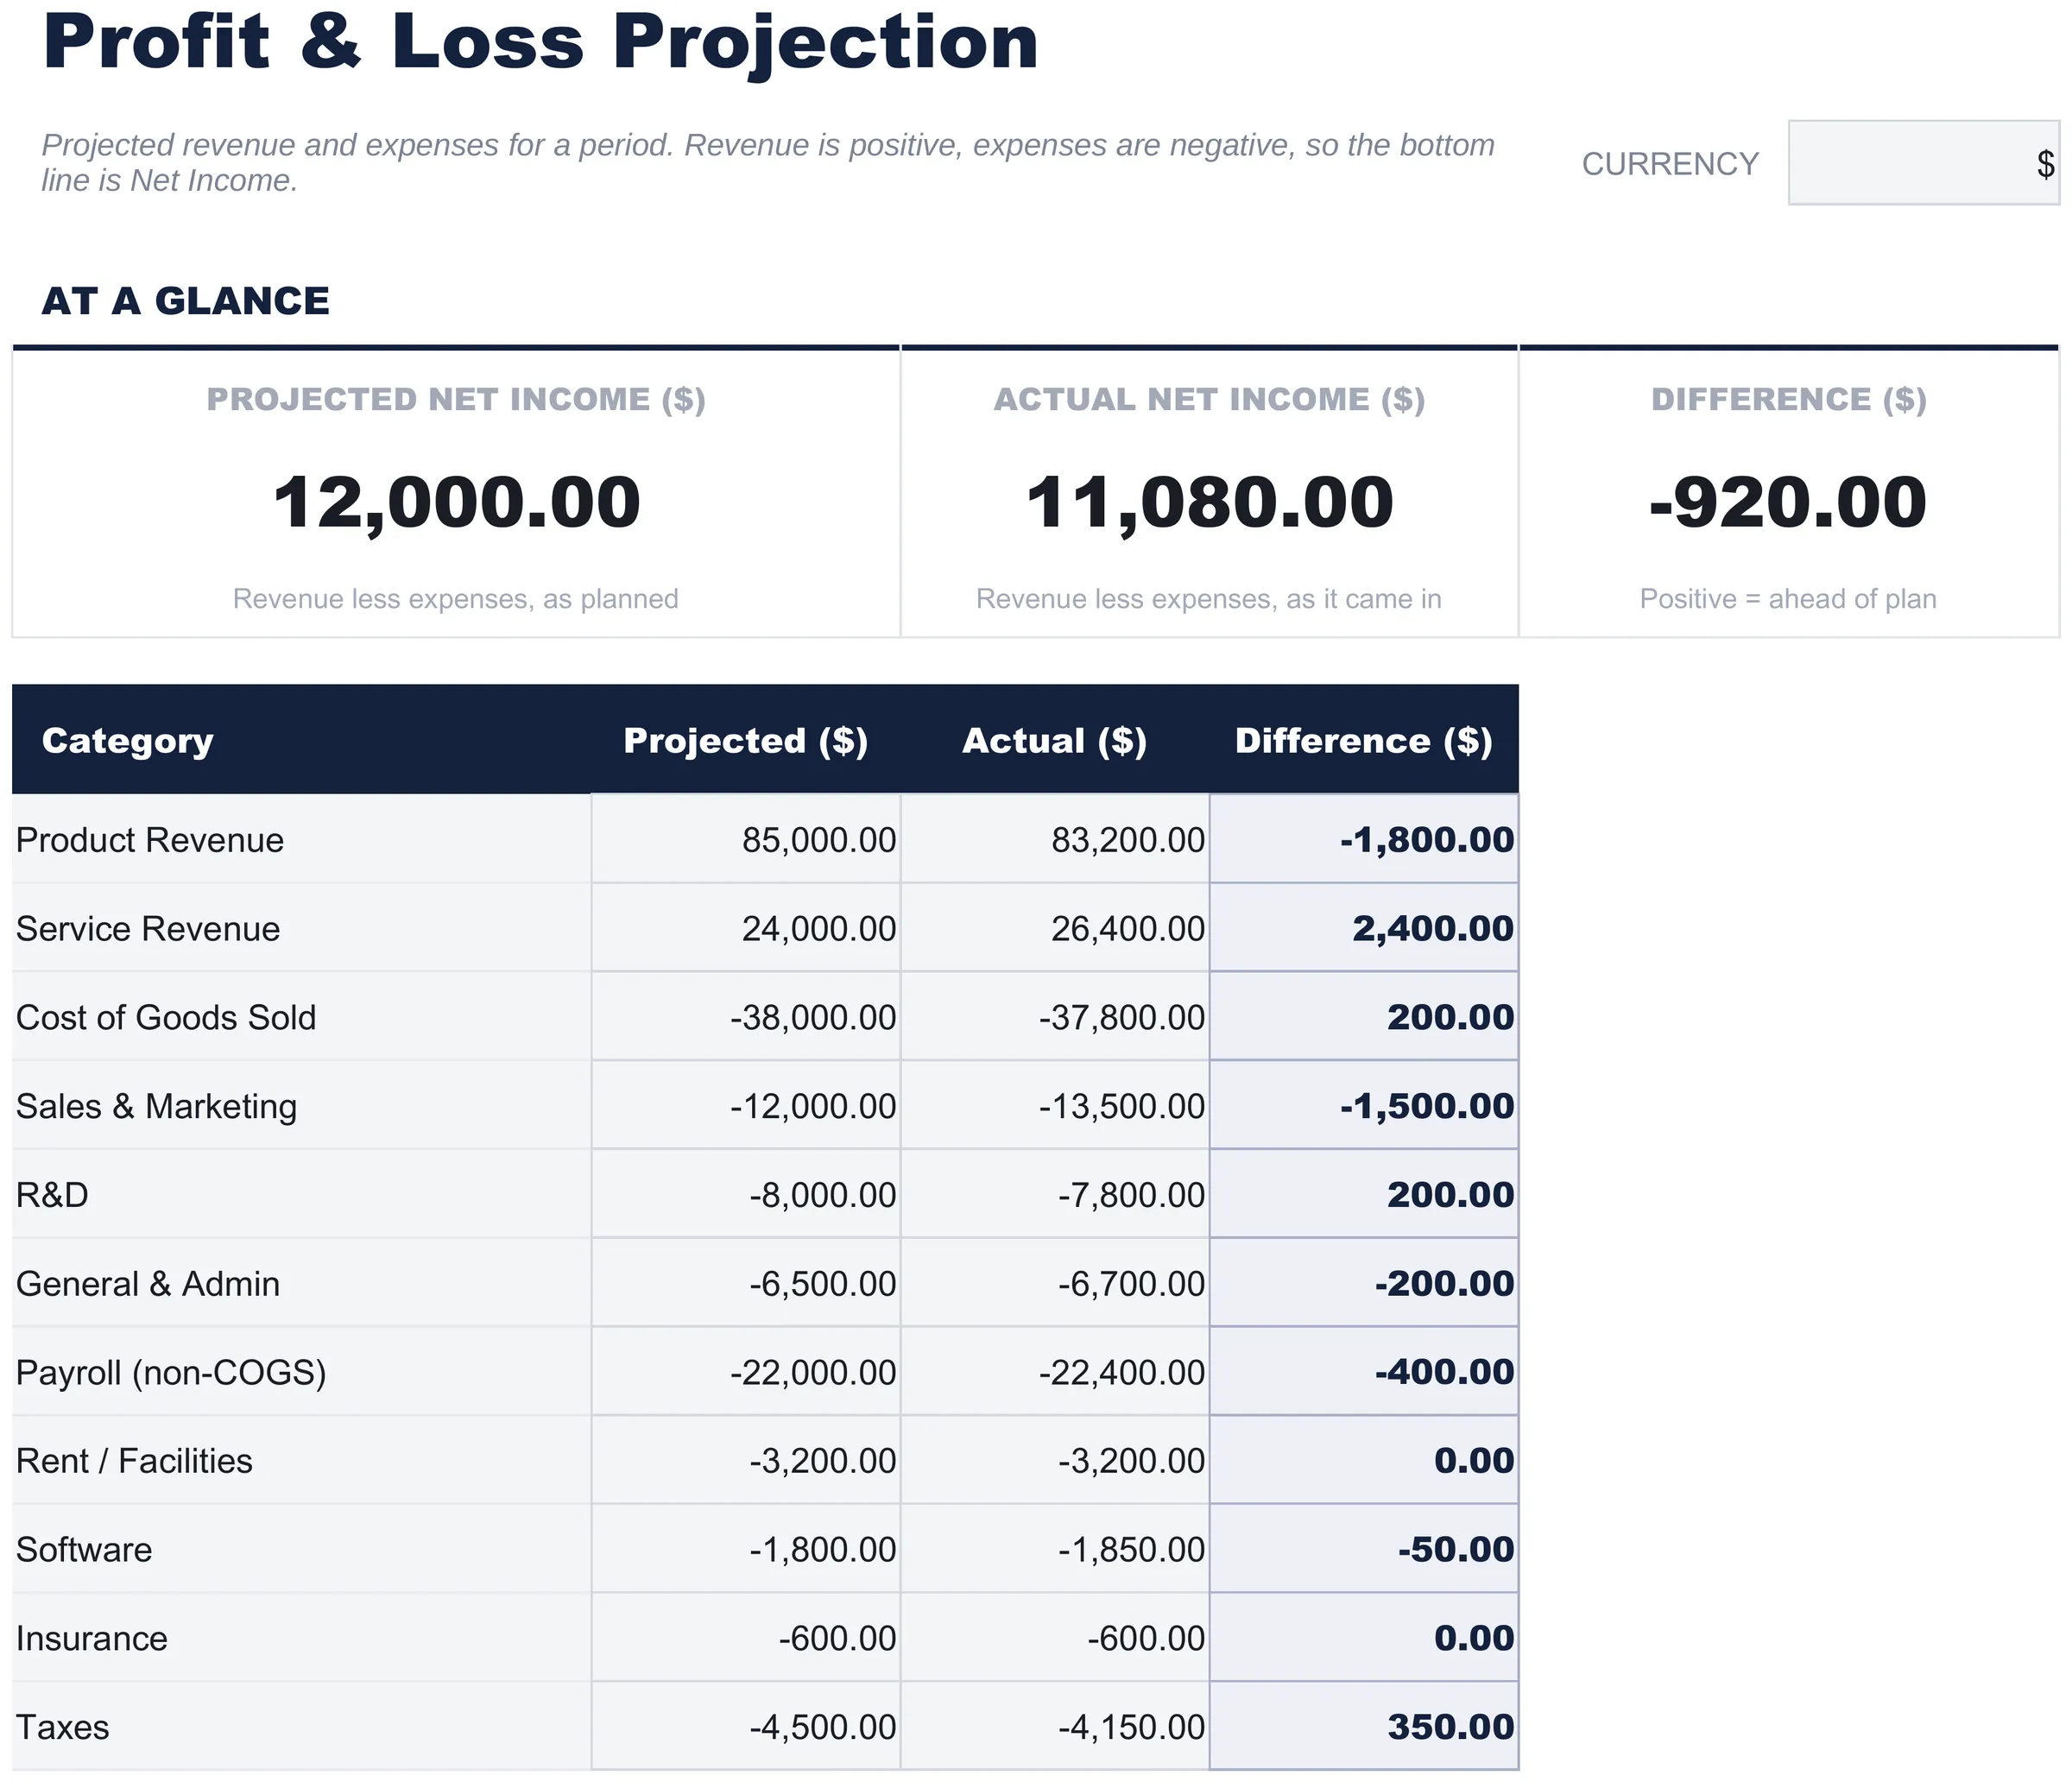
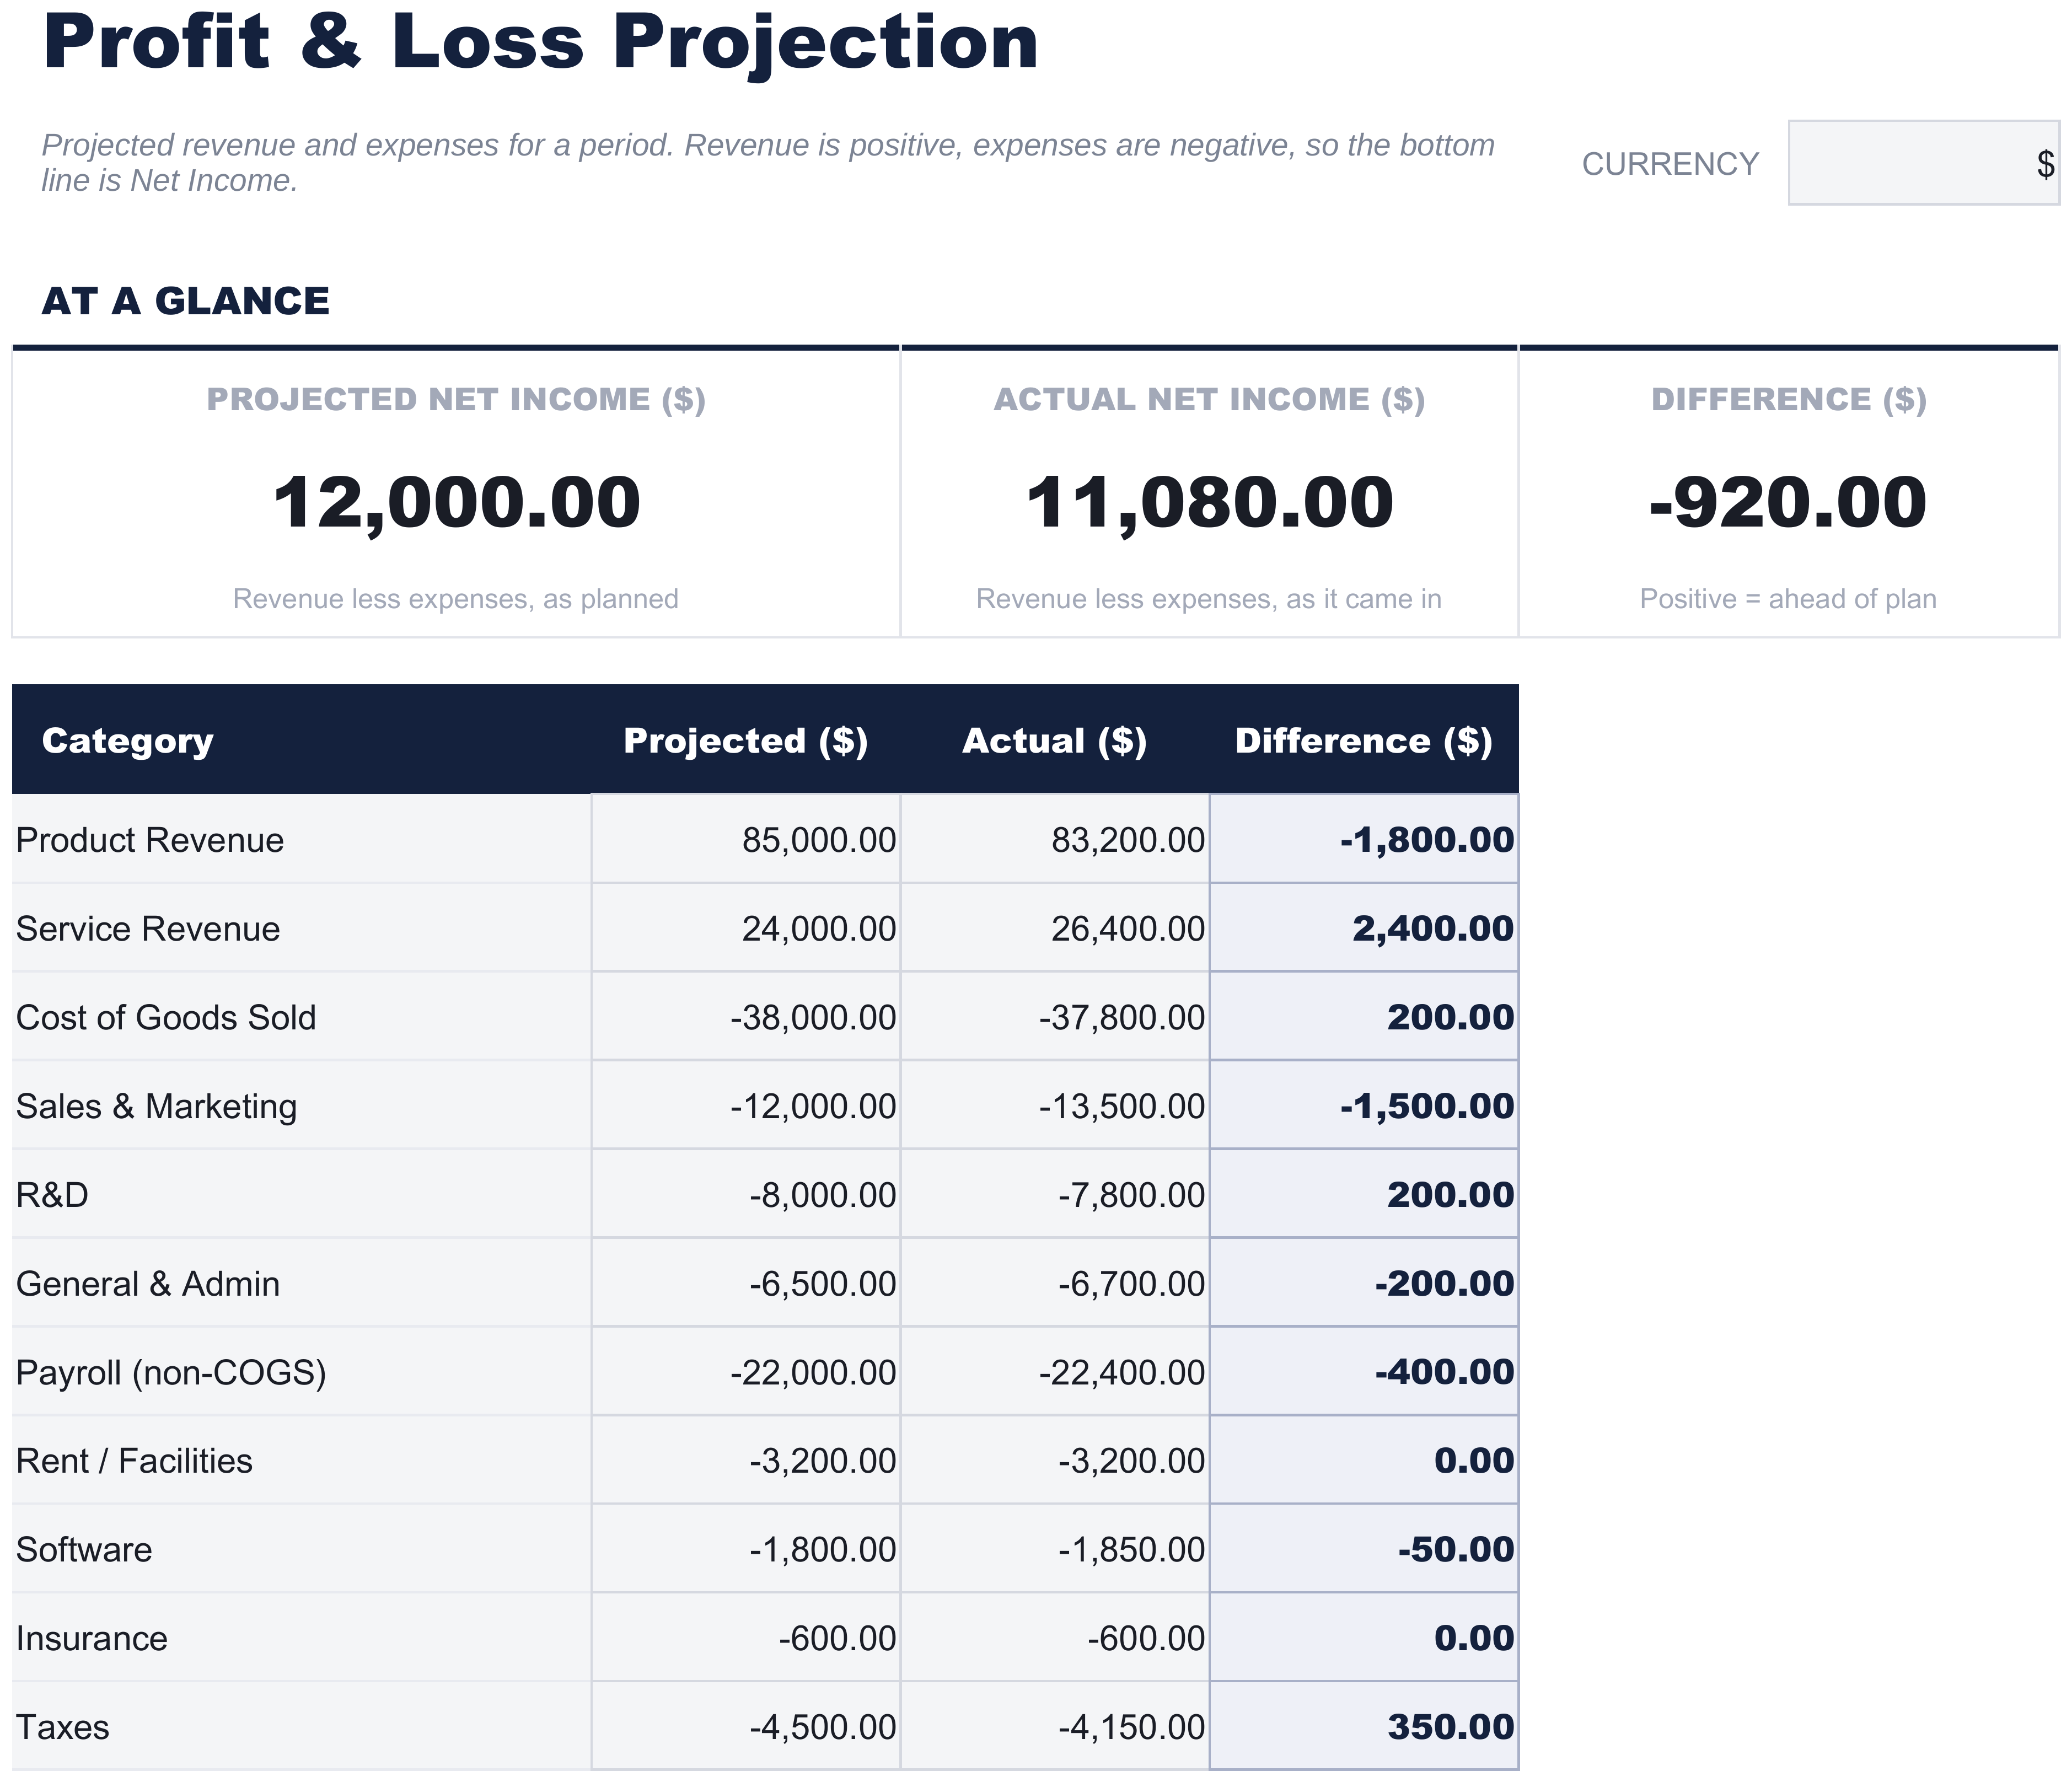
A line per category, each with what you projected and what actually happened, and the gap between them worked out. Revenue goes in positive and costs go in negative, which is the convention that makes the bottom row resolve to net income rather than to a total of unrelated numbers.
That bottom row is the point of the sheet. It says what the period was expected to leave and what it did leave, side by side, and the strip at the top repeats both as headline figures. A projection that only states revenue tells you how busy you were going to be; one that lands on net income tells you whether the busyness was worth doing.
The Difference column reads the same way in both directions. Revenue that came in above plan shows positive; costs that came in under plan also show positive, because a smaller negative is an improvement. That sounds obvious and is the thing most spreadsheets in this shape get backwards.
The sample lines cover the ordinary shape of a small business - two revenue lines, cost of goods sold, then the operating costs - but they are labels, and yours will differ. What matters is the sign, not the wording.
P&L
Included guide
How to Use
A step-by-step guide on its own tab, covering the sign convention, how to replace the sample values, and how to change the currency. Because it ships inside the file, the instructions travel with the template wherever it is opened.
Works in both Google Sheets and Excel
Free Profit & Loss Projection Spreadsheet template for Google Sheets
Upload the Free Profit & Loss Projection Spreadsheet Template to Drive, right-click it, and choose "Open with Google Sheets". This Free P&L Projection Google Sheets template needs no conversion step and the totals recalculate exactly as they do in Excel.
Free Profit & Loss Projection Google Sheets template setup
A shared copy of the Free Profit & Loss Projection Google Sheets template suits two people working from one set of numbers, since the projected column stays put while the actual column fills in.
Running the Free Profit & Loss Projection Google Sheet
The Free P&L Projection Google Sheet is filled in once at the start of a period and revisited as figures land. Nothing in it depends on how often you update it - the totals read whatever is in the cells.
Free Profit & Loss Projection Spreadsheet template for Excel
The Free Profit & Loss Projection spreadsheet Excel download is a plain .xlsx. Excel opens this Free P&L Projection Excel template directly, with no import step and no compatibility prompt. There are no macros and no VBA in the file, so it opens without a security warning.
Free Profit & Loss Projection Excel template setup
The same Free P&L Projection Excel template opens in Excel on Windows, Excel on Mac, and Excel for the web. It is also the identical file you would upload to Drive, so there is no separate Free Profit & Loss Projection spreadsheet download to choose between.
Free Profit & Loss Projection spreadsheet Excel notes
The Free Profit & Loss Projection spreadsheet Excel file carries no macros and no VBA, so Excel opens it without a trust prompt.
Opening the Free Profit & Loss Projection spreadsheet Excel file
Nothing in the Free P&L Projection Excel template is version-specific, so this Free Profit & Loss Projection spreadsheet Excel workbook behaves identically in Excel on Windows, Excel on Mac, and older builds.
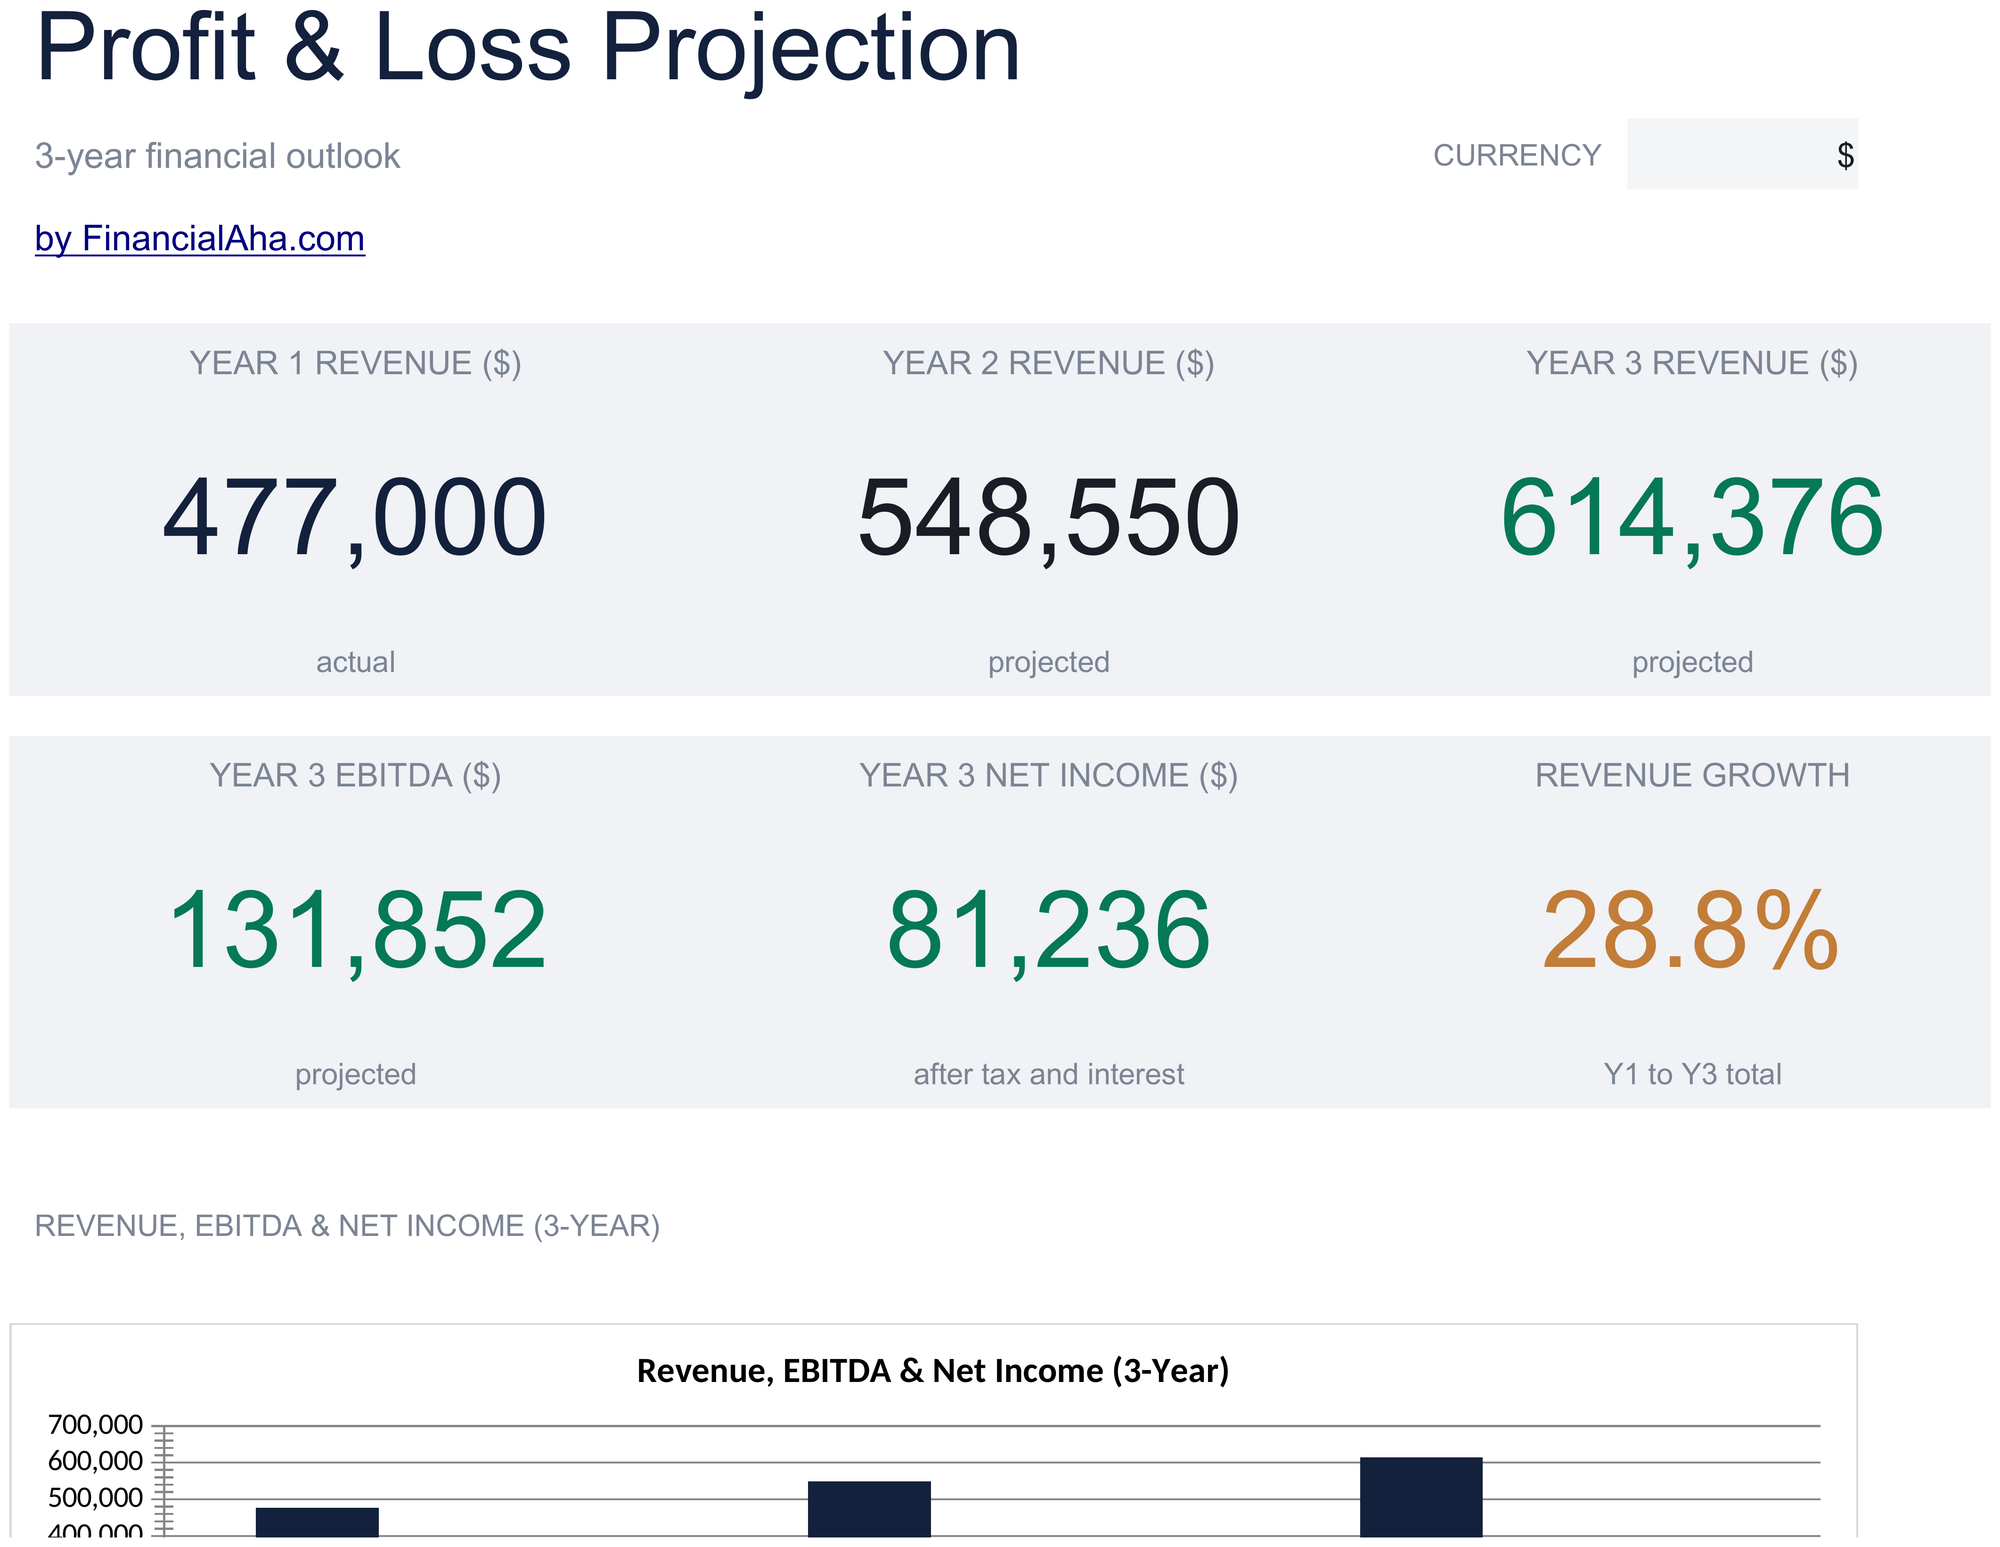
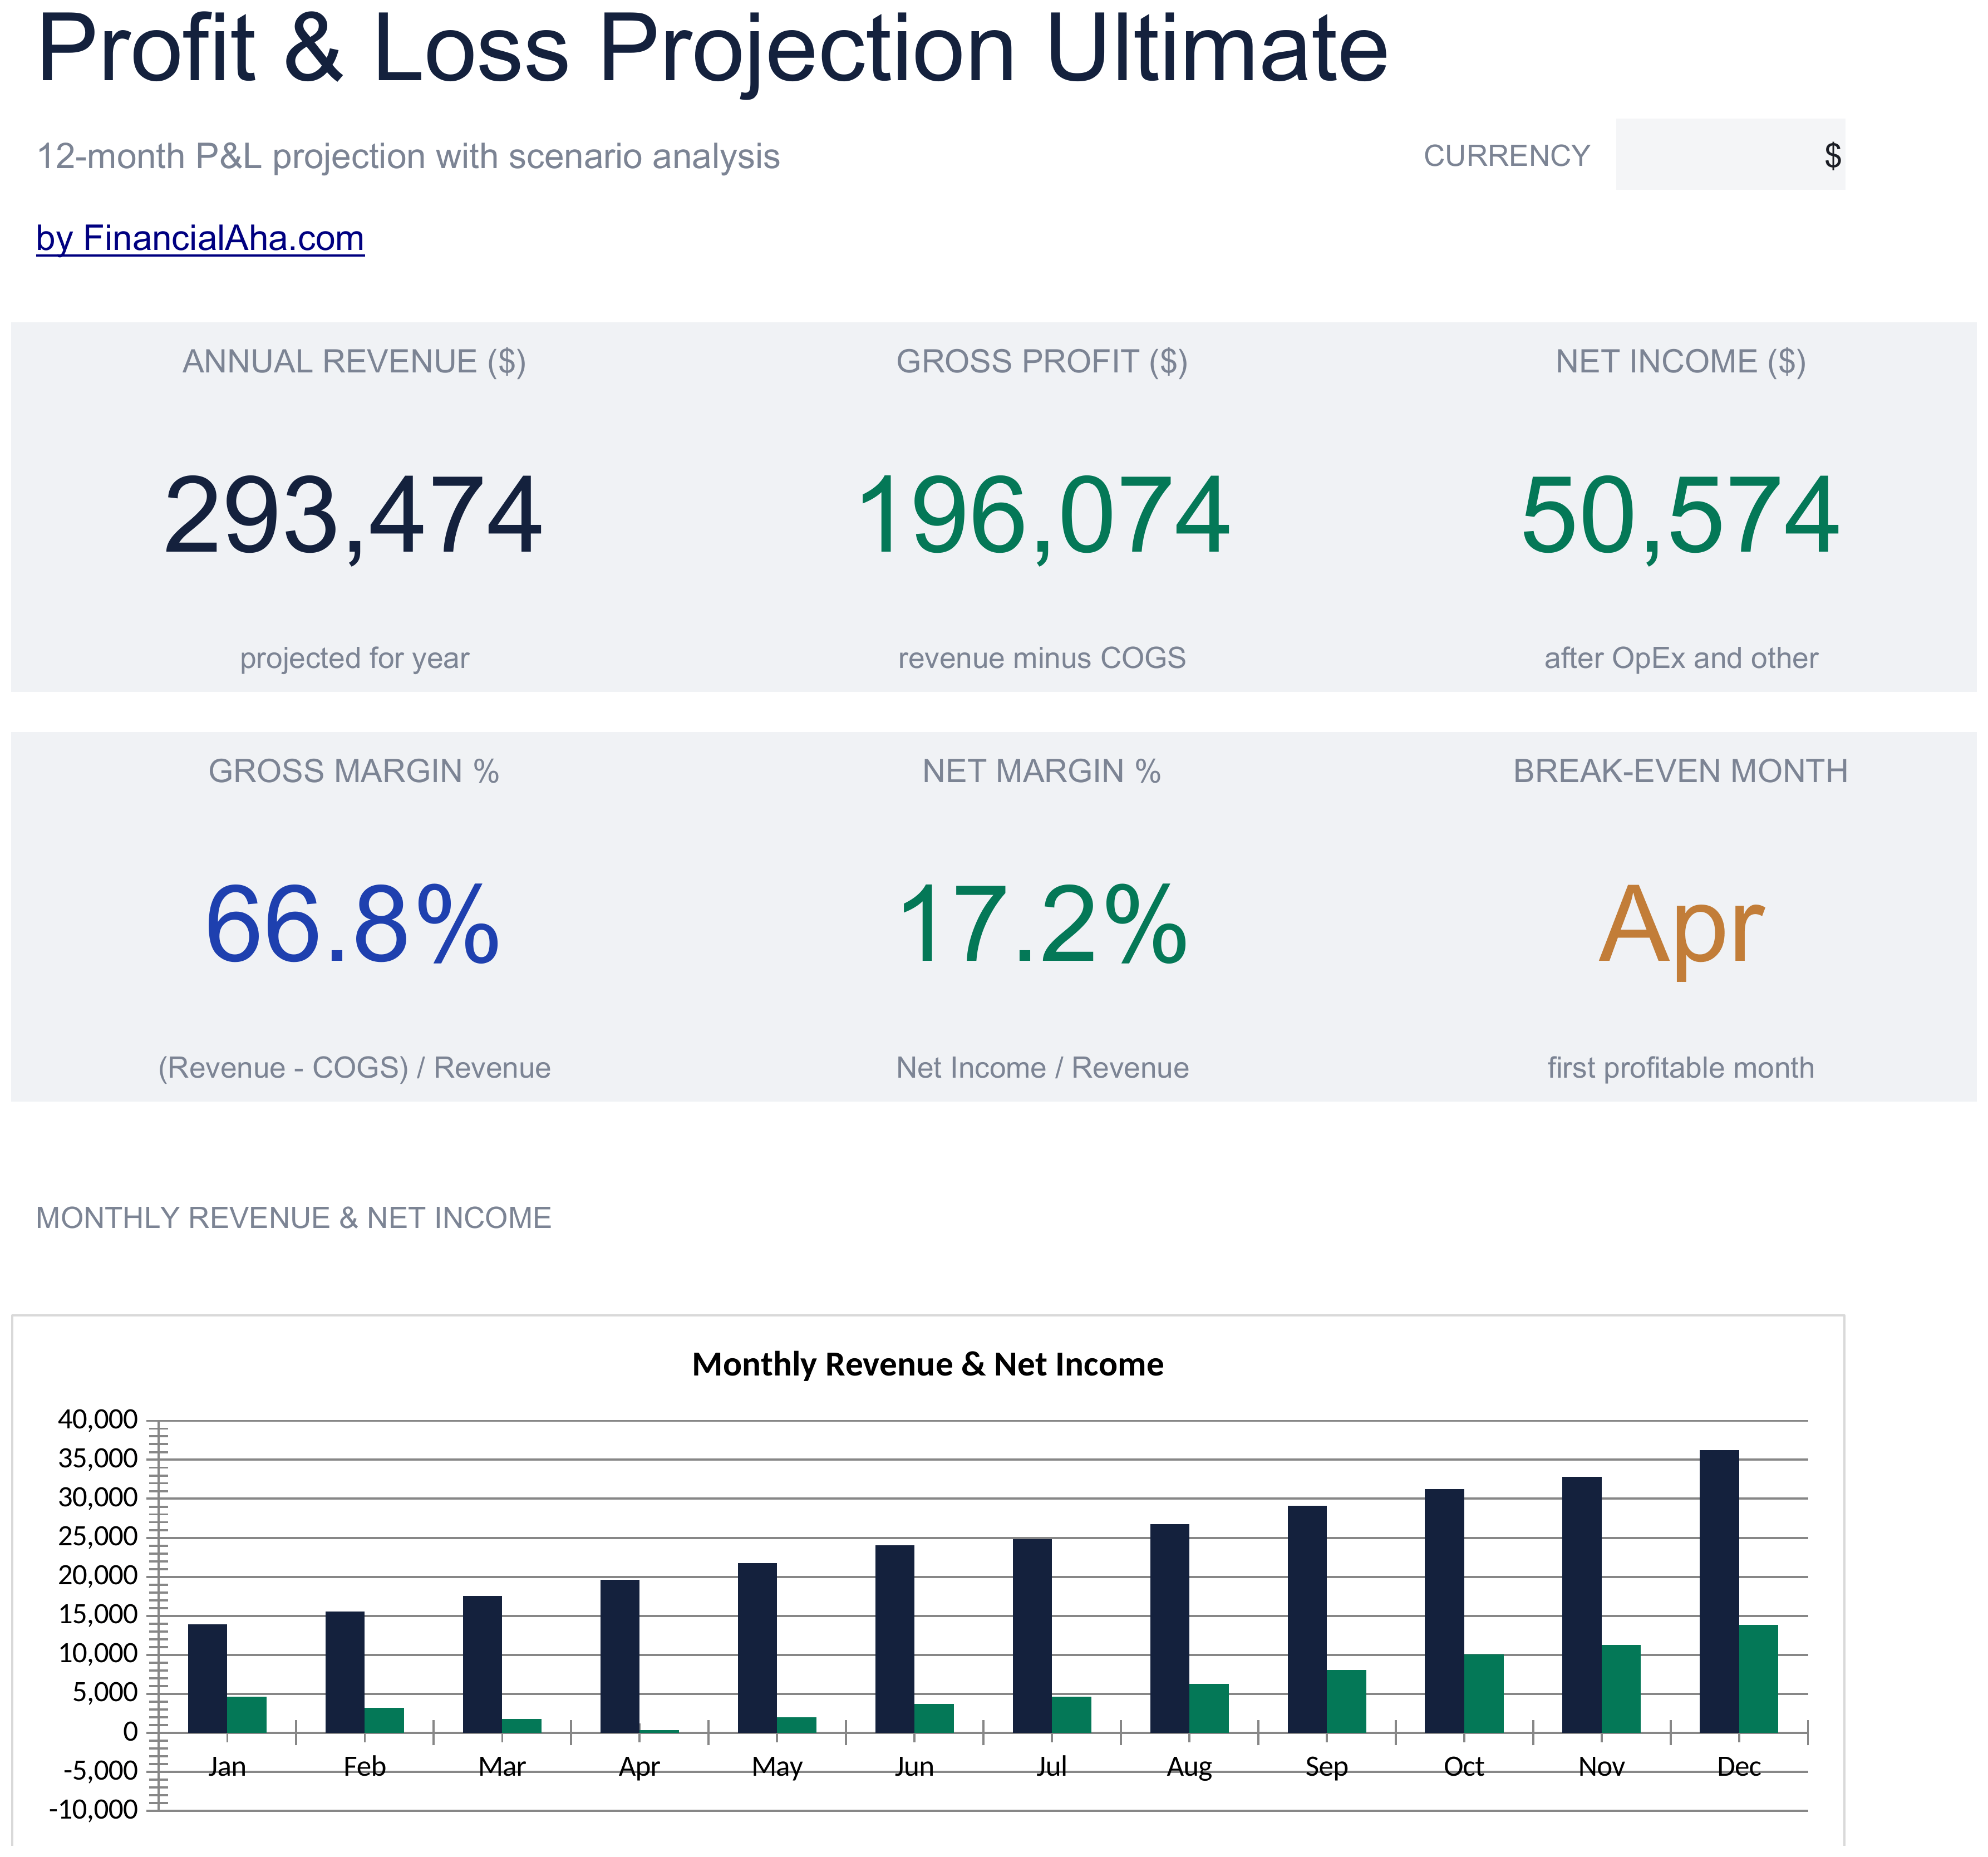
The FinancialAha Free Profit & Loss Projection Spreadsheet Template covers one period on one page, projected against actual, ending on net income. The Essentials Profit & Loss Projection Spreadsheet Template projects three years from growth assumptions you set, separating revenue, cost of goods sold and operating expenses, and works through gross profit, EBITDA, interest, tax and net income with margins at each step. The Ultimate Profit & Loss Projection Spreadsheet Template models twelve months across six sheets, with ten revenue streams, its own COGS and operating expense sheets, a monthly consolidated statement, and a scenario sheet driven by revenue multipliers you set.
Notes on working in the Free Profit & Loss Projection spreadsheet template
Revenue goes in positive and costs negative, which is what makes the row at the foot net income rather than a total.
The Difference column is actual less projected, so a positive number is ahead of plan for revenue and costs alike.
The three headline cards restate that foot row - what was projected, what came in, and the gap.
Three-year projections with growth assumptions start at the Essentials build; monthly modelling and scenarios at Ultimate.
The dropdown beside the title relabels the money columns. It changes the label and nothing else.
How the Profit & Loss Projection template works
The Free Profit & Loss Projection Spreadsheet Template puts one period on one page. Revenue and costs share the same lines, each with what you projected and what actually happened, and the gap between them worked out. Revenue goes in positive and costs negative, which is the convention that makes the bottom row resolve to net income rather than to a total of unrelated numbers - and the strip at the top restates that figure both ways.
When this template helps
01
You need a one-page view of whether a period is expected to leave anything.
02
You want the projection and the outcome in the same document rather than two.
03
You are pricing a project and want the arithmetic written down before committing.
04
You prefer a spreadsheet you control over accounting software you rent.
Tips to get the most out of it
A projection is a set of assumptions written down, and the Difference column is where you find out which of them held.
Filling the projected column before the period and the actual column after it is what makes the comparison worth having.
Revenue and costs share one table, so the foot row is net income directly rather than something to work out from two subtotals.
Common mistakes to avoid
Entering costs as positive numbers. The bottom row then adds them to revenue and the whole sheet reads backwards.
Filling in the projected column after the fact. A projection written once the answer is known is a record, not a projection.
Leaving the actual column empty. The Difference column is the only part of the sheet that tells you anything you did not already believe.
Reading the Difference column as good or bad without looking at which line it sits on.
How to Use the Free Profit & Loss Projection Spreadsheet Template
1
Name the lines
Your own revenue and cost categories, sixteen of them.
2
Project the period
Revenue as positive, costs as negative.
3
Fill in actuals
As the figures land. The Difference column follows.
Every template starts with deep research into how people actually track the topic. We design the layout, build the formulas, and polish the design until it feels like something we would use ourselves. Along the way, we use AI to stress-test the calculations: unusual inputs, edge cases, and formula behavior, checked until the numbers hold.
Excel
Sheets
Privacy by default
Your numbers stay in your own file
Formula-driven
All calculations update automatically
Dual compatible
Works in Excel and Google Sheets
Sample data included
See the template in action right away
Frequently Asked Questions
What is the difference between the free, Essentials, and Ultimate Free Profit & Loss Projection spreadsheet template?
Free is a single-sheet starter template with sample data and a How to Use guide. Essentials ($19) is the fuller build, with more worked out for you rather than typed. Ultimate ($29) goes further again, splitting the template across more working sheets and adding deeper reporting on top. What each tier holds differs by template - the comparison table on every template page lists it exactly.
Which Free Profit & Loss Projection spreadsheet template should I download?
Essentials is the fuller build of this template for ongoing use, and the comparison table on this page lists exactly what it adds. The Free version is a good fit for one-off planning or trying out the layout.
Can I upgrade the Free Profit & Loss Projection spreadsheet template later?
Yes. Essentials is a one-time $19 purchase with no subscription. What it adds depends on the template: some builds gain capacity and a dashboard, others richer detail in the same layout. The comparison table on this page lists the differences exactly.
Is the FinancialAha Free Profit & Loss Projection Spreadsheet Template a Google Sheets template?
Yes. Upload the file to Drive and choose "Open with Google Sheets". Nothing needs rewriting in the Free P&L Projection Google Sheets template, and the totals recalculate exactly as they do in Excel.
Is the FinancialAha Free Profit & Loss Projection Spreadsheet Template an Excel template?
Yes. The download is a plain .xlsx, so the Free Profit & Loss Projection Excel template opens directly in Excel with no import step. There are no macros and no VBA in the file.
Will the FinancialAha Free Profit & Loss Projection spreadsheet Excel file open in older versions of Excel?
Yes. The Free P&L Projection spreadsheet Excel workbook ships as a plain .xlsx, so it opens identically in current Excel and in builds that predate dynamic arrays.
Why do costs go in as negative numbers in the Free Profit & Loss Projection spreadsheet?
Because that is what makes the bottom row net income rather than a total of unrelated figures. Revenue adds, costs subtract, and the row at the foot resolves to what the period left.
Which way round is the Difference column in the Free Profit & Loss Projection spreadsheet?
Actual less projected. Revenue above plan shows positive; costs under plan also show positive, because a smaller negative is an improvement. It reads the same way for both kinds of line.
How many lines does the Free Profit & Loss Projection hold?
Sixteen, shared between revenue and costs. The Essentials build separates revenue, cost of goods sold and operating expenses into blocks of their own across three years.
Does the Free Profit & Loss Projection spreadsheet project more than one period?
No. This build covers one period, projected against actual. Three-year projections driven by growth rates are on the Essentials build; twelve-month modelling with scenarios is on Ultimate.
Does the FinancialAha Free Profit & Loss Projection spreadsheet work out gross margin?
No. It lands on net income without the intermediate steps. Gross profit, gross margin, EBITDA and a tax line are on the Essentials build.
How do I open the Free Profit & Loss Projection spreadsheet template in Google Sheets?
Upload the .xlsx file to Google Drive, then open it with Google Sheets. All formulas and formatting will be preserved.
Can I use the Free Profit & Loss Projection spreadsheet template for commercial work?
All free templates are released under CC BY 4.0 (Creative Commons Attribution). You can use, modify, and share them freely - including for commercial purposes - as long as you credit FinancialAha.com. They are provided as-is and do not constitute financial advice.