Profit and Loss Projection Essentials Template
Project revenue, costs, and profit over a specified period. Useful for business planning, forecasting, and evaluating financial scenarios.
What's Included
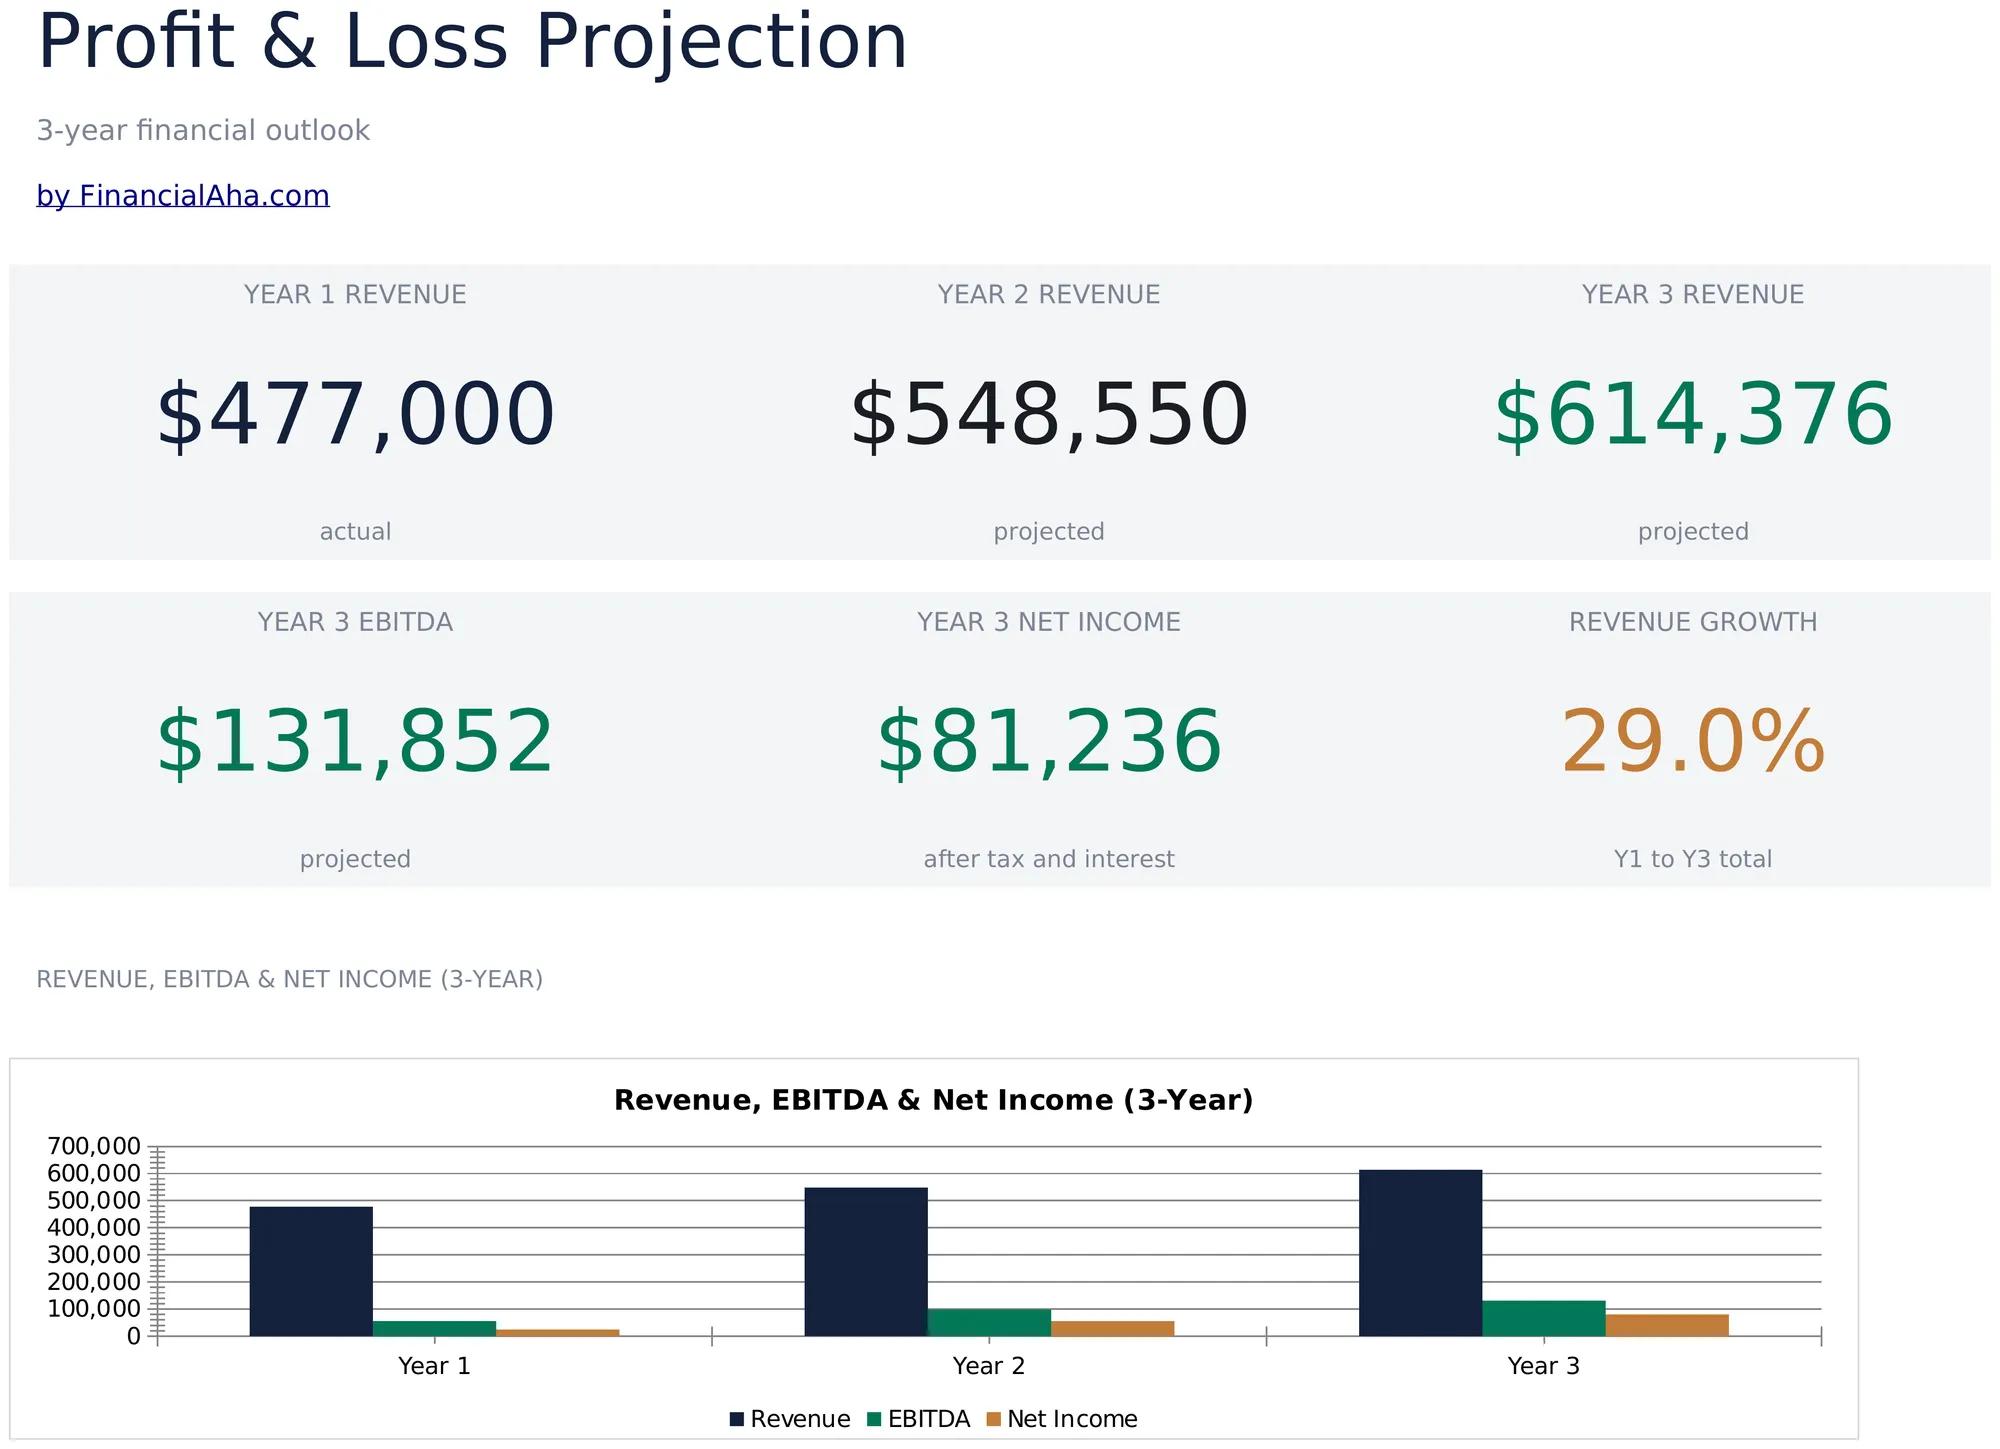
- Dashboard with P&L overview showing total revenue, cost of goods sold, gross profit, and net profit
- P&L statement with revenue lines, direct costs, operating expenses, and net income with automatic subtotals
- Gross profit and net profit calculations with automatic margin percentages displayed alongside dollar amounts
- Monthly or quarterly projection columns spanning up to 12 months with automatic annual totals at the end
- Margin percentage display with color-coded input cells (yellow) and formula-driven projections (blue)
- Works in Microsoft Excel, Google Sheets, and LibreOffice Calc with no setup required
Need more from this template?
The Essentials version covers everyday tracking. Ultimate goes further with multi-entity support, scenario analysis, and ultimate-grade reporting.
- Dashboard with P&L overview showing total revenue, cost of goods sold, gross profit, and net profit
- P&L statement with revenue lines, direct costs, operating expenses, and net income with automatic subtotals
- Gross profit and net profit calculations with automatic margin percentages displayed alongside dollar amounts
- Monthly or quarterly projection columns spanning up to 12 months with automatic annual totals at the end
- Revenue Forecast sheet with up to 10 product or service lines, monthly projections, and annual totals with growth rate tracking
- COGS sheet breaking down direct material, direct labor, and overhead costs per revenue line with gross margin calculations
- Operating Expenses sheet with 12 expense categories across 12 monthly columns and annual budget vs actual tracking
- Consolidated P&L statement pulling from all input sheets: revenue, COGS, gross profit, operating expenses, operating income, and net income
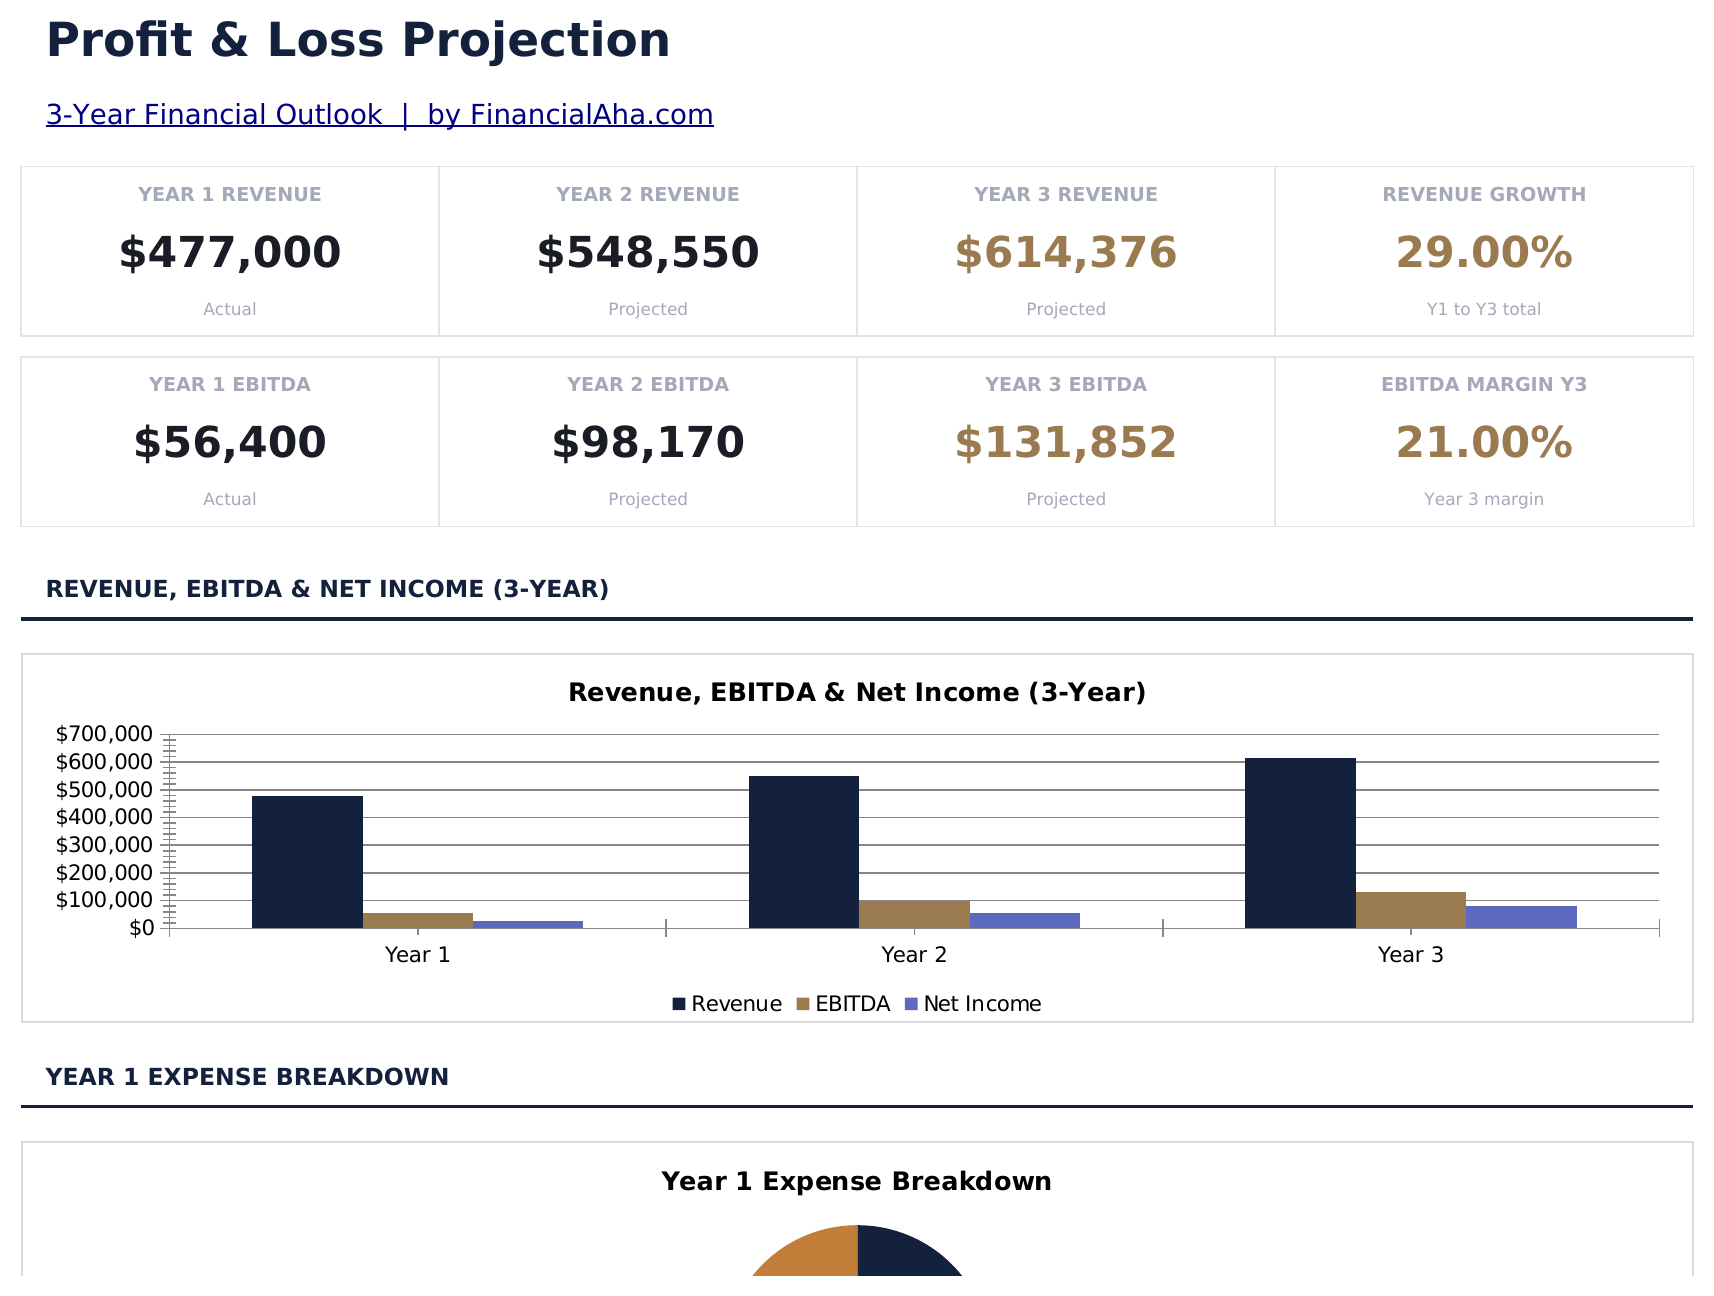
- Dashboard with 6 KPI cards: annual revenue, annual COGS, gross margin %, operating income, net income, and break-even month
Preview
See what's inside this template
How to Use This Profit and Loss Projection Template
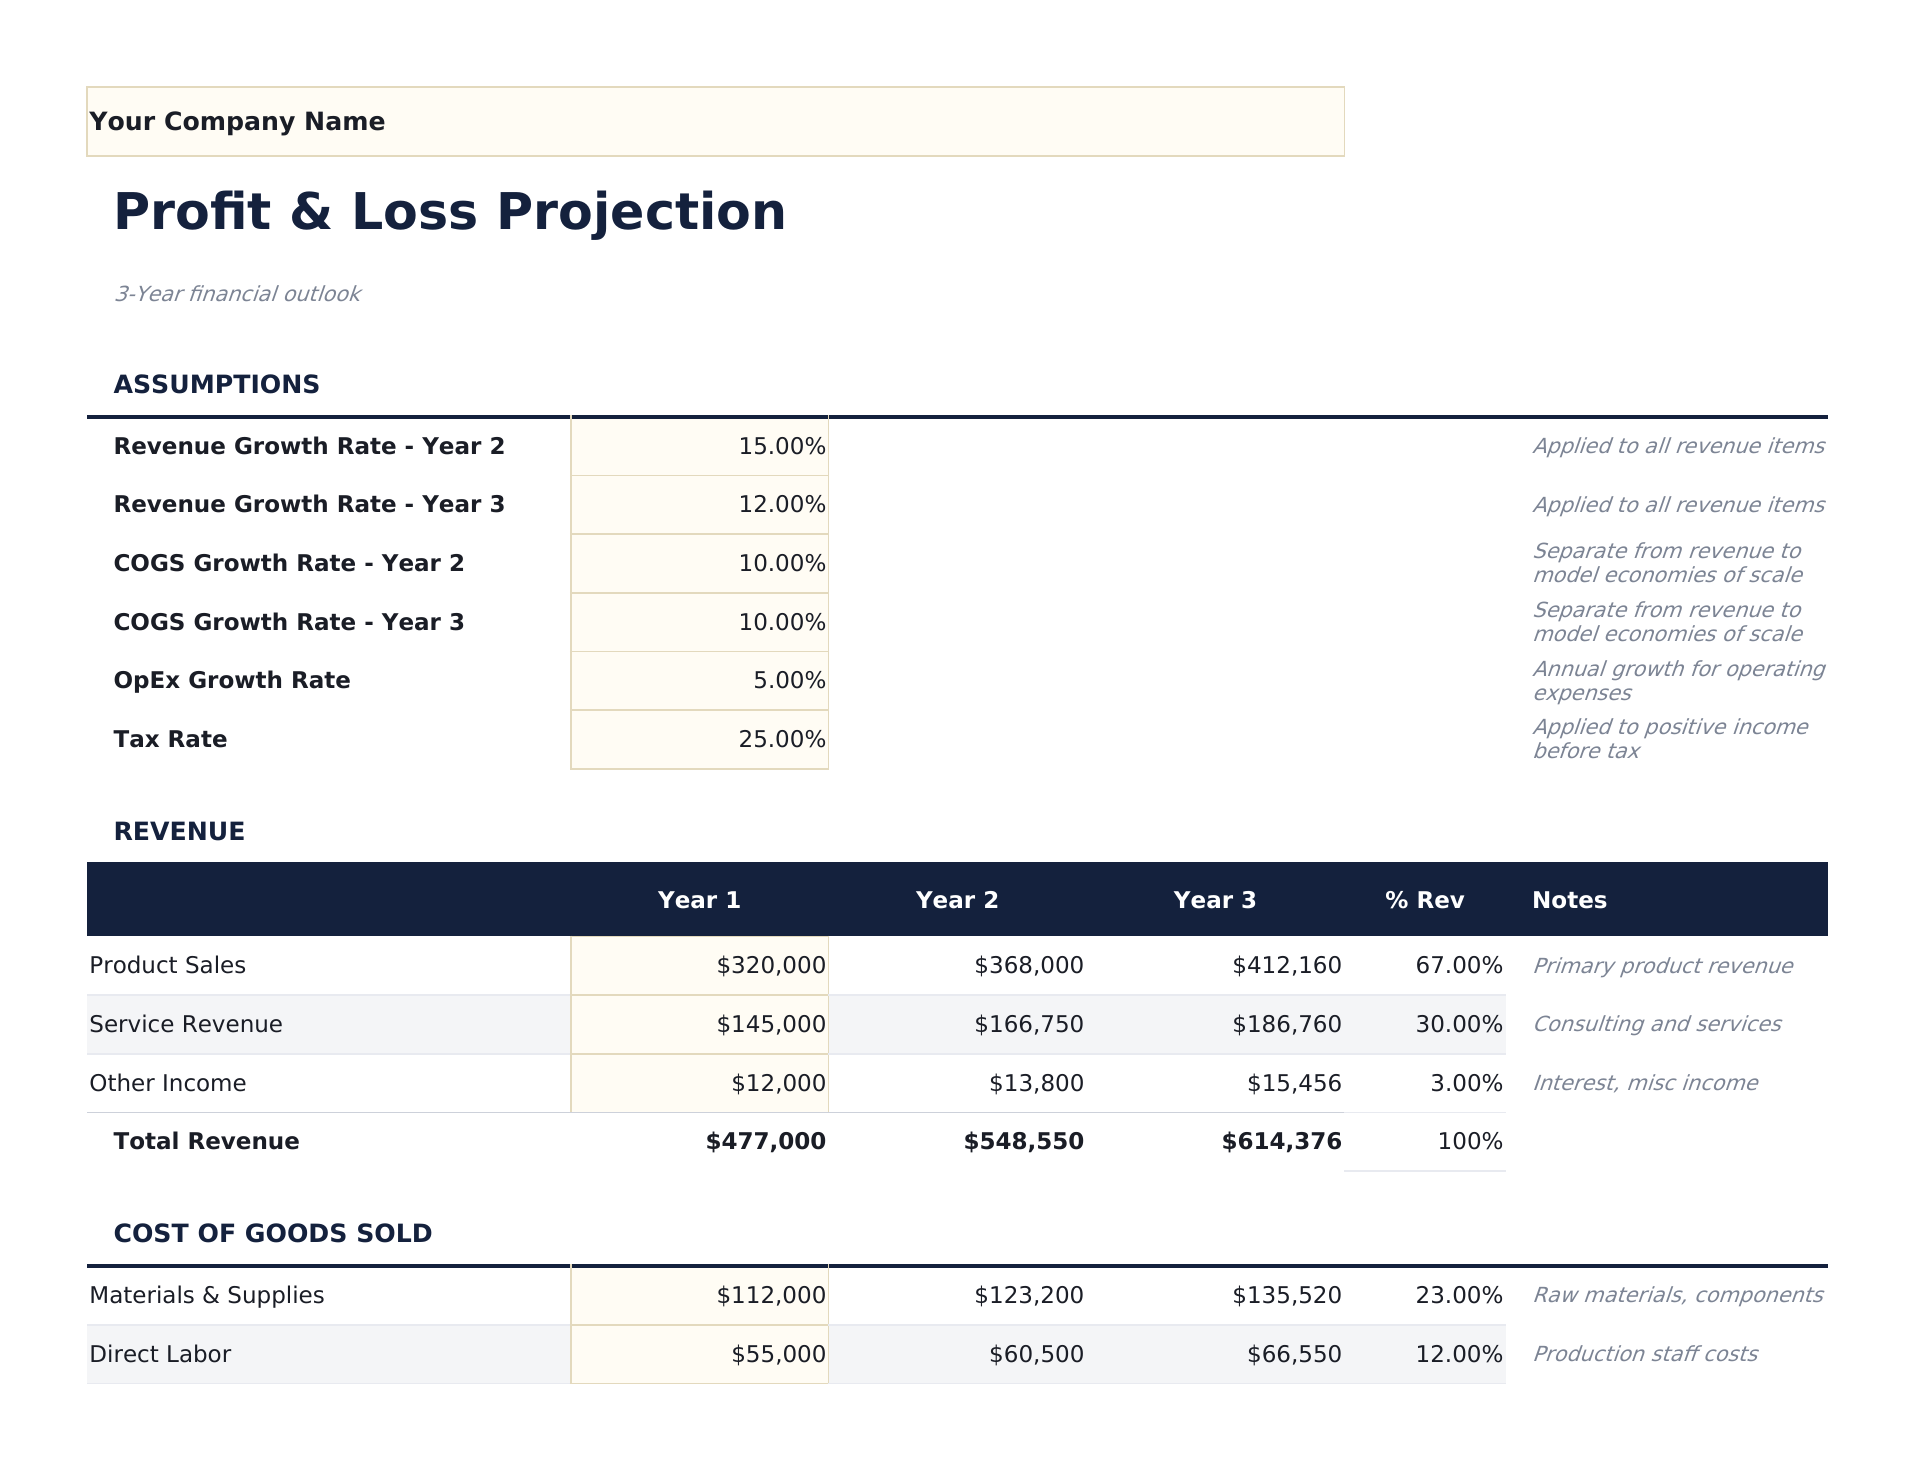
Enter revenue projections
List each revenue stream with projected monthly or quarterly amounts across the projection period.
Add cost of goods sold
Enter direct costs associated with delivering your product or service. Gross profit calculates automatically.
Fill in operating expenses
Add monthly estimates for payroll, rent, marketing, utilities, insurance, and other operating costs.
Review net profit
The dashboard shows projected revenue, gross margin, operating expenses, and net profit with margin percentages.
Customer Reviews
What Our Customers Say
"If I get half as good at handling my finances as you are at customer service, this'll be the best $26 I've spent lately."
"Great tool! Simplifies financial planning without the hassle of complex spreadsheets."
"I recently purchased your super convenient spreadsheet, it really helps me!"
"They're great and super intuitive. Thank you!"
Built by Claude AI. Perfected by us.
We use Claude AI to draft each template, after a deep research. Then our team steps in. We refine the layout, stress-test every formula, fix edge cases, and polish the design until it feels like something we would actually use ourselves. The AI gets us 80% there. The last 20% is all human judgment.
Frequently Asked Questions
How many months can I project?
The template supports up to 12 monthly columns with an annual total. Adjust the date headers for your projection period.
What is gross profit vs net profit?
Gross profit is revenue minus direct costs (COGS). Net profit subtracts all operating expenses from gross profit. Both are shown with margin percentages.
Can I use quarterly instead of monthly?
Yes. Change the column headers from months to quarters and enter quarterly figures. The annual total still sums all columns.
Is this good for startup planning?
Yes. P&L projections are a core part of business plans. Combine this with the Startup Costs template for a complete financial picture.
How do I open this in Google Sheets?
Upload the .xlsx file to Google Drive, then open it with Google Sheets. All formulas and formatting will be preserved.
More Essentials Business Finance Templates
Highlights:
Looking for premium spreadsheet templates?
Our paid templates include advanced multi-sheet dashboards, native Excel charts, and ongoing updates.
Get every Ultimate template instead
All 58 Ultimate templates in one purchase for $299 - $1,102 value, you keep $803.