Projeção de Lucros e Perdas Modelo Essentials
Projete receitas, custos e lucro ao longo de um período determinado. Útil para planejamento empresarial, previsões e avaliação de cenários financeiros.
O Que Está Incluído
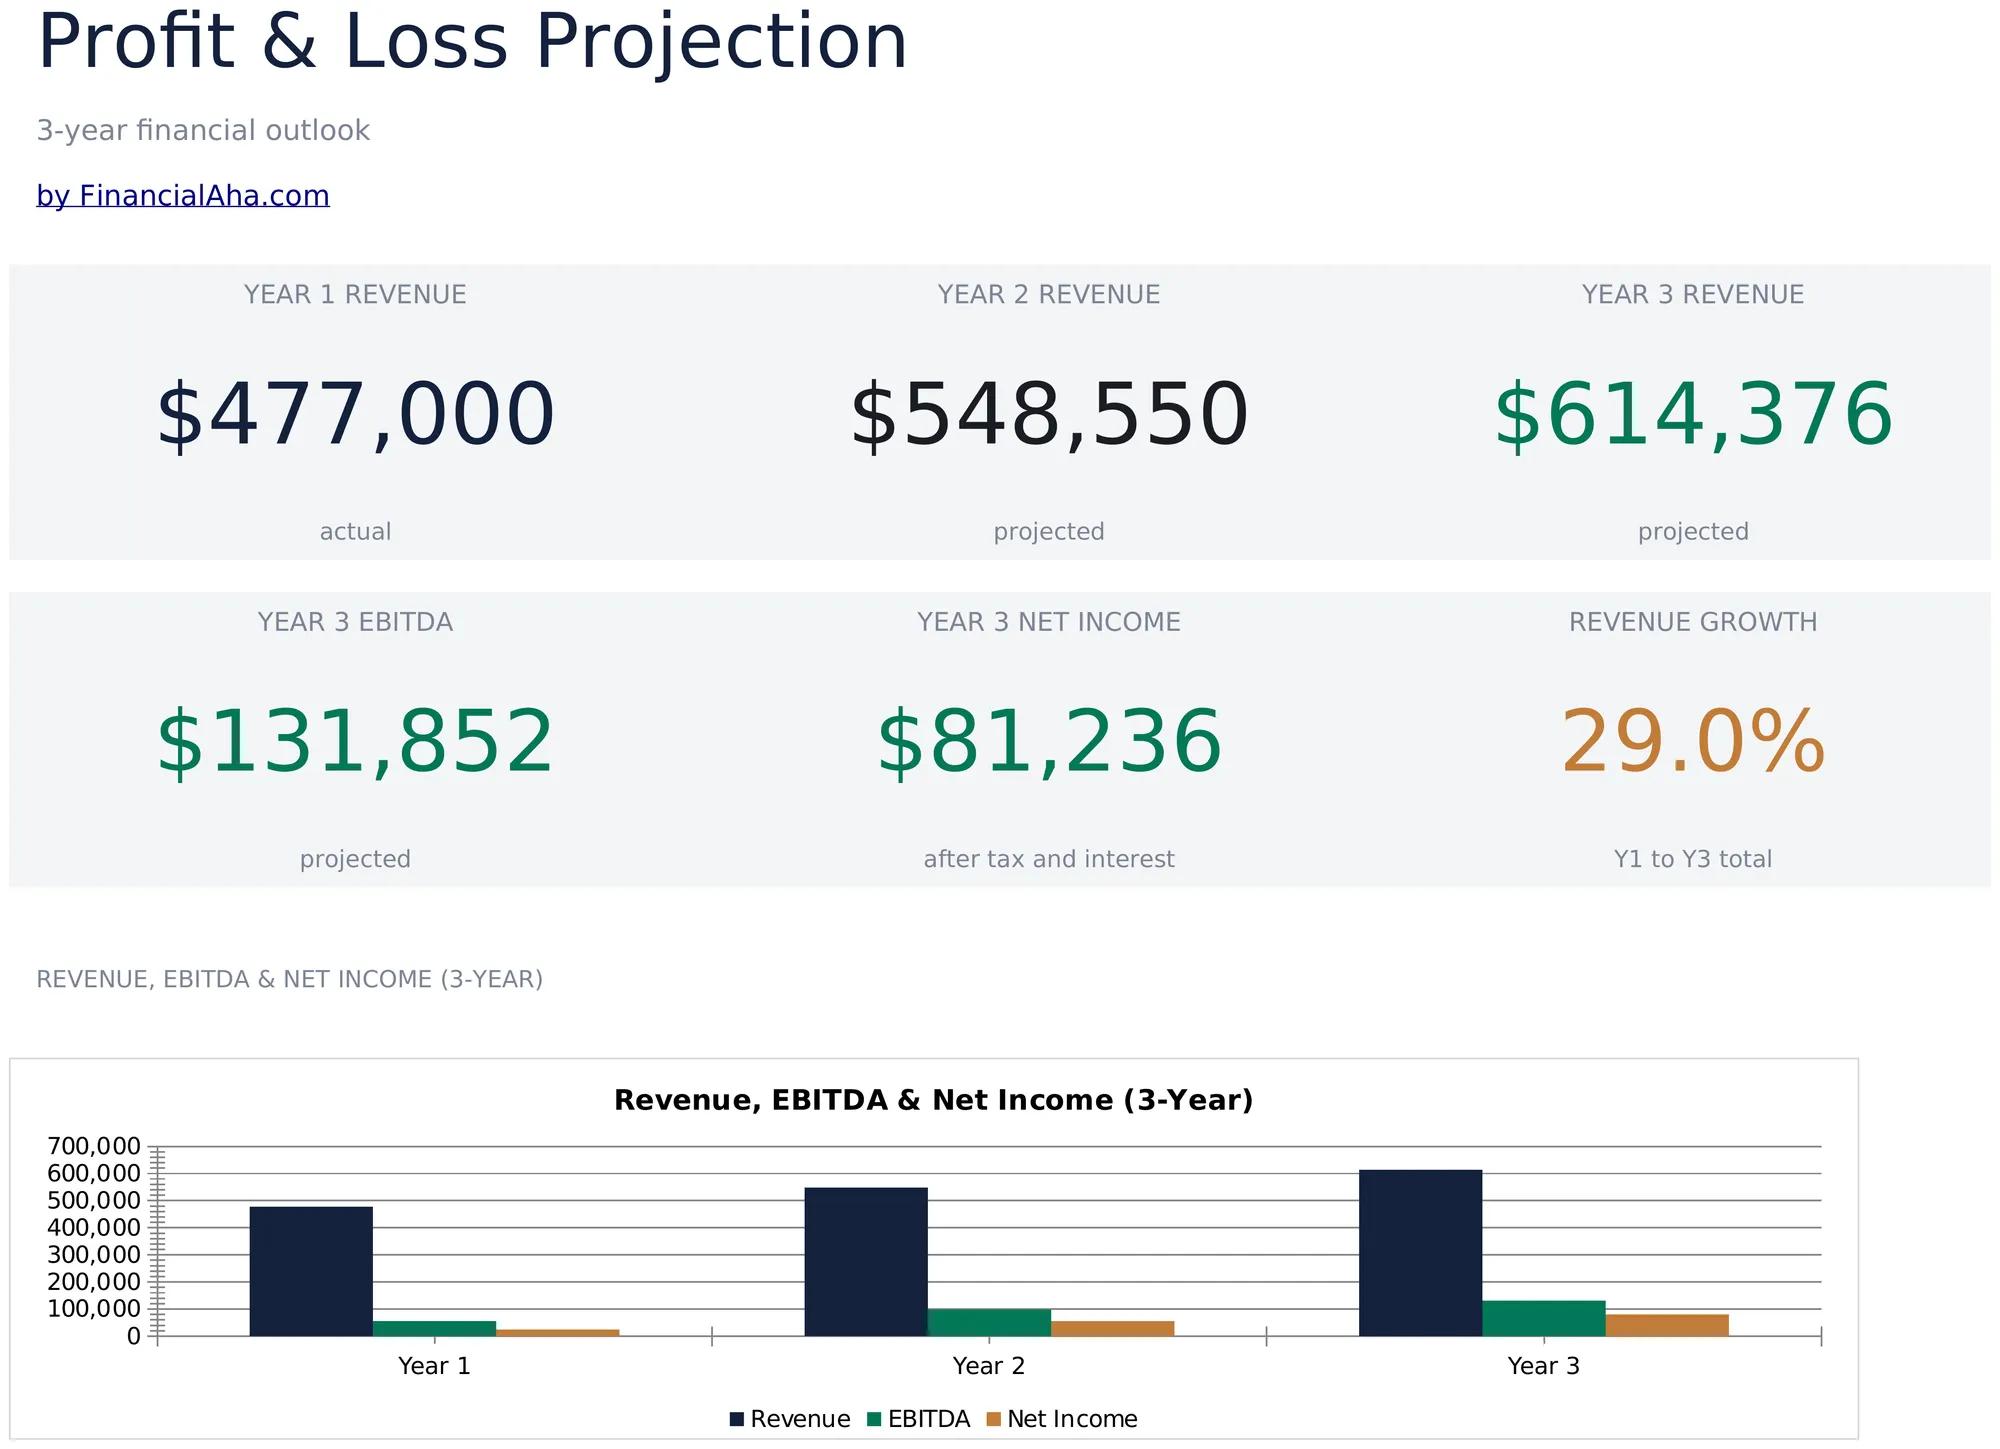
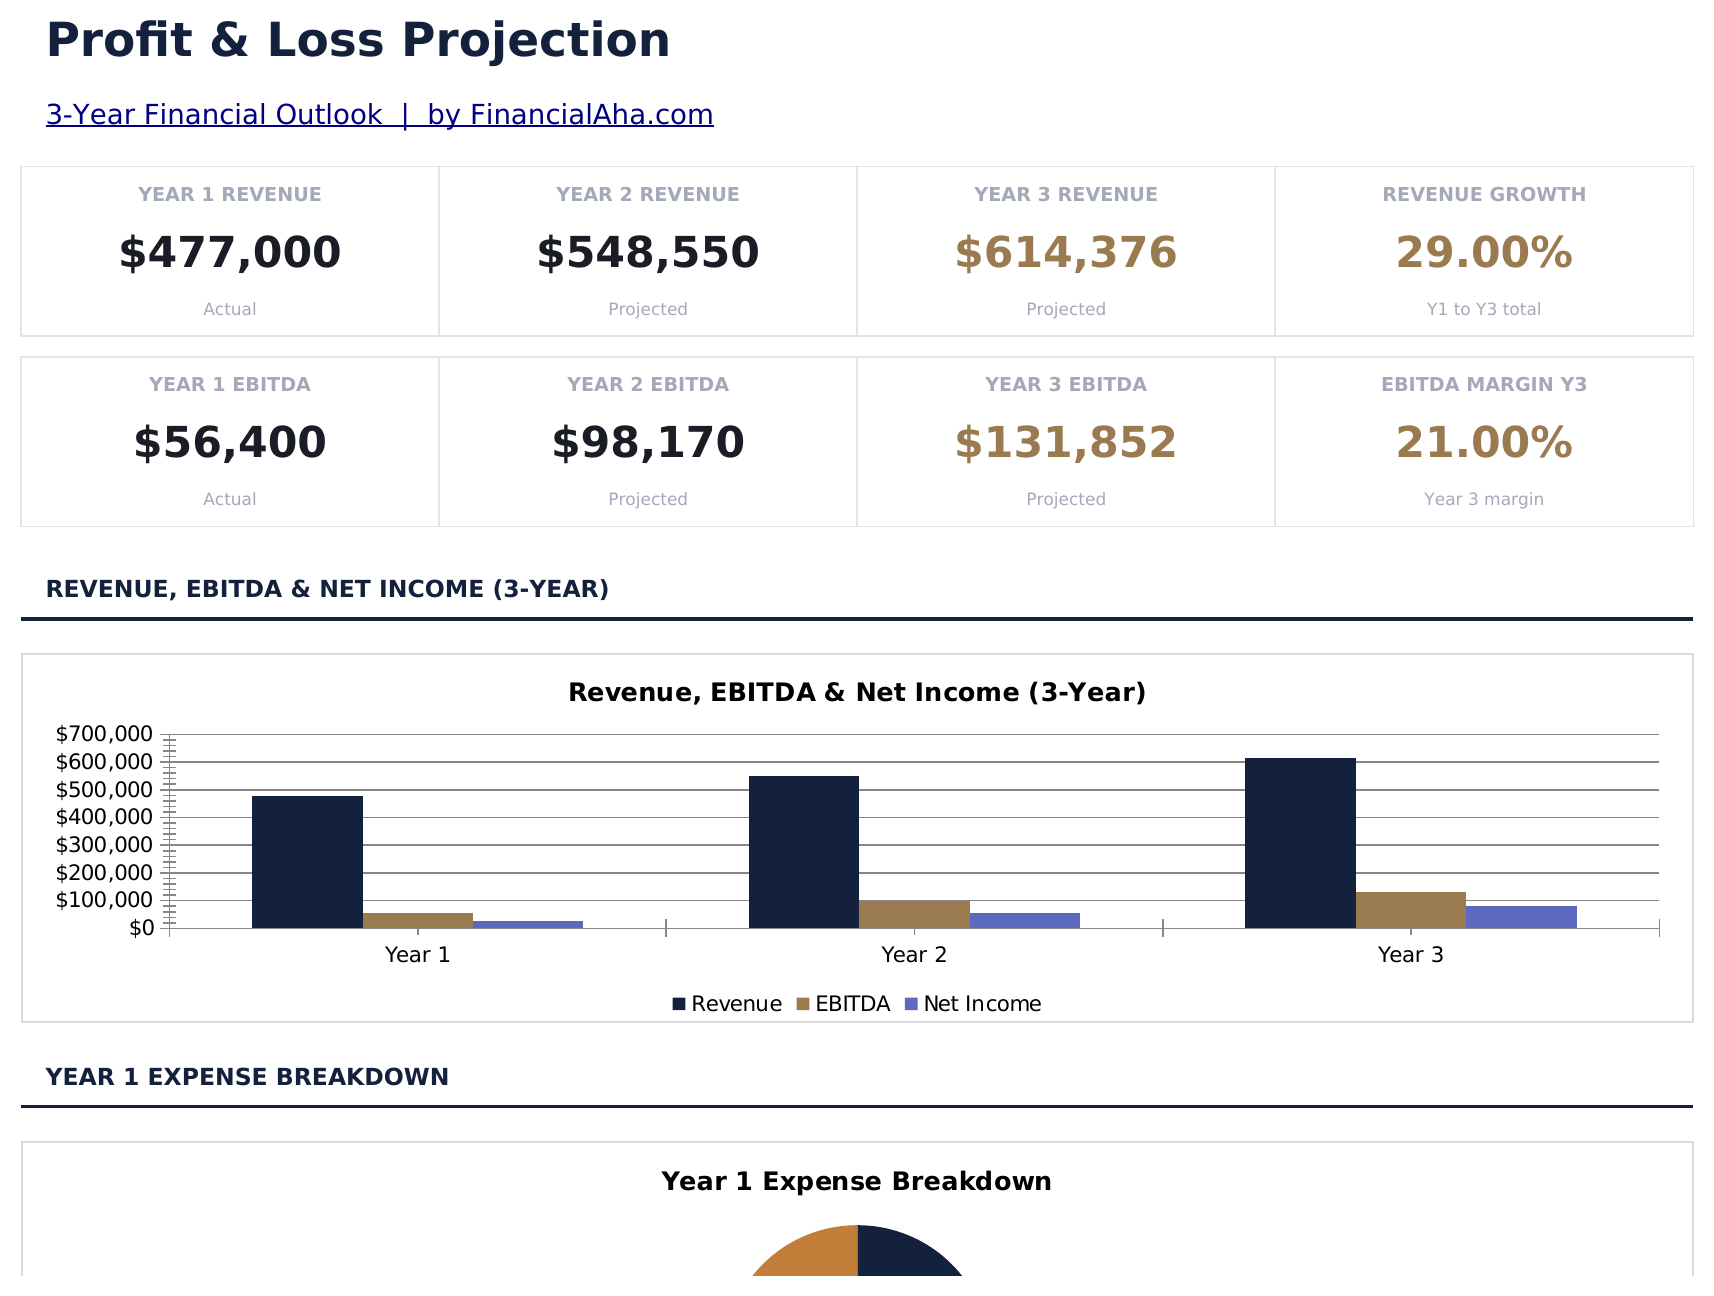
- Painel com visão geral de P&L mostrando receita total, custo dos produtos vendidos, lucro bruto e lucro líquido
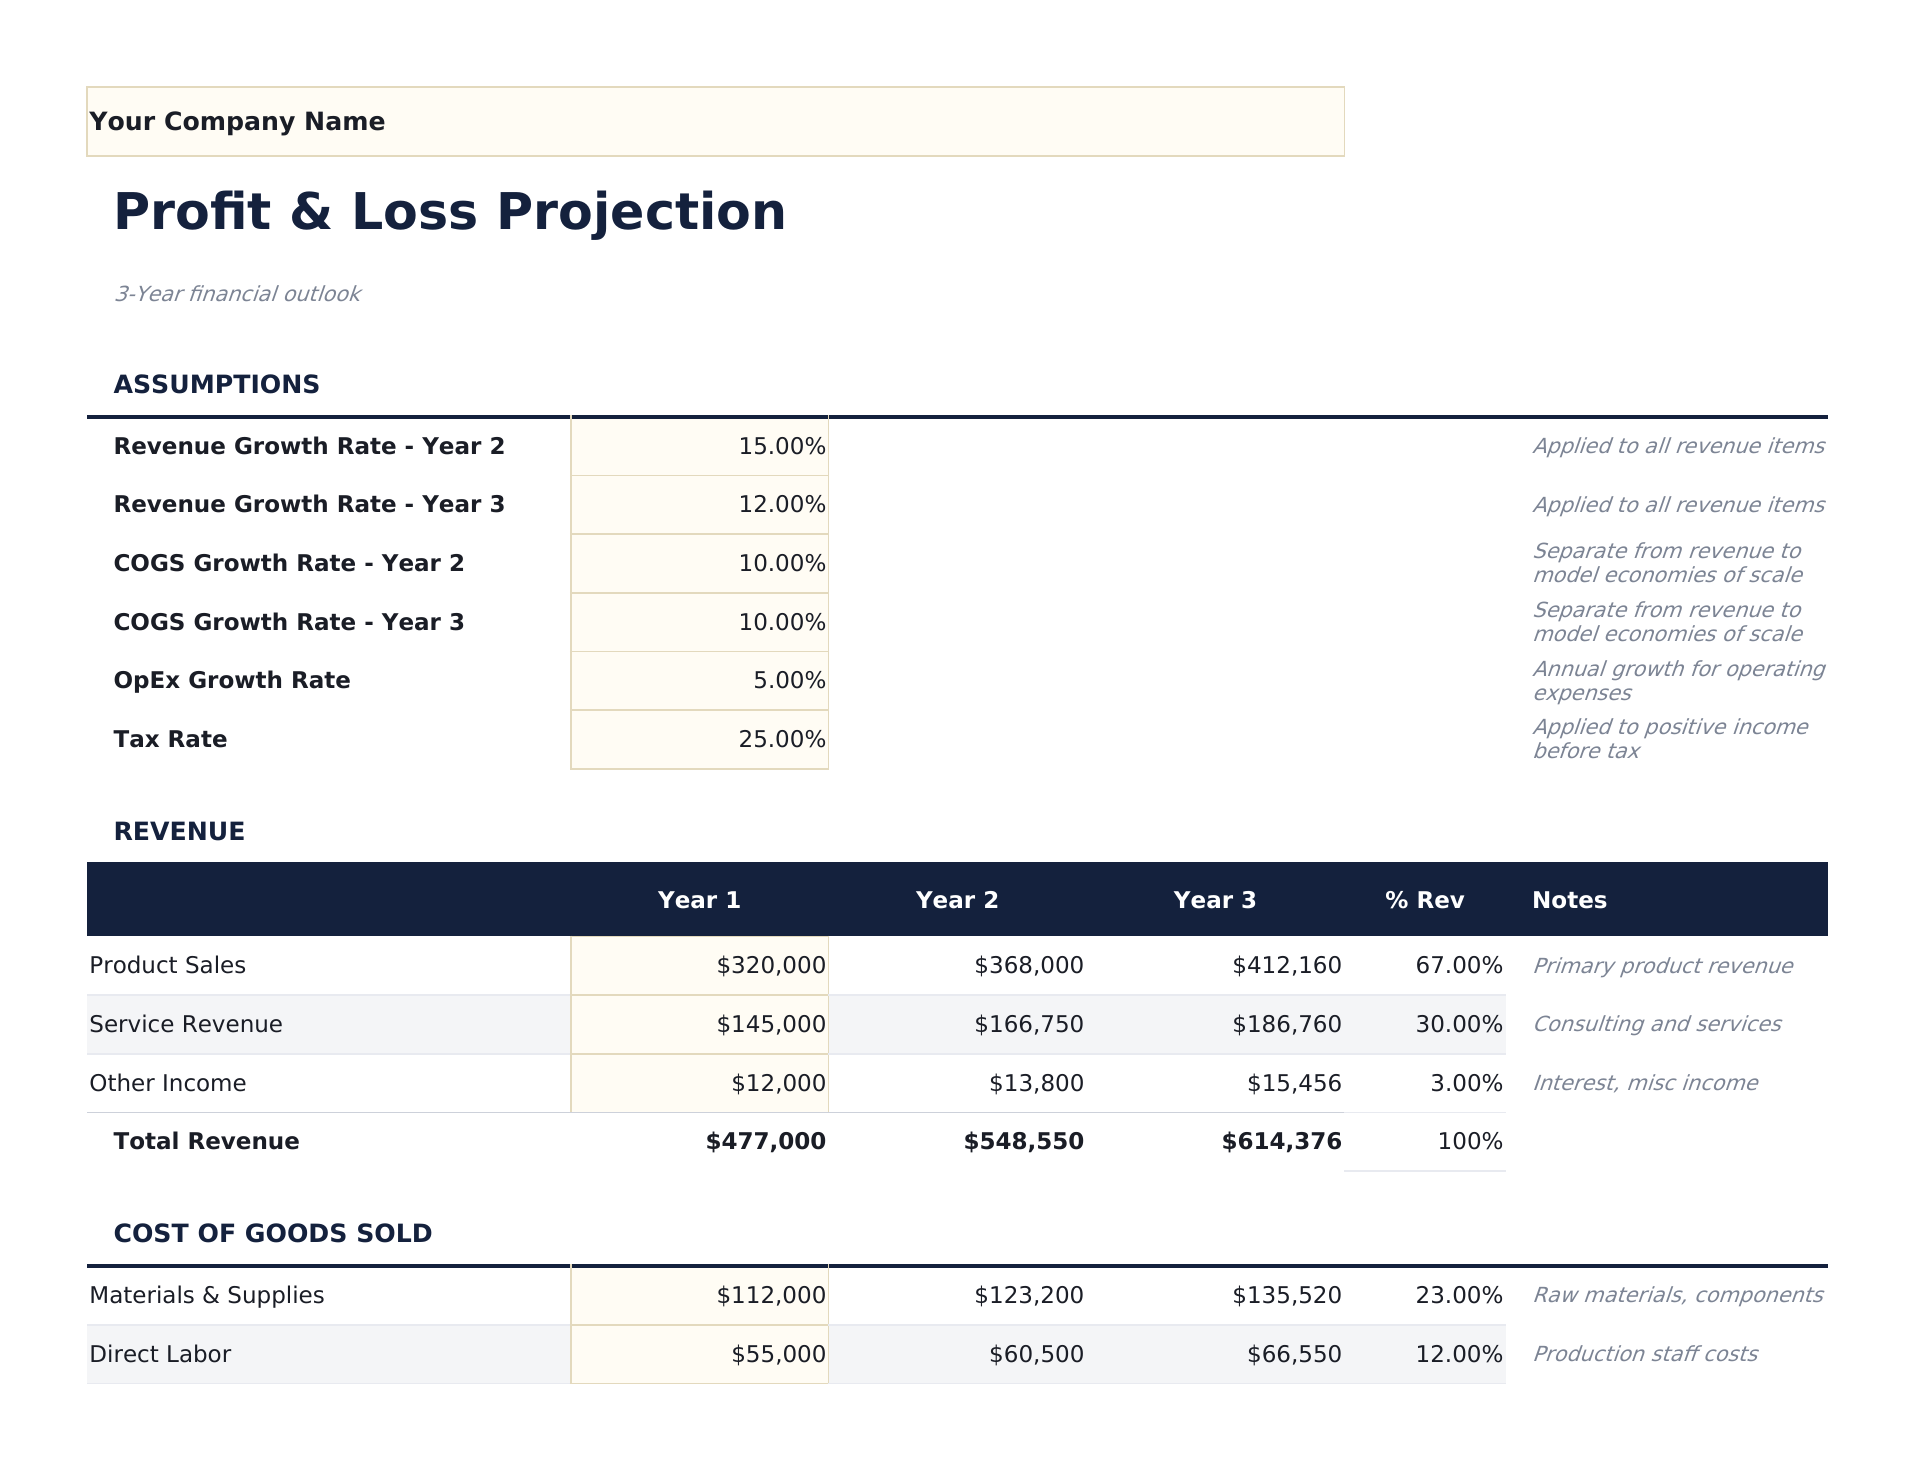
- Demonstração de P&L com linhas de receita, custos diretos, despesas operacionais e receita líquida com subtotais automáticos
- Cálculos de lucro bruto e lucro líquido com percentuais de margem automáticos exibidos ao lado dos valores em dólar
- Colunas de projeção mensal ou trimestral abrangendo até 12 meses com totais anuais automáticos ao final
- Exibição de percentual de margem com células de entrada codificadas por cor (amarelo) e projeções baseadas em fórmulas (azul)
- Funciona em Microsoft Excel, Google Sheets e LibreOffice Calc sem necessidade de configuração
Need more from this template?
The Essentials version covers everyday tracking. Ultimate goes further with multi-entity support, scenario analysis, and ultimate-grade reporting.
- Painel com visão geral de P&L mostrando receita total, custo dos produtos vendidos, lucro bruto e lucro líquido
- Demonstração de P&L com linhas de receita, custos diretos, despesas operacionais e receita líquida com subtotais automáticos
- Cálculos de lucro bruto e lucro líquido com percentuais de margem automáticos exibidos ao lado dos valores em dólar
- Colunas de projeção mensal ou trimestral abrangendo até 12 meses com totais anuais automáticos ao final
- Planilha de Previsão de Receita com até 10 linhas de produtos ou serviços, projeções mensais e totais anuais com acompanhamento de taxa de crescimento
- Planilha de CPV detalhando custos de material direto, mão de obra direta e custos indiretos por linha de receita com cálculos de margem bruta
- Planilha de Despesas Operacionais com 12 categorias de despesas em 12 colunas mensais e acompanhamento de orçamento anual vs realizado
- Demonstração de resultados consolidada extraindo dados de todas as planilhas de entrada: receita, CPV, lucro bruto, despesas operacionais, resultado operacional e lucro líquido
- Painel com 6 cartões de KPI: receita anual, CPV anual, margem bruta %, resultado operacional, lucro líquido e mês de ponto de equilíbrio
Pré-visualização
Veja o que tem dentro desta planilha
Como Usar Esta Planilha de Projeção de Lucros e Perdas
Insira as projeções de receita
Liste cada fluxo de receita com valores mensais ou trimestrais projetados ao longo do período de projeção.
Adicione o custo dos produtos vendidos
Insira custos diretos associados à entrega de seu produto ou serviço. O lucro bruto calcula automaticamente.
Preencha as despesas operacionais
Adicione estimativas mensais para folha de pagamento, aluguel, marketing, serviços públicos, seguro e outras despesas operacionais.
Analise o lucro líquido
O painel mostra receita projetada, margem bruta, despesas operacionais e lucro líquido com percentuais de margem.
Customer Reviews
What Our Customers Say
"If I get half as good at handling my finances as you are at customer service, this'll be the best $26 I've spent lately."
"Great tool! Simplifies financial planning without the hassle of complex spreadsheets."
"I recently purchased your super convenient spreadsheet, it really helps me!"
"They're great and super intuitive. Thank you!"
Criadas com Claude AI. Aperfeiçoadas por nós.
Usamos Claude AI para criar cada planilha, após uma pesquisa aprofundada. Depois, nossa equipe entra em ação. Refinamos o layout, testamos exaustivamente cada fórmula, corrigimos casos extremos e polimos o design até que pareça algo que nós mesmos usaríamos. A IA nos leva 80% do caminho. Os últimos 20% são puro julgamento humano.
Perguntas Frequentes
Quantos meses posso projetar?
O modelo suporta até 12 colunas mensais com um total anual. Ajuste os cabeçalhos de data para seu período de projeção.
O que é lucro bruto vs lucro líquido?
Lucro bruto é receita menos custos diretos (COGS). Lucro líquido subtrai todas as despesas operacionais do lucro bruto. Ambos são mostrados com percentuais de margem.
Posso usar trimestral em vez de mensal?
Sim. Altere os cabeçalhos de coluna de meses para trimestres e insira figuras trimestrais. O total anual ainda soma todas as colunas.
Isso é bom para planejamento de startups?
Sim. As projeções de P&L são uma parte essencial dos planos de negócios. Combine isto com o modelo de Custos de Inicialização para uma visão financeira completa.
Como abrir no Google Sheets?
Envie o arquivo .xlsx para o Google Drive e abra com o Google Sheets. Todas as fórmulas e formatações serão preservadas.
Mais modelos Essentials de Finanças Empresariais
Destaques:
Procurando planilhas premium?
Nossas planilhas pagas incluem painéis avançados com várias abas, gráficos nativos do Excel e atualizações contínuas.
Leve todos os modelos Ultimate
Todos os 58 modelos Ultimate em uma única compra por $299 - valor de $1,102, você fica com $803.