Winst- en verliesprognose Essentials-sjabloon
Projecteer omzet, kosten en winst over een bepaalde periode. Handig voor bedrijfsplanning, prognoses en het evalueren van financiele scenario's.
Wat zit erin
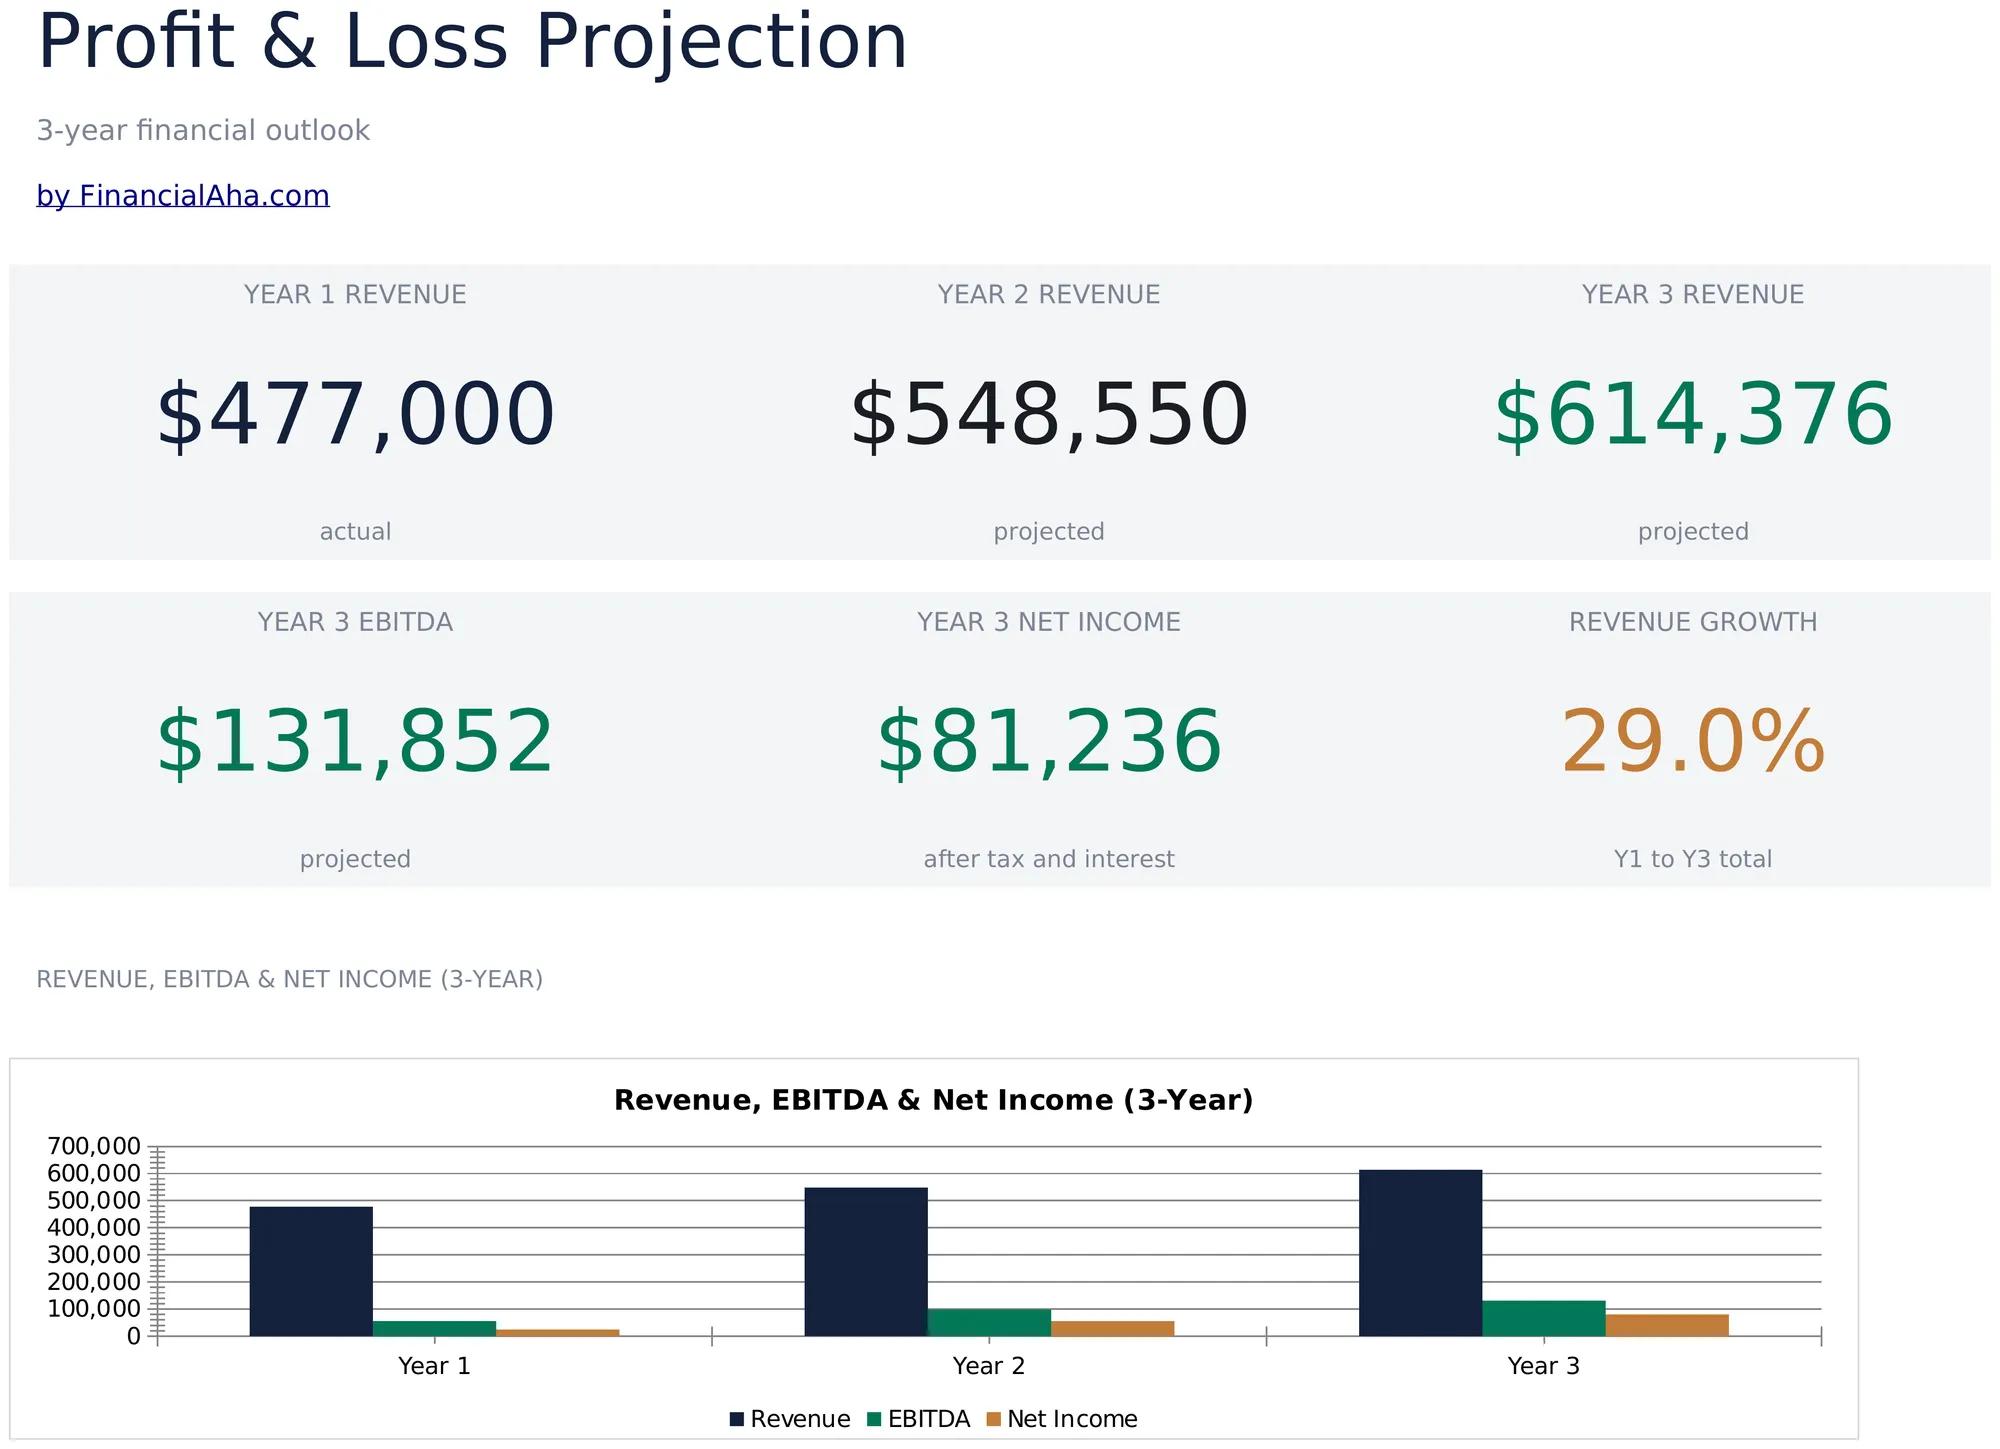
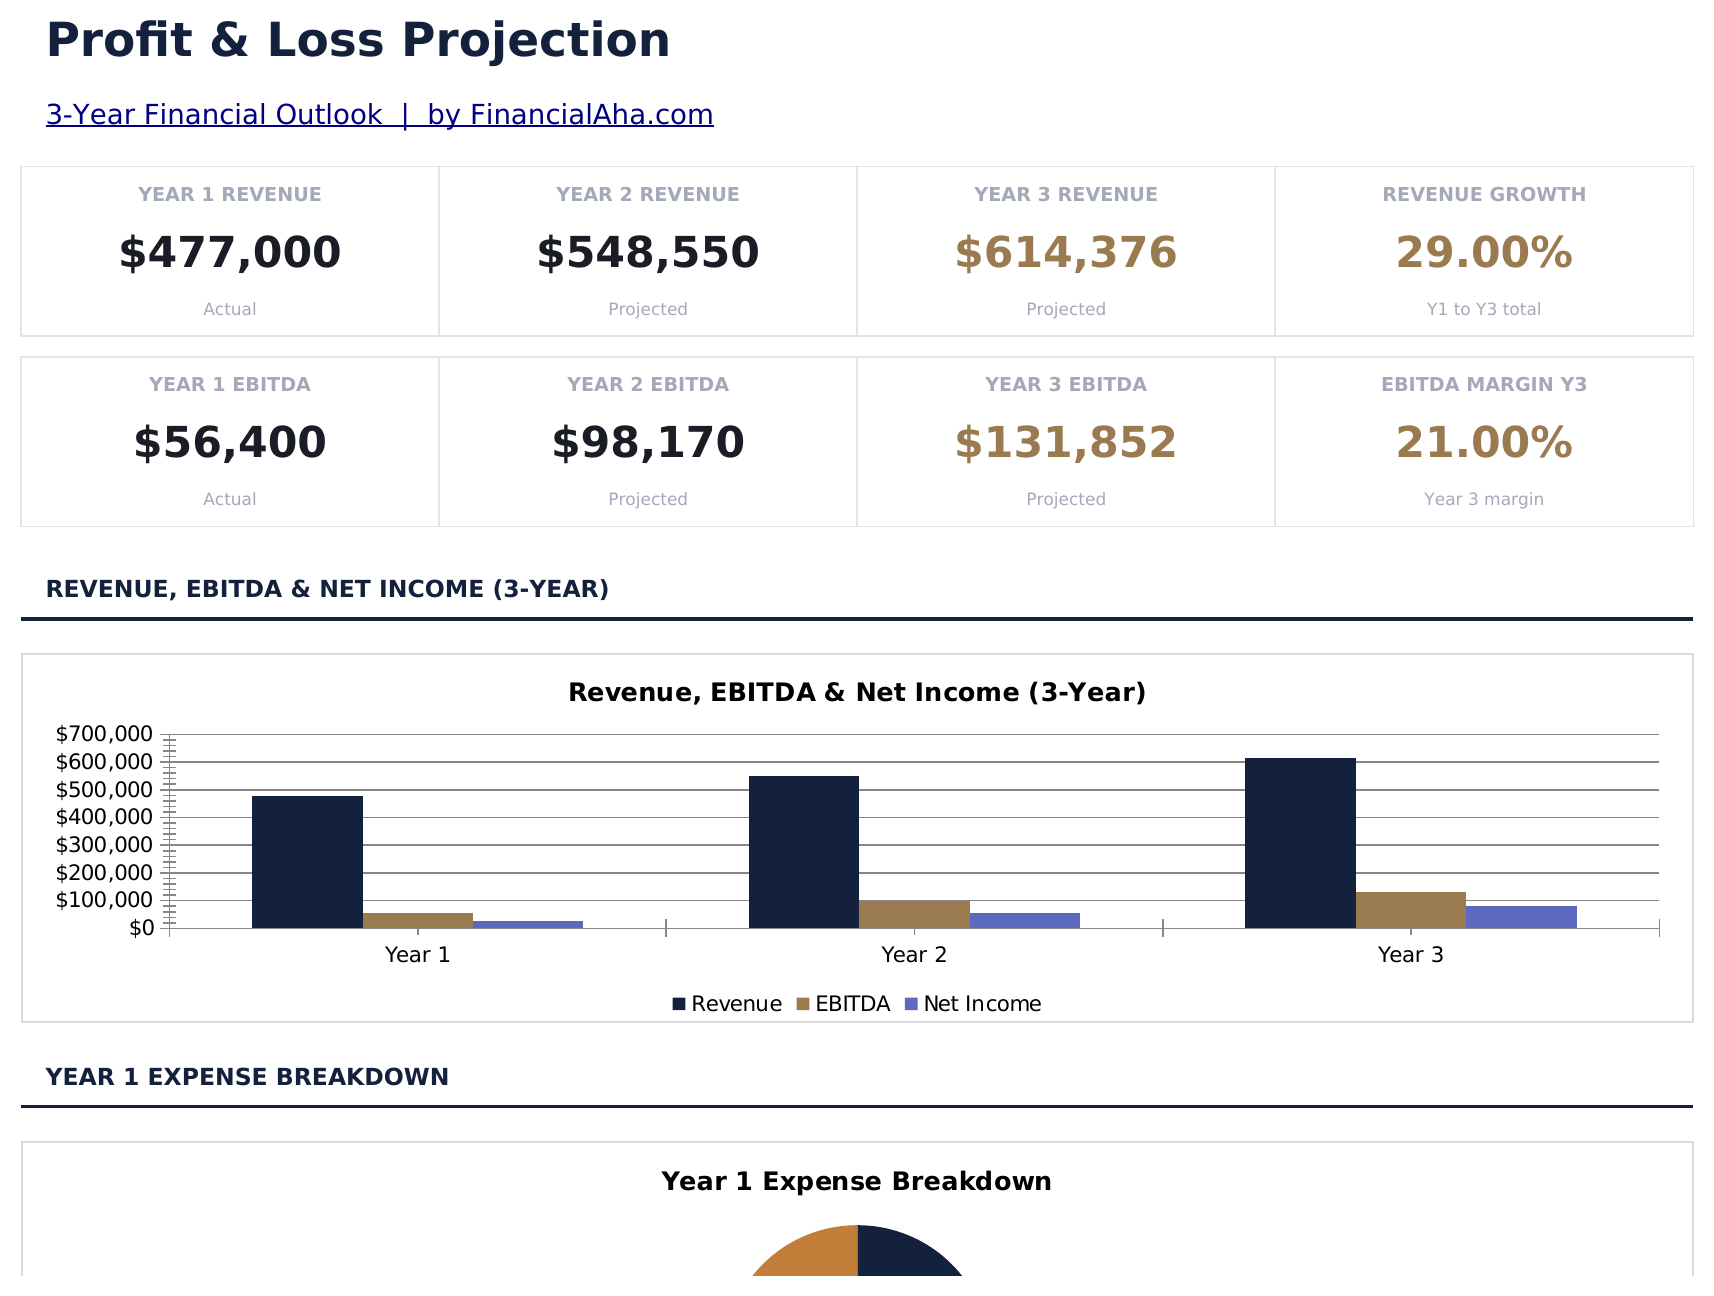
- Dashboard met W&V-overzicht met totale omzet, kostprijs van de omzet, brutowinst en nettowinst
- W&V-overzicht met omzetregels, directe kosten, bedrijfslasten en netto-inkomen met automatische subtotalen
- Brutowinst- en nettowinstberekeningen met automatische margepercentages naast de bedragen
- Maandelijkse of kwartaalkolommen tot 12 maanden met automatische jaartotalen aan het einde
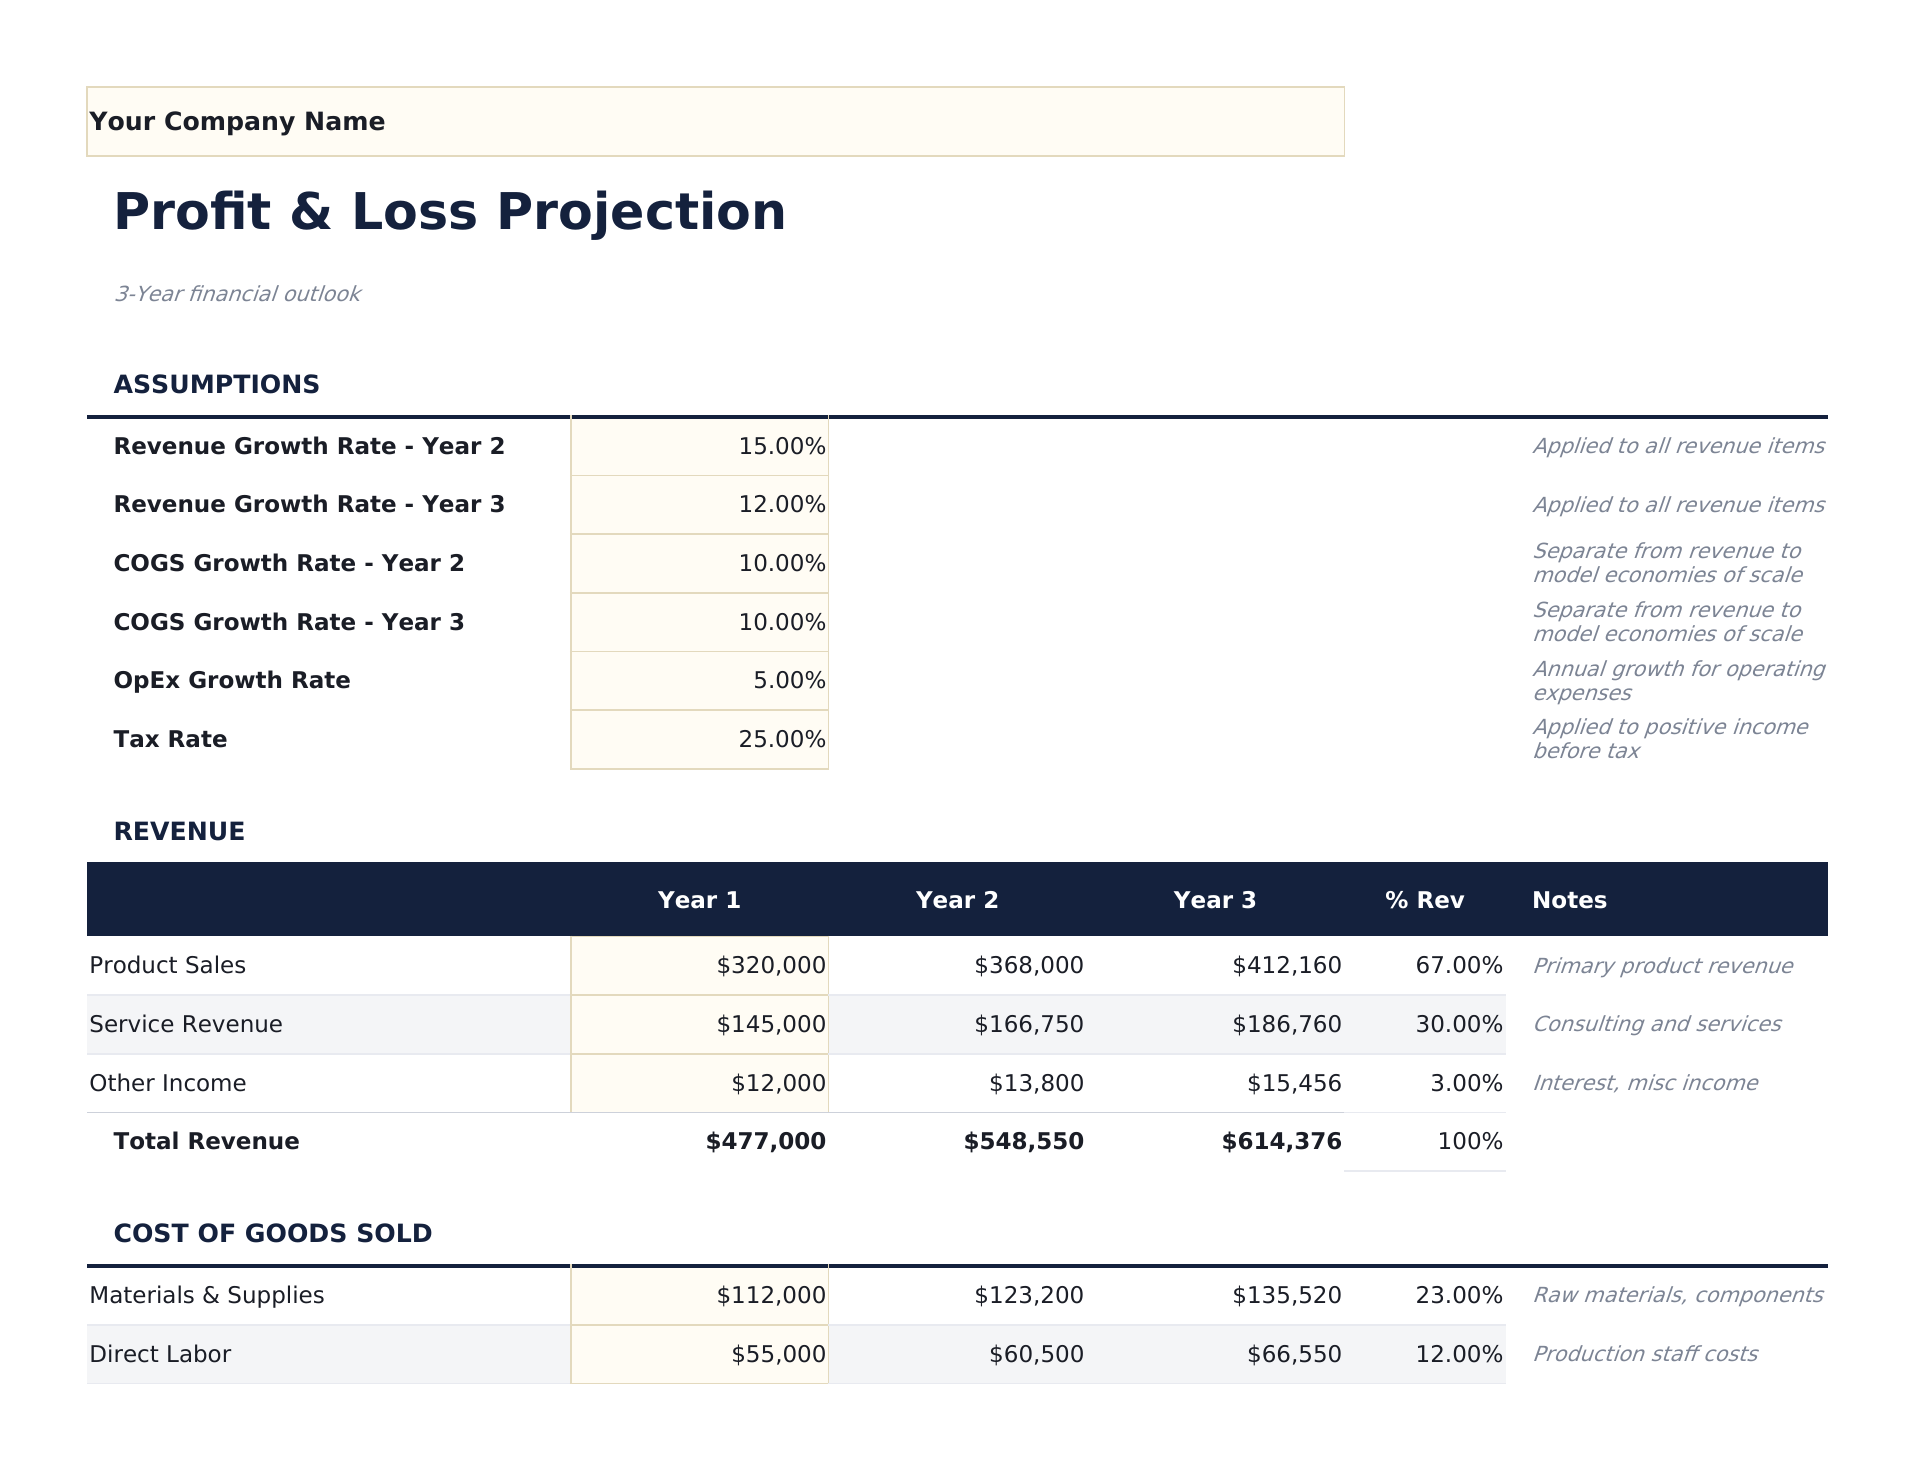
- Margepercentageweergave met kleurgecodeerde invoercellen (geel) en formulegestuurde prognoses (blauw)
- Werkt in Microsoft Excel, Google Sheets en LibreOffice Calc zonder installatie
Need more from this template?
The Essentials version covers everyday tracking. Ultimate goes further with multi-entity support, scenario analysis, and ultimate-grade reporting.
- Dashboard met W&V-overzicht met totale omzet, kostprijs van de omzet, brutowinst en nettowinst
- W&V-overzicht met omzetregels, directe kosten, bedrijfslasten en netto-inkomen met automatische subtotalen
- Brutowinst- en nettowinstberekeningen met automatische margepercentages naast de bedragen
- Maandelijkse of kwartaalkolommen tot 12 maanden met automatische jaartotalen aan het einde
- Werkblad Omzetprognose met tot 10 product- of dienstlijnen, maandelijkse projecties en jaartotalen met groeipercentagetracking
- Werkblad Kostprijs met uitsplitsing van directe materialen, directe arbeid en overheadkosten per omzetlijn met brutomargeberekeningen
- Werkblad Bedrijfskosten met 12 uitgavencategorieën over 12 maandkolommen en jaarlijks budget versus werkelijke tracking
- Geconsolideerde winst- en verliesrekening die uit alle invoerwerkbladen haalt: omzet, kostprijs, brutowinst, bedrijfskosten, bedrijfsresultaat en nettoresultaat
- Dashboard met 6 KPI-kaarten: jaaromzet, jaarlijkse kostprijs, brutomarge %, bedrijfsresultaat, nettoresultaat en break-evenmaand
Voorbeeld
Bekijk wat er in dit sjabloon zit
Hoe gebruik je dit Winst- en verliesprognose sjabloon
Omzetprognoses invoeren
Vermeld elke omzetstroom met geprojecteerde maandelijkse of kwartaalbedragen over de prognoseperiode.
Kostprijs van de omzet toevoegen
Voer directe kosten in die verband houden met het leveren van je product of dienst. Brutowinst wordt automatisch berekend.
Bedrijfslasten invullen
Voeg maandelijkse schattingen toe voor salarissen, huur, marketing, nutsvoorzieningen, verzekeringen en andere bedrijfskosten.
Nettowinst controleren
Het dashboard toont geprojecteerde omzet, brutomarge, bedrijfslasten en nettowinst met margepercentages.
Customer Reviews
What Our Customers Say
"If I get half as good at handling my finances as you are at customer service, this'll be the best $26 I've spent lately."
"Great tool! Simplifies financial planning without the hassle of complex spreadsheets."
"I recently purchased your super convenient spreadsheet, it really helps me!"
"They're great and super intuitive. Thank you!"
Gebouwd door Claude AI. Verfijnd door ons.
We gebruiken Claude AI om elk sjabloon te ontwerpen, na uitgebreid onderzoek. Daarna neemt ons team het over. We verfijnen de indeling, testen elke formule grondig, lossen randgevallen op en polijsten het ontwerp totdat het iets is dat we zelf ook echt zouden gebruiken. De AI brengt ons 80% van de weg. De laatste 20% is puur menselijk oordeel.
Veelgestelde vragen
Hoeveel maanden kan ik projecteren?
Het sjabloon ondersteunt tot 12 maandelijkse kolommen met een jaartotaal. Pas de datumkopteksten aan voor je prognoseperiode.
Wat is brutowinst vs. nettowinst?
Brutowinst is omzet minus directe kosten (kostprijs). Nettowinst trekt alle bedrijfslasten af van de brutowinst. Beide worden getoond met margepercentages.
Kan ik kwartaal gebruiken in plaats van maandelijks?
Ja. Wijzig de kolomkopteksten van maanden naar kwartalen en voer kwartaalcijfers in. Het jaartotaal telt nog steeds alle kolommen op.
Is dit geschikt voor startupplanning?
Ja. W&V-prognoses zijn een kernonderdeel van bedrijfsplannen. Combineer dit met het Opstartkosten-sjabloon voor een compleet financieel beeld.
Hoe open ik dit in Google Sheets?
Upload het .xlsx-bestand naar Google Drive en open het vervolgens met Google Sheets. Alle formules en opmaak blijven behouden.
Meer Essentials-sjablonen voor Bedrijfsfinancien
Hoogtepunten:
Op zoek naar premium spreadsheet-sjablonen?
Onze betaalde sjablonen bevatten geavanceerde dashboards met meerdere werkbladen, ingebouwde Excel-grafieken en doorlopende updates.
Krijg in plaats daarvan elk Ultimate sjabloon
Alle 58 Ultimate sjablonen in één aankoop voor $299 - $1,102 waarde, u houdt $803 over.