Proiezione Conto Economico Modello Essentials
Proietta ricavi, costi e profitti su un periodo specificato. Utile per la pianificazione aziendale, le previsioni e la valutazione di scenari finanziari.
Cosa include
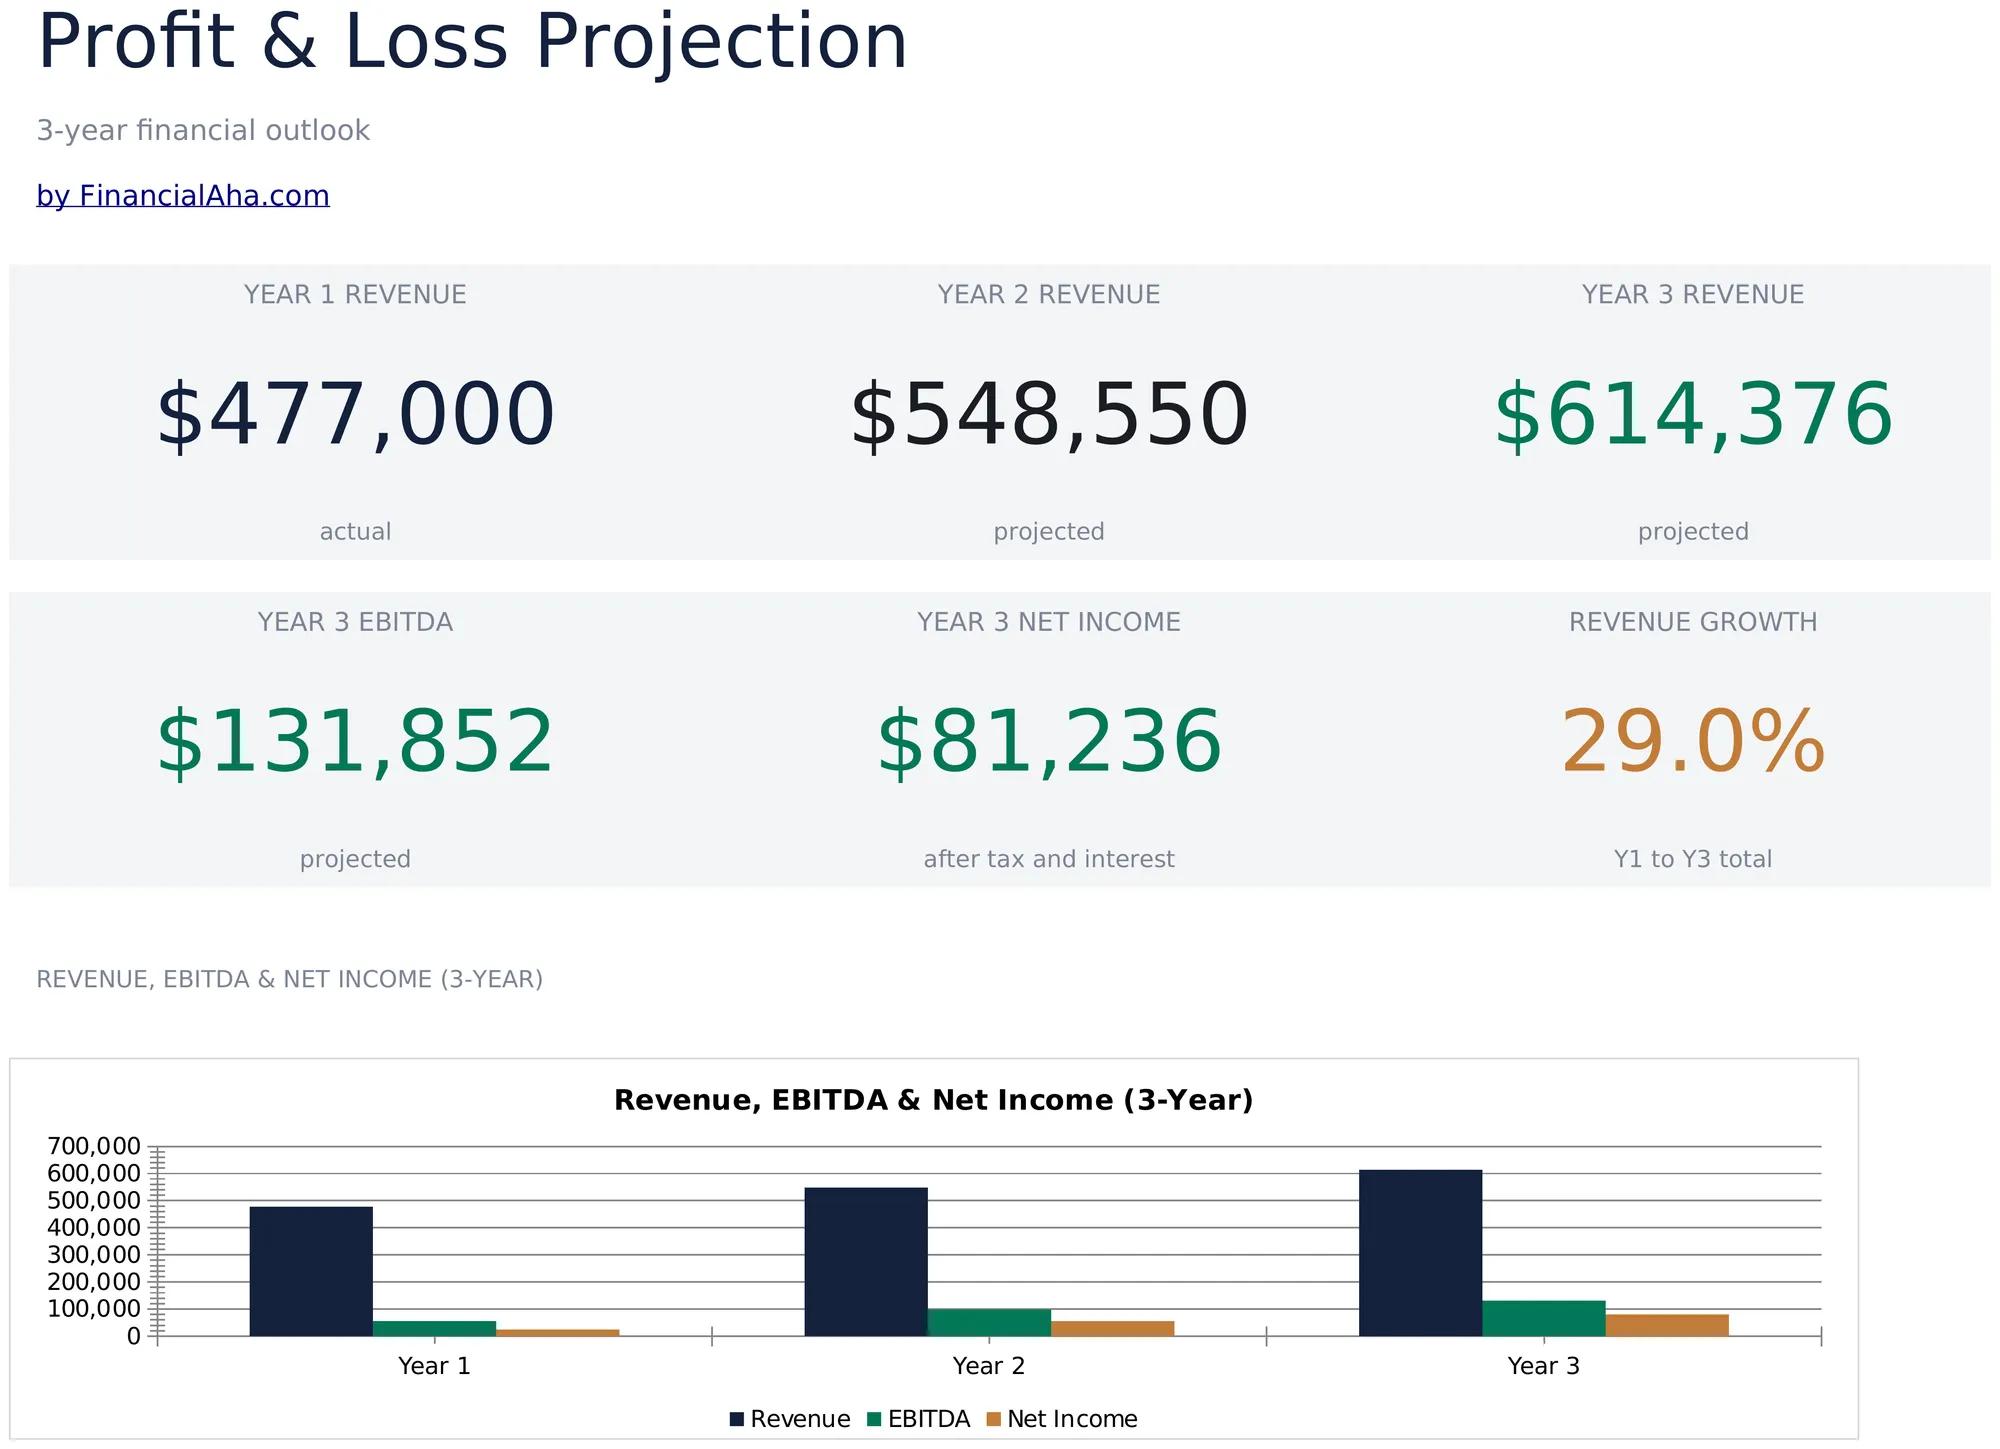
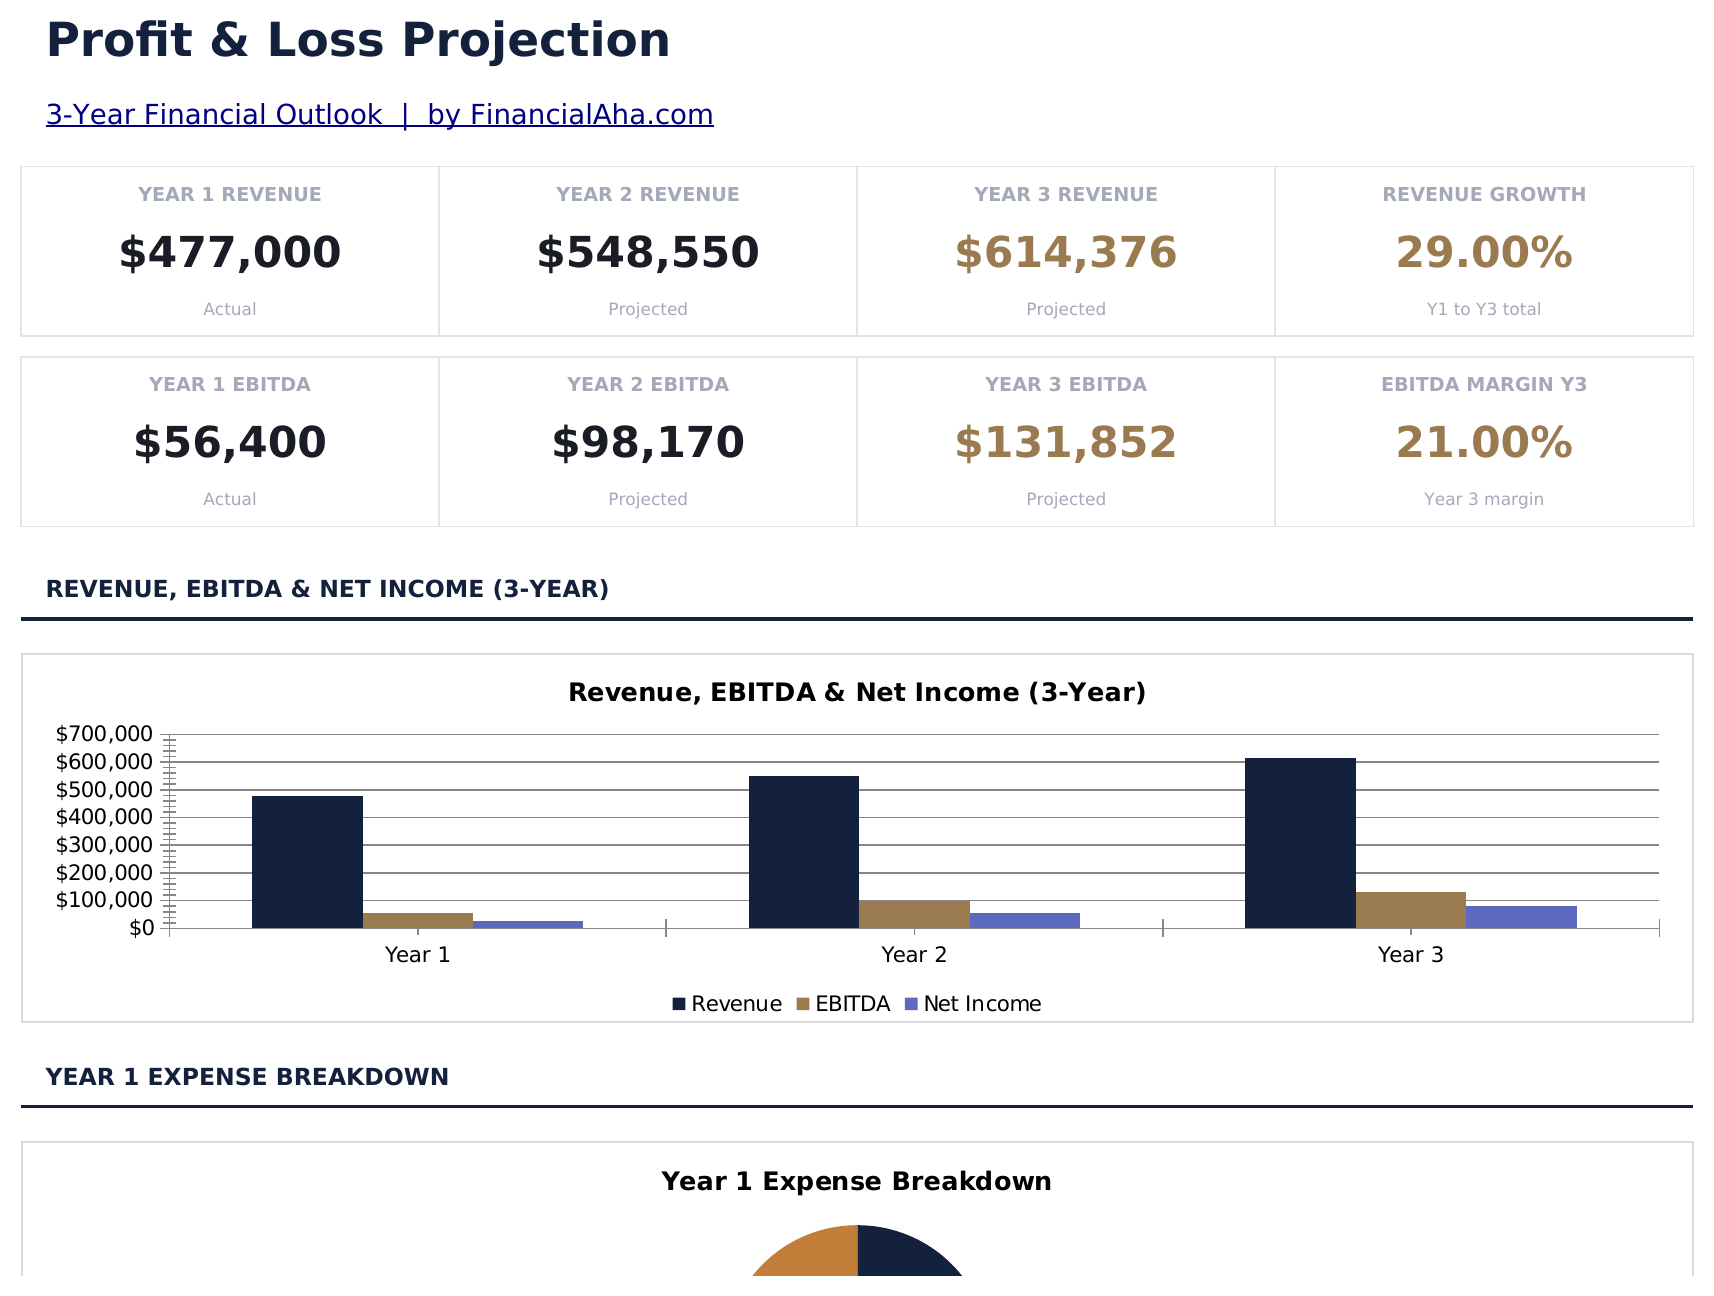
- Dashboard con panoramica del conto economico che mostra ricavi totali, costo del venduto, profitto lordo e profitto netto
- Conto economico con righe dei ricavi, costi diretti, spese operative e reddito netto con subtotali automatici
- Calcoli del profitto lordo e netto con percentuali di margine automatiche visualizzate accanto agli importi in $
- Colonne di proiezione mensile o trimestrale fino a 12 mesi con totali annuali automatici alla fine
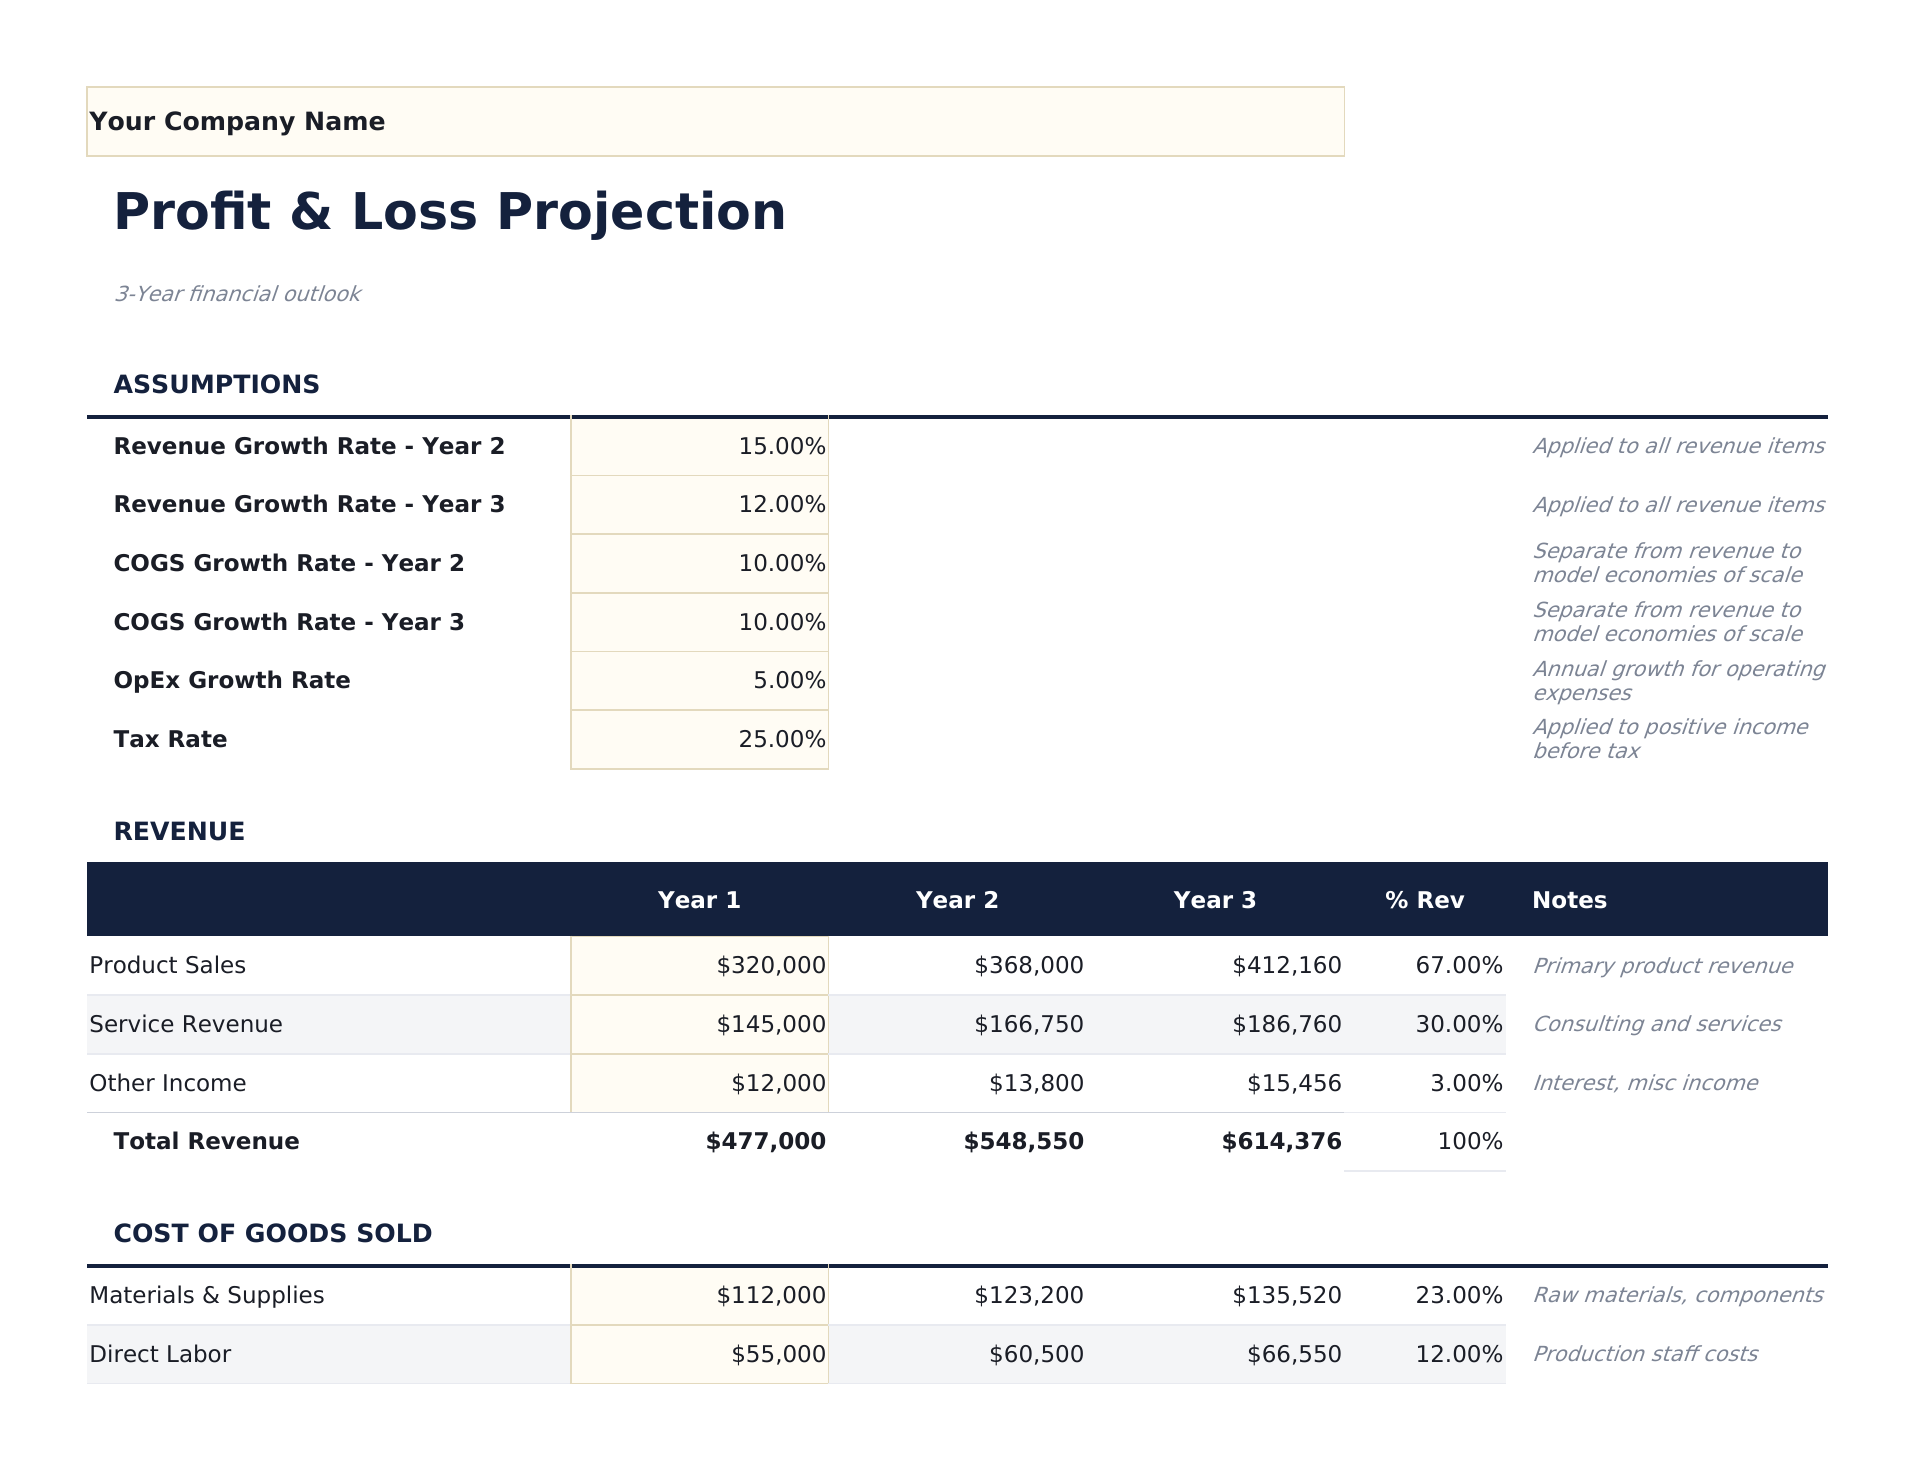
- Visualizzazione della percentuale di margine con celle di input colorate (giallo) e proiezioni basate su formule (blu)
- Funziona in Microsoft Excel, Google Sheets e LibreOffice Calc senza alcuna configurazione richiesta
Need more from this template?
The Essentials version covers everyday tracking. Ultimate goes further with multi-entity support, scenario analysis, and ultimate-grade reporting.
- Dashboard con panoramica del conto economico che mostra ricavi totali, costo del venduto, profitto lordo e profitto netto
- Conto economico con righe dei ricavi, costi diretti, spese operative e reddito netto con subtotali automatici
- Calcoli del profitto lordo e netto con percentuali di margine automatiche visualizzate accanto agli importi in $
- Colonne di proiezione mensile o trimestrale fino a 12 mesi con totali annuali automatici alla fine
- Foglio Previsione Ricavi con fino a 10 linee di prodotto o servizio, proiezioni mensili e totali annuali con monitoraggio del tasso di crescita
- Foglio Costi di Produzione con dettaglio materiali diretti, manodopera diretta e costi generali per linea di ricavo con calcoli del margine lordo
- Foglio Spese Operative con 12 categorie di spesa su 12 colonne mensili e monitoraggio budget vs consuntivo annuale
- Conto Economico consolidato che estrae da tutti i fogli di input: ricavi, costi di produzione, utile lordo, spese operative, risultato operativo e utile netto
- Dashboard con 6 schede KPI: ricavi annuali, costi di produzione annuali, margine lordo %, risultato operativo, utile netto e mese di break-even
Anteprima
Scopri cosa contiene questo modello
Come usare questo modello Proiezione Conto Economico
Inserisci le proiezioni dei ricavi
Elenca ogni flusso di ricavi con importi mensili o trimestrali previsti nel periodo di proiezione.
Aggiungi il costo del venduto
Inserisci i costi diretti associati alla fornitura del tuo prodotto o servizio. Il profitto lordo viene calcolato automaticamente.
Compila le spese operative
Aggiungi stime mensili per stipendi, affitto, marketing, utenze, assicurazione e altri costi operativi.
Verifica il profitto netto
Il dashboard mostra i ricavi previsti, il margine lordo, le spese operative e il profitto netto con le percentuali di margine.
Customer Reviews
What Our Customers Say
"If I get half as good at handling my finances as you are at customer service, this'll be the best $26 I've spent lately."
"Great tool! Simplifies financial planning without the hassle of complex spreadsheets."
"I recently purchased your super convenient spreadsheet, it really helps me!"
"They're great and super intuitive. Thank you!"
Creati da Claude AI. Perfezionati da noi.
Utilizziamo Claude AI per creare ogni modello, dopo una ricerca approfondita. Poi interviene il nostro team. Miglioriamo il layout, testiamo ogni formula, correggiamo i casi limite e rifiniamo il design fino a ottenere qualcosa che useremmo noi stessi. L'AI ci porta all'80%. L'ultimo 20% è tutto giudizio umano.
Domande frequenti
Quanti mesi posso proiettare?
Il modello supporta fino a 12 colonne mensili con un totale annuale. Adatta le intestazioni delle date al tuo periodo di proiezione.
Qual è la differenza tra profitto lordo e profitto netto?
Il profitto lordo è il ricavo meno i costi diretti (COGS). Il profitto netto sottrae tutte le spese operative dal profitto lordo. Entrambi sono mostrati con le percentuali di margine.
Posso usare dati trimestrali invece che mensili?
Sì. Cambia le intestazioni delle colonne da mesi a trimestri e inserisci i dati trimestrali. Il totale annuale somma comunque tutte le colonne.
È adatto alla pianificazione per le startup?
Sì. Le proiezioni di conto economico sono una parte fondamentale dei piani aziendali. Combinalo con il modello Costi di Avvio per un quadro finanziario completo.
Come posso aprirlo in Google Sheets?
Carica il file .xlsx su Google Drive, poi aprilo con Google Sheets. Tutte le formule e la formattazione saranno conservate.
Altri modelli Essentials Finanza Aziendale
Punti Chiave:
Cerchi modelli di fogli di calcolo premium?
I nostri modelli a pagamento includono dashboard multi-foglio avanzate, grafici nativi Excel e aggiornamenti continui.
Privato e sicuro
I tuoi dati finanziari restano sul tuo dispositivo. Non li vediamo mai.
Scopri di piu →Ottieni invece ogni modello Ultimate
Tutti i 58 modelli Ultimate in un unico acquisto per $299 - valore di $1,102, risparmi $803.