Sales Forecast Essentials Template
Project future sales by product, service, or channel. Build revenue forecasts with growth assumptions and seasonal adjustments.
What's Included
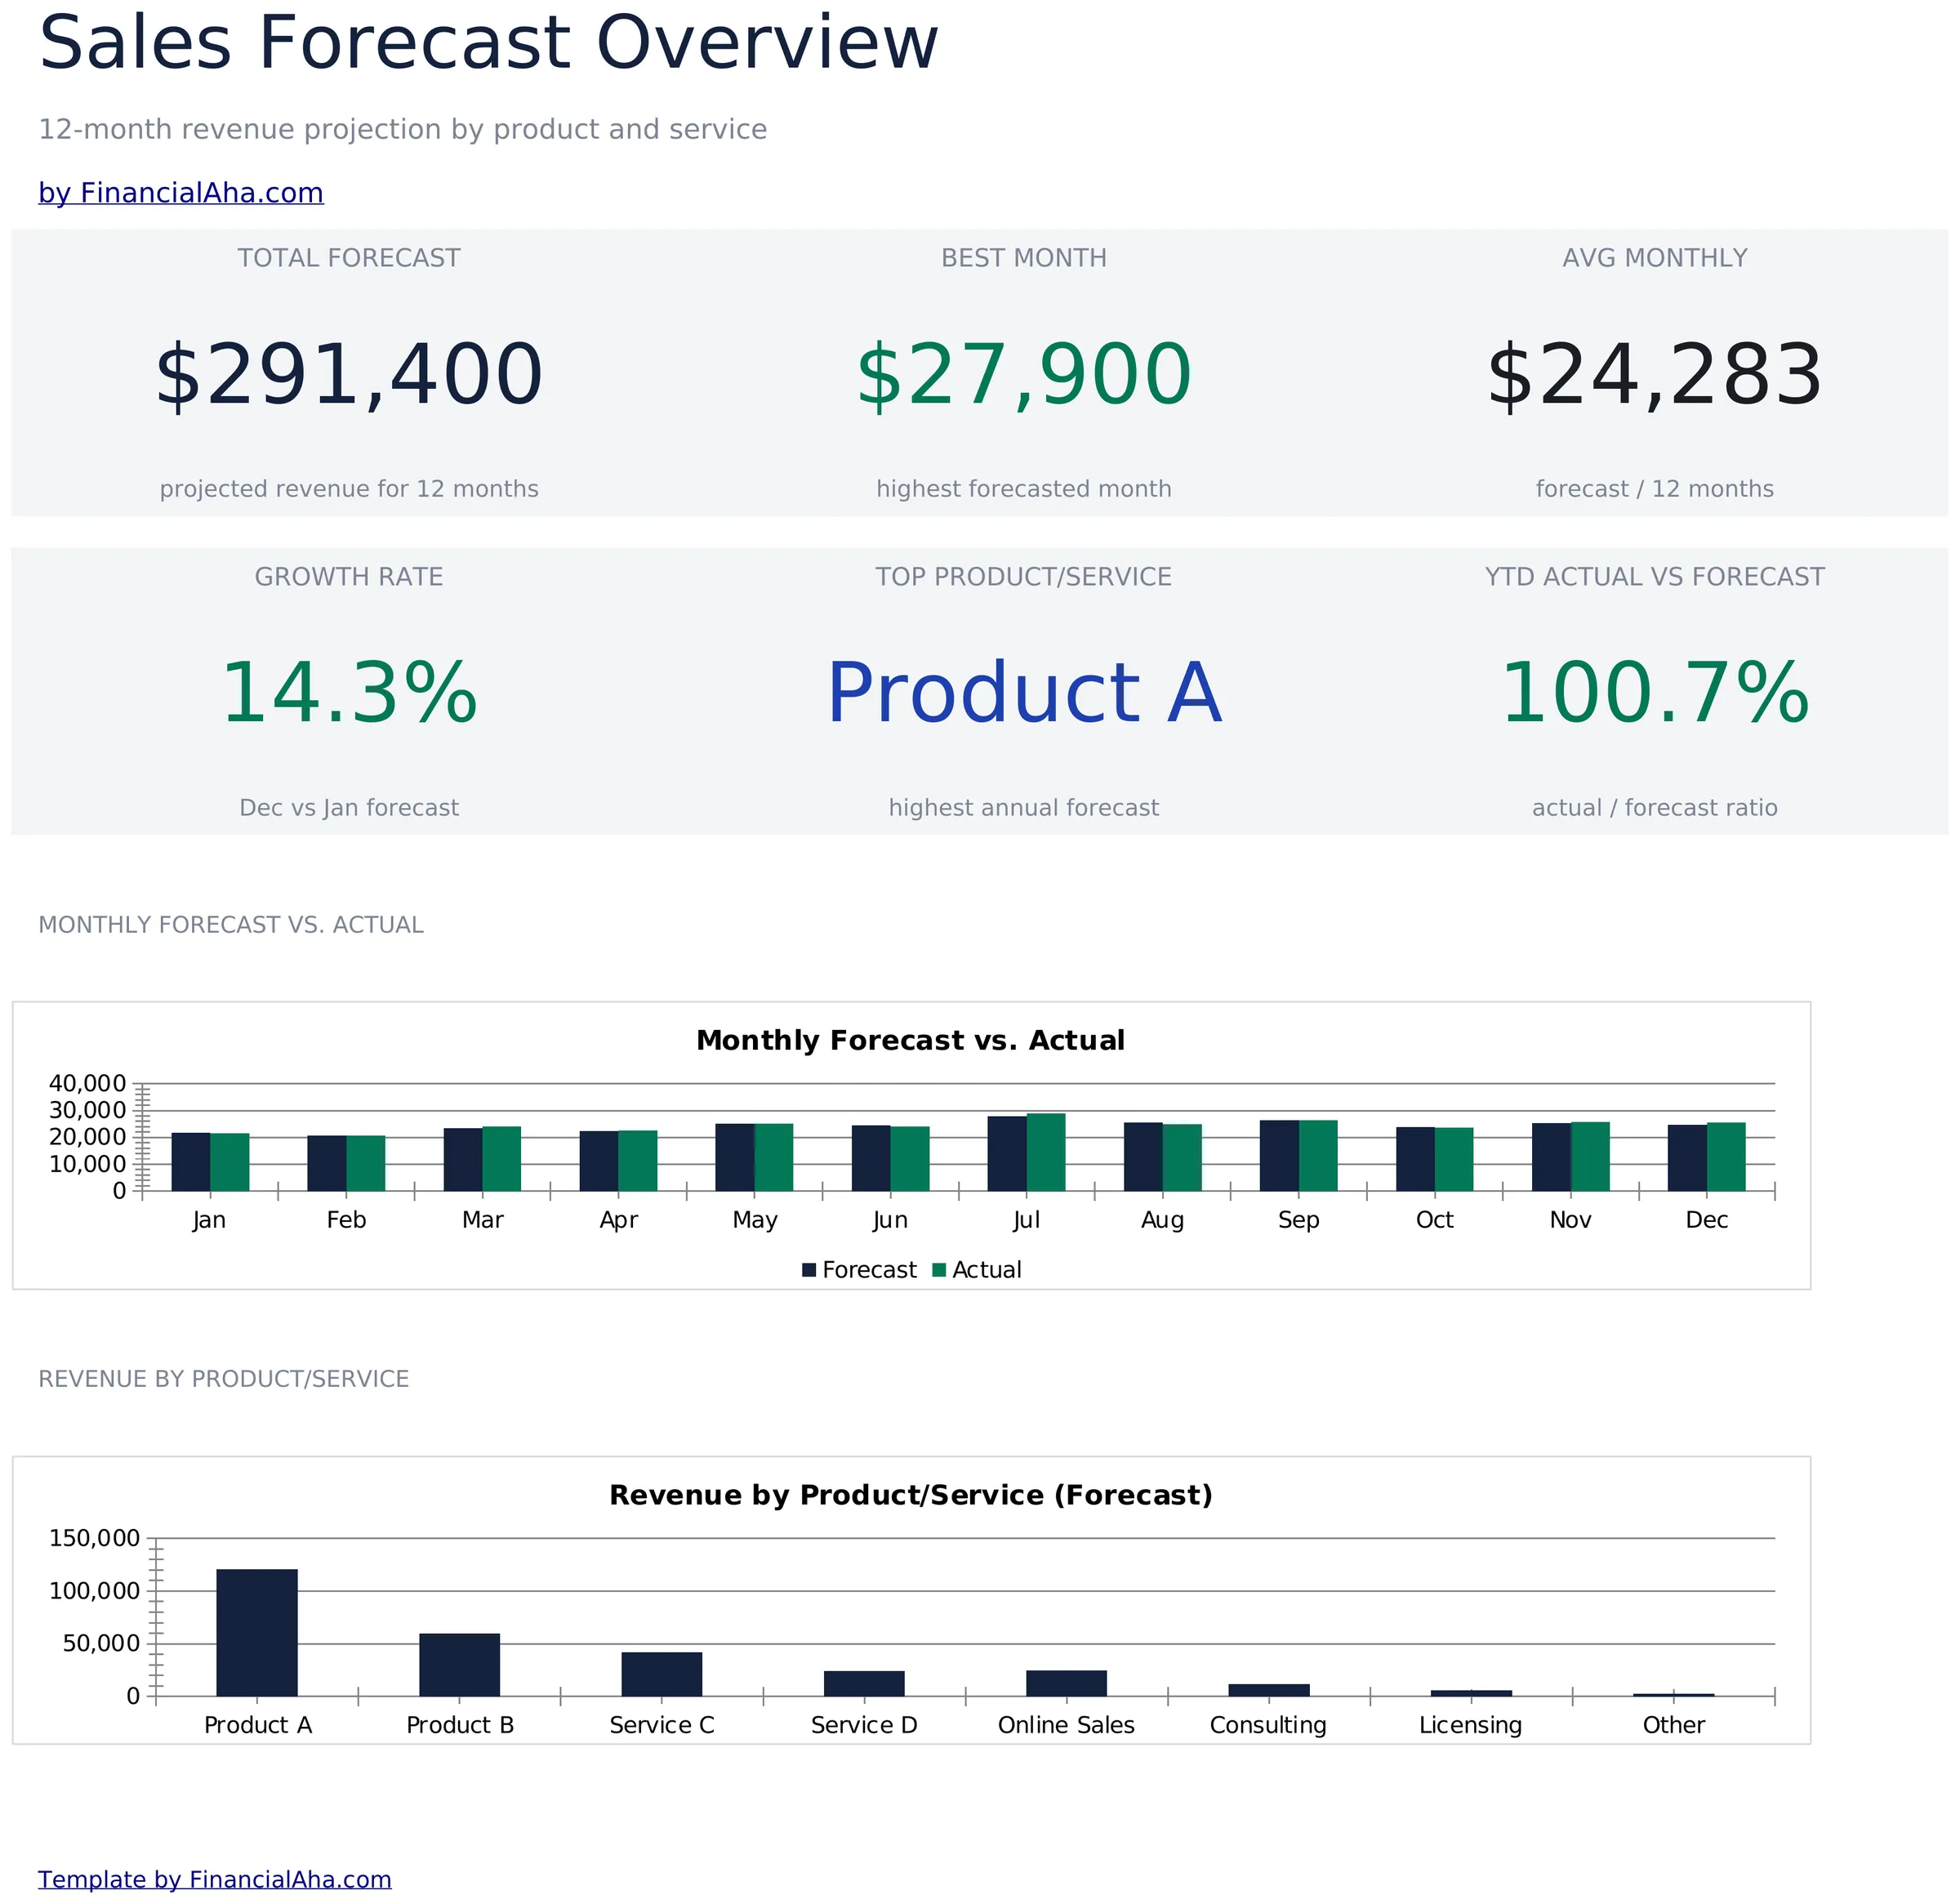
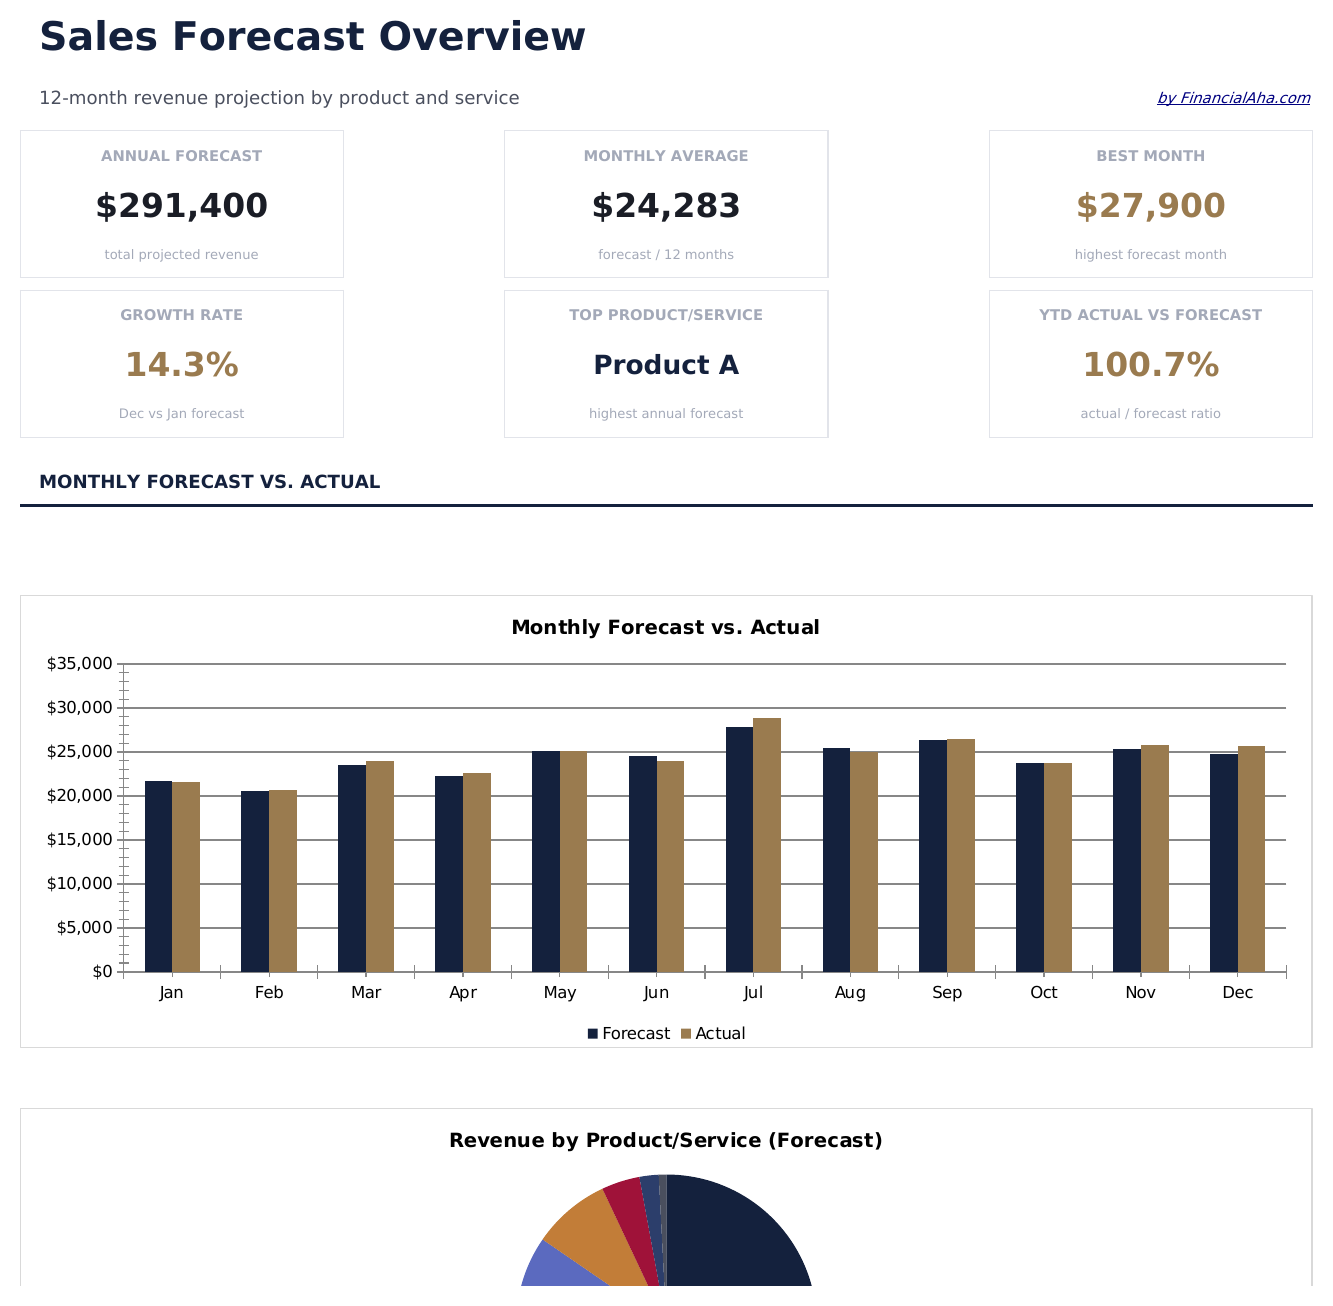
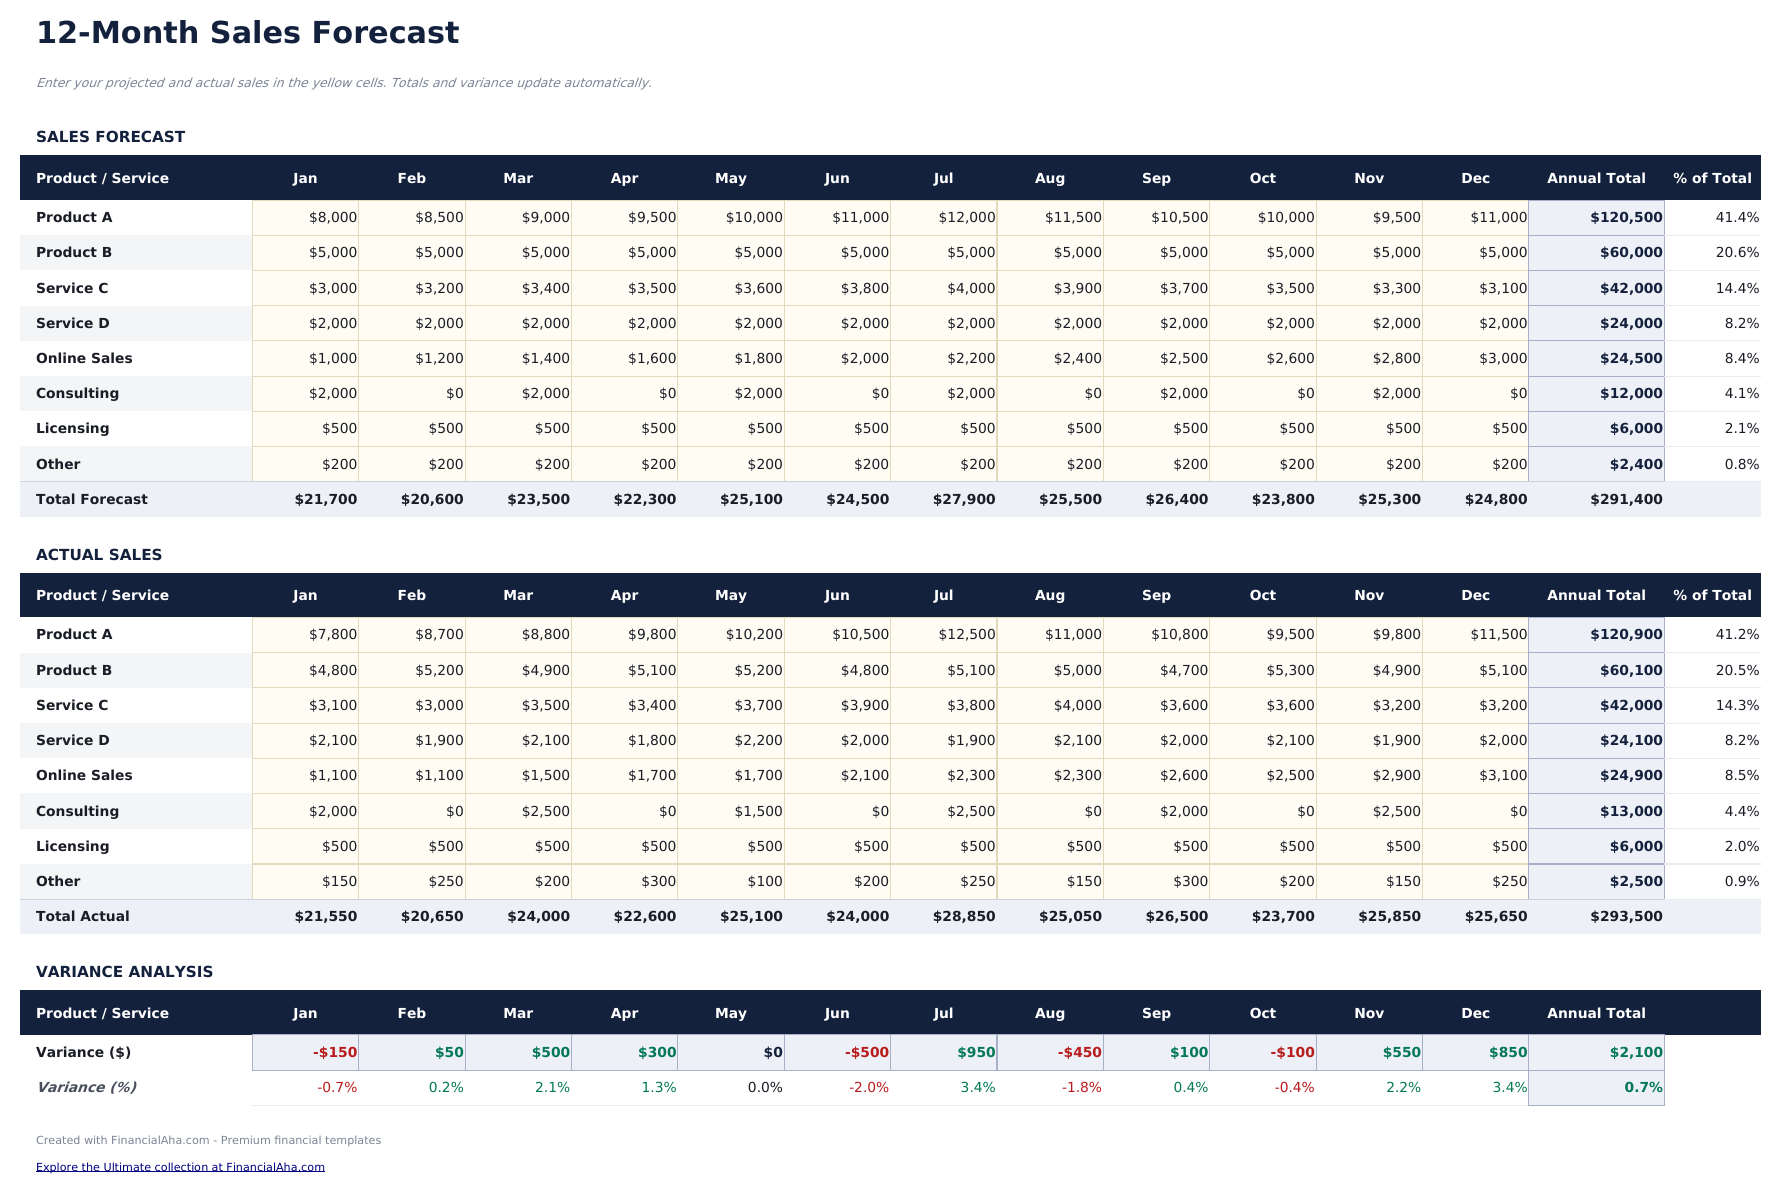
- Dashboard with sales forecast summary showing projected total revenue, growth rate, and top product lines
- Sales forecast by product or channel with unit volume, average price, and total revenue per line item
- Growth rate assumptions with adjustable month-over-month or year-over-year percentage increase inputs
- Monthly and annual projection columns that apply growth rates to baseline figures across the forecast period
- Actual vs. forecast comparison columns with color-coded variance indicators highlighting over or under performance
- Works in Microsoft Excel, Google Sheets, and LibreOffice Calc with no setup required
Need more from this template?
The Essentials version covers everyday tracking. Ultimate goes further with multi-entity support, scenario analysis, and ultimate-grade reporting.
- Dashboard with sales forecast summary showing projected total revenue, growth rate, and top product lines
- Sales forecast by product or channel with unit volume, average price, and total revenue per line item
- Growth rate assumptions with adjustable month-over-month or year-over-year percentage increase inputs
- Monthly and annual projection columns that apply growth rates to baseline figures across the forecast period
- Track up to 50 active deals with company, contact, deal size, stage, probability, expected close date, and owner
- Dashboard with 6 KPI cards: total pipeline value, weighted pipeline, deals in pipeline, average deal size, win rate, and forecast this month
- Pipeline sheet with stage-based probability weighting that automatically calculates weighted forecast value per deal
- Monthly Forecast sheet projecting expected bookings by month based on close dates and weighted deal values
- Stage Analysis sheet showing deal count, total value, average size, and weighted value per pipeline stage
Preview
See what's inside this template
How to Use This Sales Forecast Template
Define product lines
List each product, service, or revenue channel as a separate row with its baseline sales volume and average price.
Set growth assumptions
Enter month-over-month or year-over-year growth rates for each product line. The template applies these to baseline figures.
Review projections
Monthly columns show projected revenue growing over the forecast period based on your volume and pricing assumptions.
Compare to actuals
As real sales come in, enter actual figures alongside projections. The variance column shows where performance differs from the forecast.
Customer Reviews
What Our Customers Say
"If I get half as good at handling my finances as you are at customer service, this'll be the best $26 I've spent lately."
"Great tool! Simplifies financial planning without the hassle of complex spreadsheets."
"I recently purchased your super convenient spreadsheet, it really helps me!"
"They're great and super intuitive. Thank you!"
Built by Claude AI. Perfected by us.
We use Claude AI to draft each template, after a deep research. Then our team steps in. We refine the layout, stress-test every formula, fix edge cases, and polish the design until it feels like something we would actually use ourselves. The AI gets us 80% there. The last 20% is all human judgment.
Frequently Asked Questions
Can I forecast by channel?
Yes. Use each row for a different sales channel - online, retail, wholesale, or direct. The template totals across all channels.
How do I set growth rates?
Enter a percentage growth rate per product line. The template applies this rate to the prior month sales to generate each subsequent month projection.
Does it handle seasonal adjustments?
You can manually adjust individual month projections higher or lower to account for seasonal patterns on top of the base growth rate.
Can I compare forecast to actuals?
Yes. Actual vs forecast comparison columns with variance indicators show whether real sales are ahead of or behind the projection.
How do I open this in Google Sheets?
Upload the .xlsx file to Google Drive, then open it with Google Sheets. All formulas and formatting will be preserved.
More Essentials Business Finance Templates
Highlights:
Looking for premium spreadsheet templates?
Our paid templates include advanced multi-sheet dashboards, native Excel charts, and ongoing updates.
Get every Ultimate template instead
All 58 Ultimate templates in one purchase for $299 - $1,102 value, you keep $803.