Absatzprognose Essentials-Vorlage
Prognostizieren Sie zukuenftige Verkaeufe nach Produkt, Dienstleistung oder Kanal. Erstellen Sie Umsatzprognosen mit Wachstumsannahmen und saisonalen Anpassungen.
Was enthalten ist
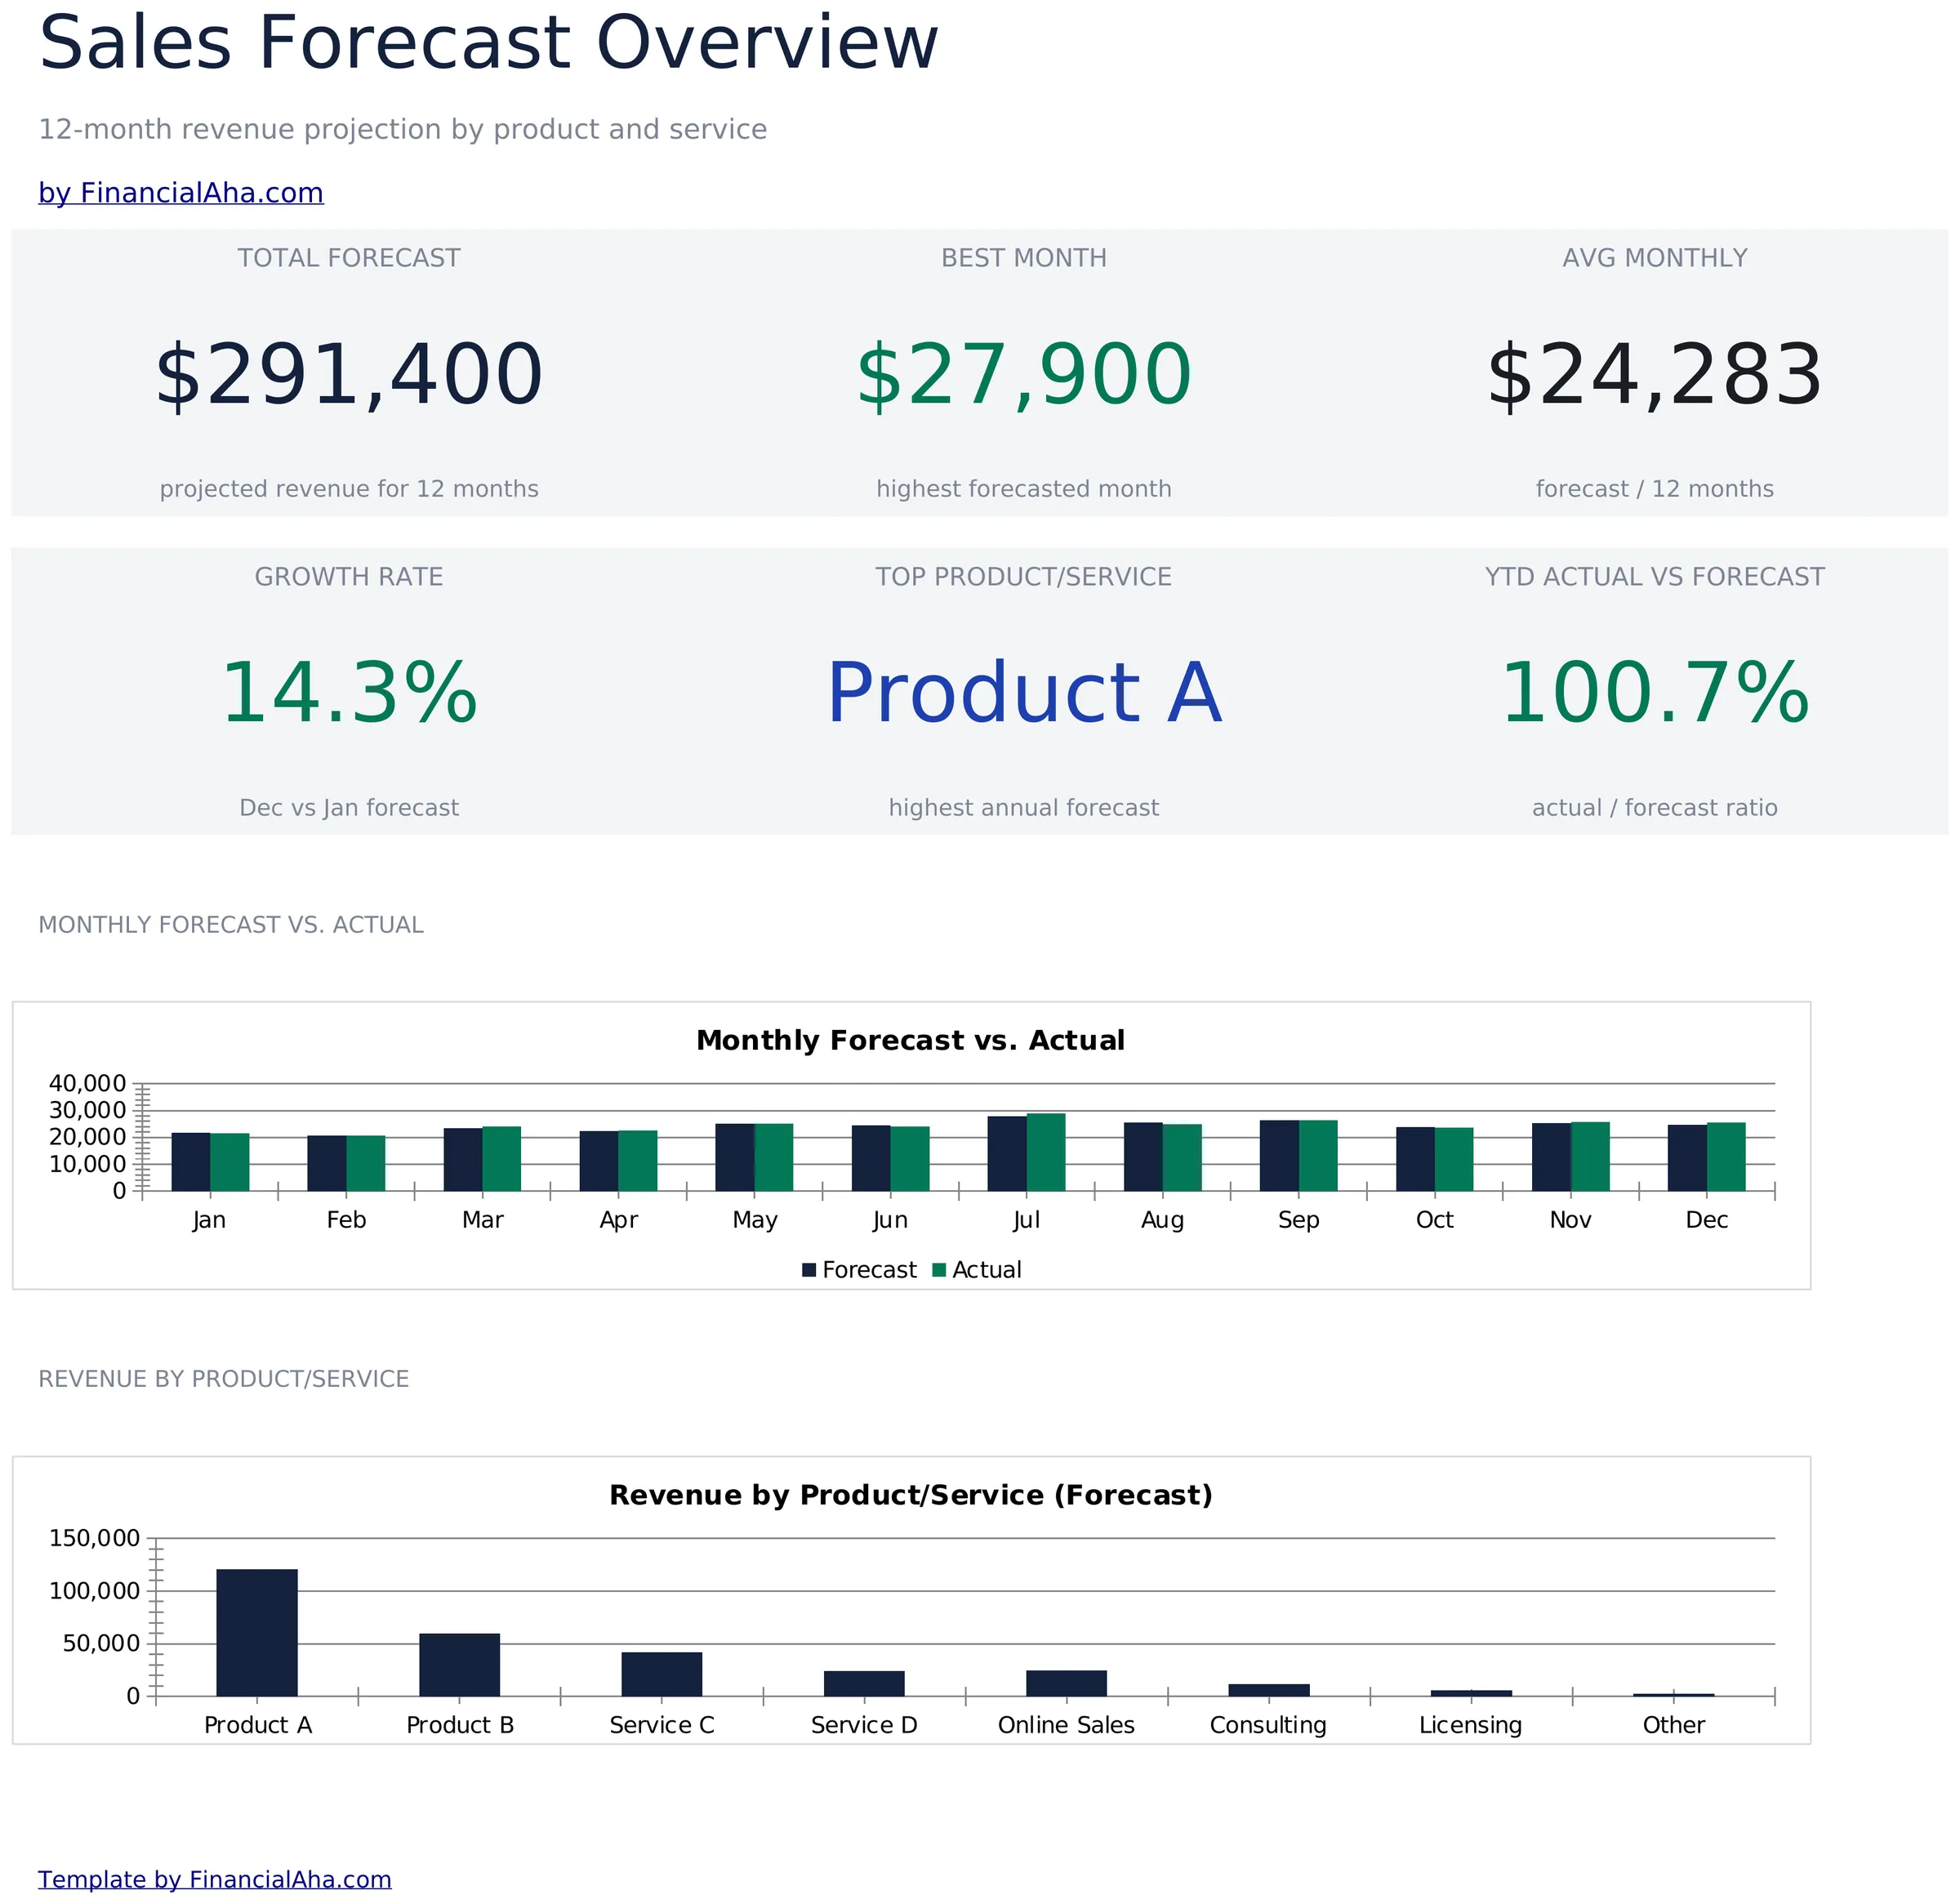
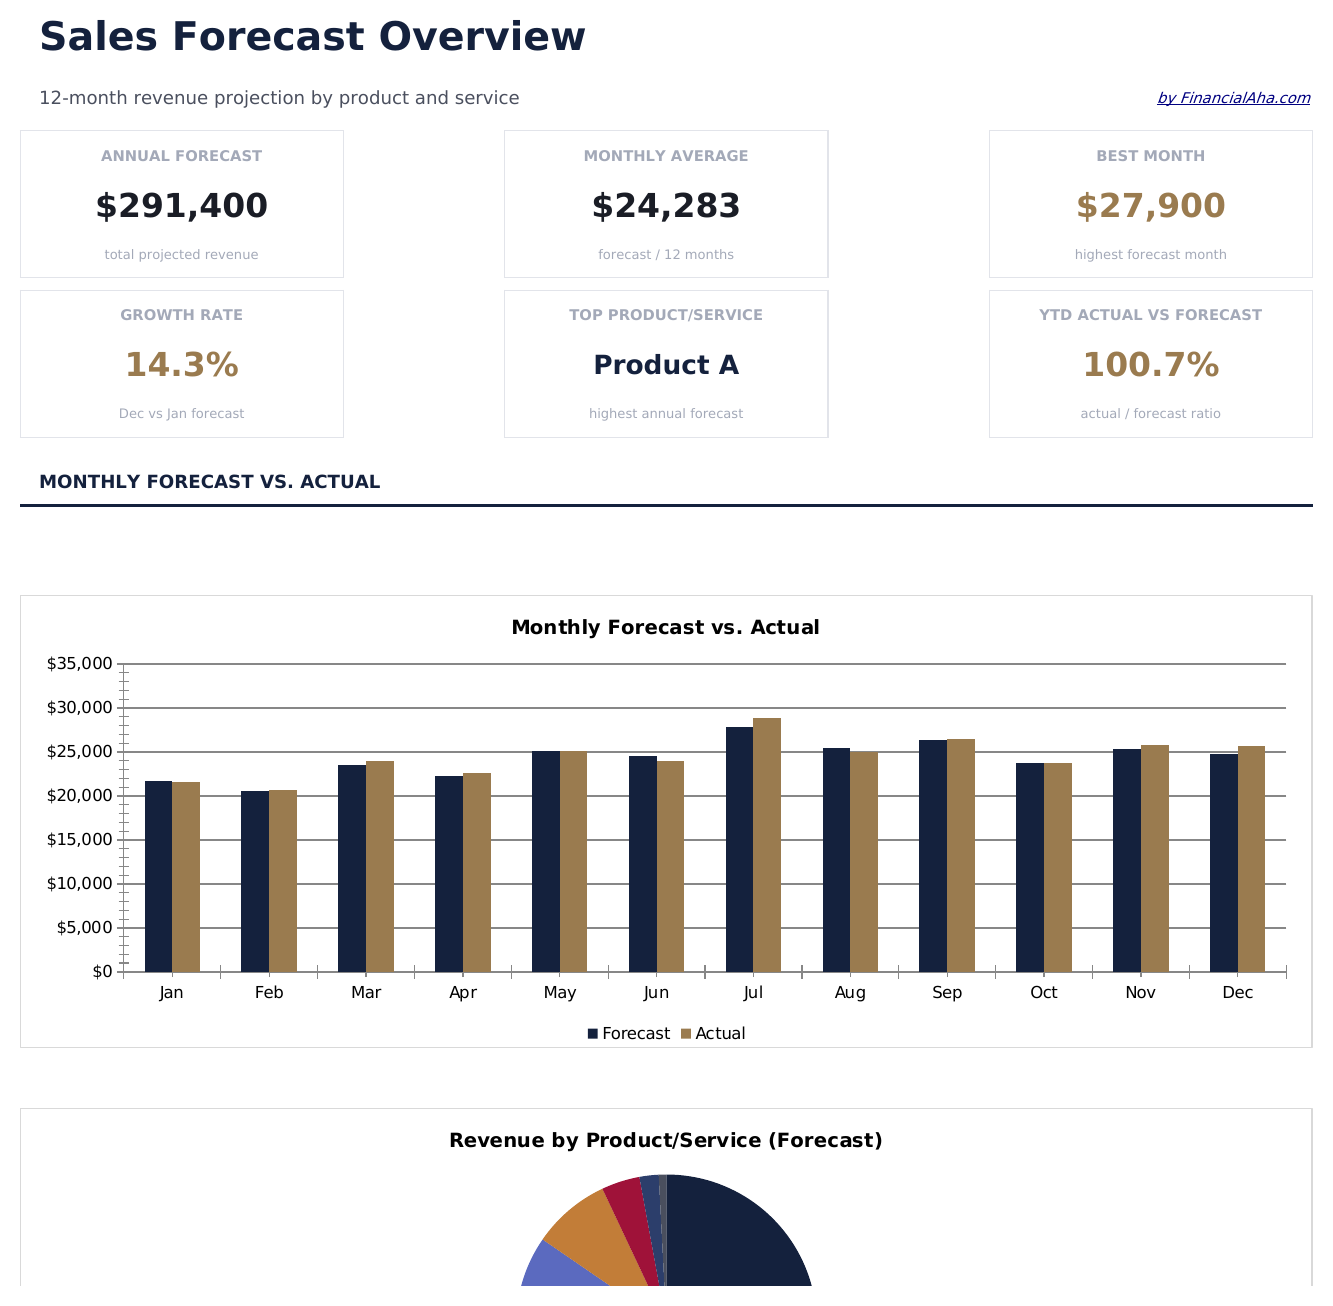
- Dashboard mit Zusammenfassung der Absatzprognose, das prognostizierten Gesamtumsatz, Wachstumsrate und fuehrende Produktlinien anzeigt
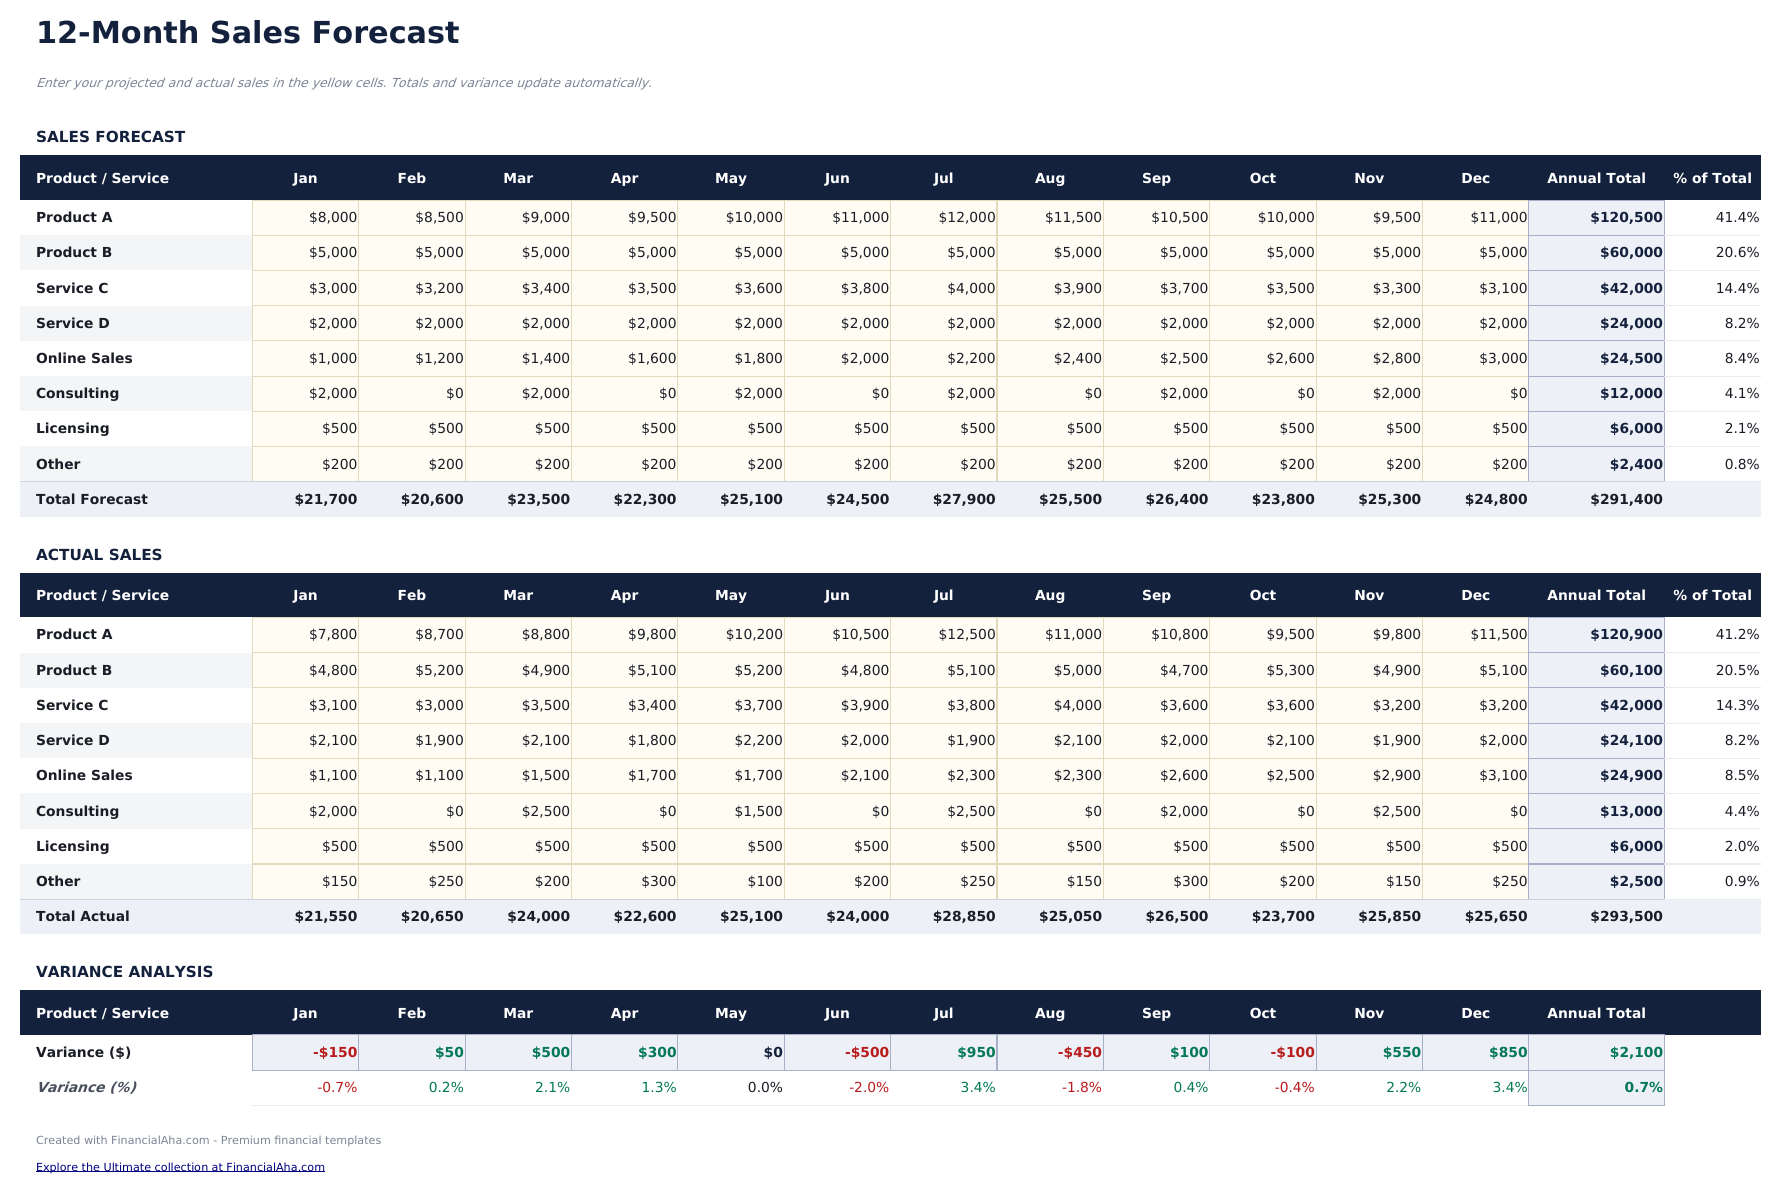
- Absatzprognose nach Produkt oder Kanal mit Absatzmenge, Durchschnittspreis und Gesamtumsatz pro Position
- Wachstumsratenannahmen mit einstellbaren Monat-ueber-Monat- oder Jahr-ueber-Jahr-Prozentsaetzen
- Monatliche und jaehrliche Prognosespalten, die Wachstumsraten auf Ausgangswerte ueber den Prognosezeitraum anwenden
- Soll-Ist-Vergleichsspalten mit farbcodierten Abweichungsindikatoren, die Ueber- oder Unterperformance hervorheben
- Funktioniert in Microsoft Excel, Google Sheets und LibreOffice Calc ohne Einrichtung
Need more from this template?
The Essentials version covers everyday tracking. Ultimate goes further with multi-entity support, scenario analysis, and ultimate-grade reporting.
- Dashboard mit Zusammenfassung der Absatzprognose, das prognostizierten Gesamtumsatz, Wachstumsrate und fuehrende Produktlinien anzeigt
- Absatzprognose nach Produkt oder Kanal mit Absatzmenge, Durchschnittspreis und Gesamtumsatz pro Position
- Wachstumsratenannahmen mit einstellbaren Monat-ueber-Monat- oder Jahr-ueber-Jahr-Prozentsaetzen
- Monatliche und jaehrliche Prognosespalten, die Wachstumsraten auf Ausgangswerte ueber den Prognosezeitraum anwenden
- Verfolgen Sie bis zu 50 aktive Deals mit Unternehmen, Kontakt, Dealgröße, Phase, Wahrscheinlichkeit, erwartetem Abschlussdatum und Verantwortlichem
- Dashboard mit 6 KPI-Karten: Pipeline-Gesamtwert, gewichtete Pipeline, Deals in Pipeline, durchschnittliche Dealgröße, Abschlussrate und Prognose diesen Monat
- Pipeline-Blatt mit phasenbasierter Wahrscheinlichkeitsgewichtung, das automatisch den gewichteten Prognosewert pro Deal berechnet
- Monatliches Prognoseblatt projiziert erwartete Buchungen nach Monat basierend auf Abschlussterminen und gewichteten Dealwerten
- Phasenanalyseblatt zeigt Dealanzahl, Gesamtwert, Durchschnittsgröße und gewichteten Wert pro Pipeline-Phase
Vorschau
Sehen Sie, was in dieser Vorlage enthalten ist
So verwenden Sie diese Absatzprognose-Vorlage
Produktlinien definieren
Listen Sie jedes Produkt, jede Dienstleistung oder jeden Umsatzkanal als separate Zeile mit Basisabsatzmenge und Durchschnittspreis auf.
Wachstumsannahmen festlegen
Geben Sie Monat-ueber-Monat- oder Jahr-ueber-Jahr-Wachstumsraten fuer jede Produktlinie ein. Die Vorlage wendet diese auf die Ausgangswerte an.
Prognosen ueberpruefen
Monatliche Spalten zeigen den prognostizierten Umsatz, der ueber den Prognosezeitraum basierend auf Ihren Mengen- und Preisannahmen waechst.
Mit Ist-Werten vergleichen
Wenn tatsaechliche Verkaeufe eingehen, geben Sie die Ist-Zahlen neben den Prognosen ein. Die Abweichungsspalte zeigt, wo die Leistung von der Prognose abweicht.
Customer Reviews
What Our Customers Say
"If I get half as good at handling my finances as you are at customer service, this'll be the best $26 I've spent lately."
"Great tool! Simplifies financial planning without the hassle of complex spreadsheets."
"I recently purchased your super convenient spreadsheet, it really helps me!"
"They're great and super intuitive. Thank you!"
Erstellt von Claude AI. Verfeinert von uns.
Wir verwenden Claude AI, um jede Vorlage nach gründlicher Recherche zu entwerfen. Dann greift unser Team ein. Wir verfeinern das Layout, testen jede Formel auf Herz und Nieren, beheben Grenzfälle und polieren das Design, bis es sich anfühlt wie etwas, das wir selbst verwenden würden. Die KI bringt uns 80 % ans Ziel. Die letzten 20 % sind rein menschliches Urteilsvermögen.
Häufig gestellte Fragen
Kann ich nach Kanal prognostizieren?
Ja. Verwenden Sie jede Zeile fuer einen anderen Vertriebskanal - Online, Einzelhandel, Grosshandel oder Direktvertrieb. Die Vorlage summiert ueber alle Kanaele.
Wie lege ich Wachstumsraten fest?
Geben Sie eine prozentuale Wachstumsrate pro Produktlinie ein. Die Vorlage wendet diese Rate auf die Verkaeufe des Vormonats an, um die Prognose fuer jeden Folgemonat zu erstellen.
Werden saisonale Anpassungen beruecksichtigt?
Sie koennen einzelne Monatsprognosen manuell hoeher oder niedriger anpassen, um saisonale Muster zusaetzlich zur Basiswachstumsrate zu beruecksichtigen.
Kann ich Prognose mit Ist-Werten vergleichen?
Ja. Soll-Ist-Vergleichsspalten mit Abweichungsindikatoren zeigen, ob die tatsaechlichen Verkaeufe vor oder hinter der Prognose liegen.
Wie öffne ich diese Vorlage in Google Sheets?
Laden Sie die .xlsx-Datei auf Google Drive hoch und öffnen Sie sie mit Google Sheets. Alle Formeln und Formatierungen bleiben erhalten.
Weitere Essentials-Vorlagen: Unternehmensfinanzen
Highlights:
Auf der Suche nach Premium-Tabellenvorlagen?
Unsere kostenpflichtigen Vorlagen umfassen erweiterte mehrseitige Dashboards, native Excel-Diagramme und laufende Aktualisierungen.
Holen Sie sich stattdessen jede Ultimate-Vorlage
Alle 58 Ultimate-Vorlagen in einem Kauf für $299 - $1,682 Wert, Sie behalten $1,383.