Huren vs Kopen Calculator Essentials-sjabloon
Vergelijk de financiele uitkomsten van huren versus kopen over een opgegeven periode. Houd rekening met waardevermeerdering, belastingimplicaties en opportuniteitskosten.
Wat zit erin
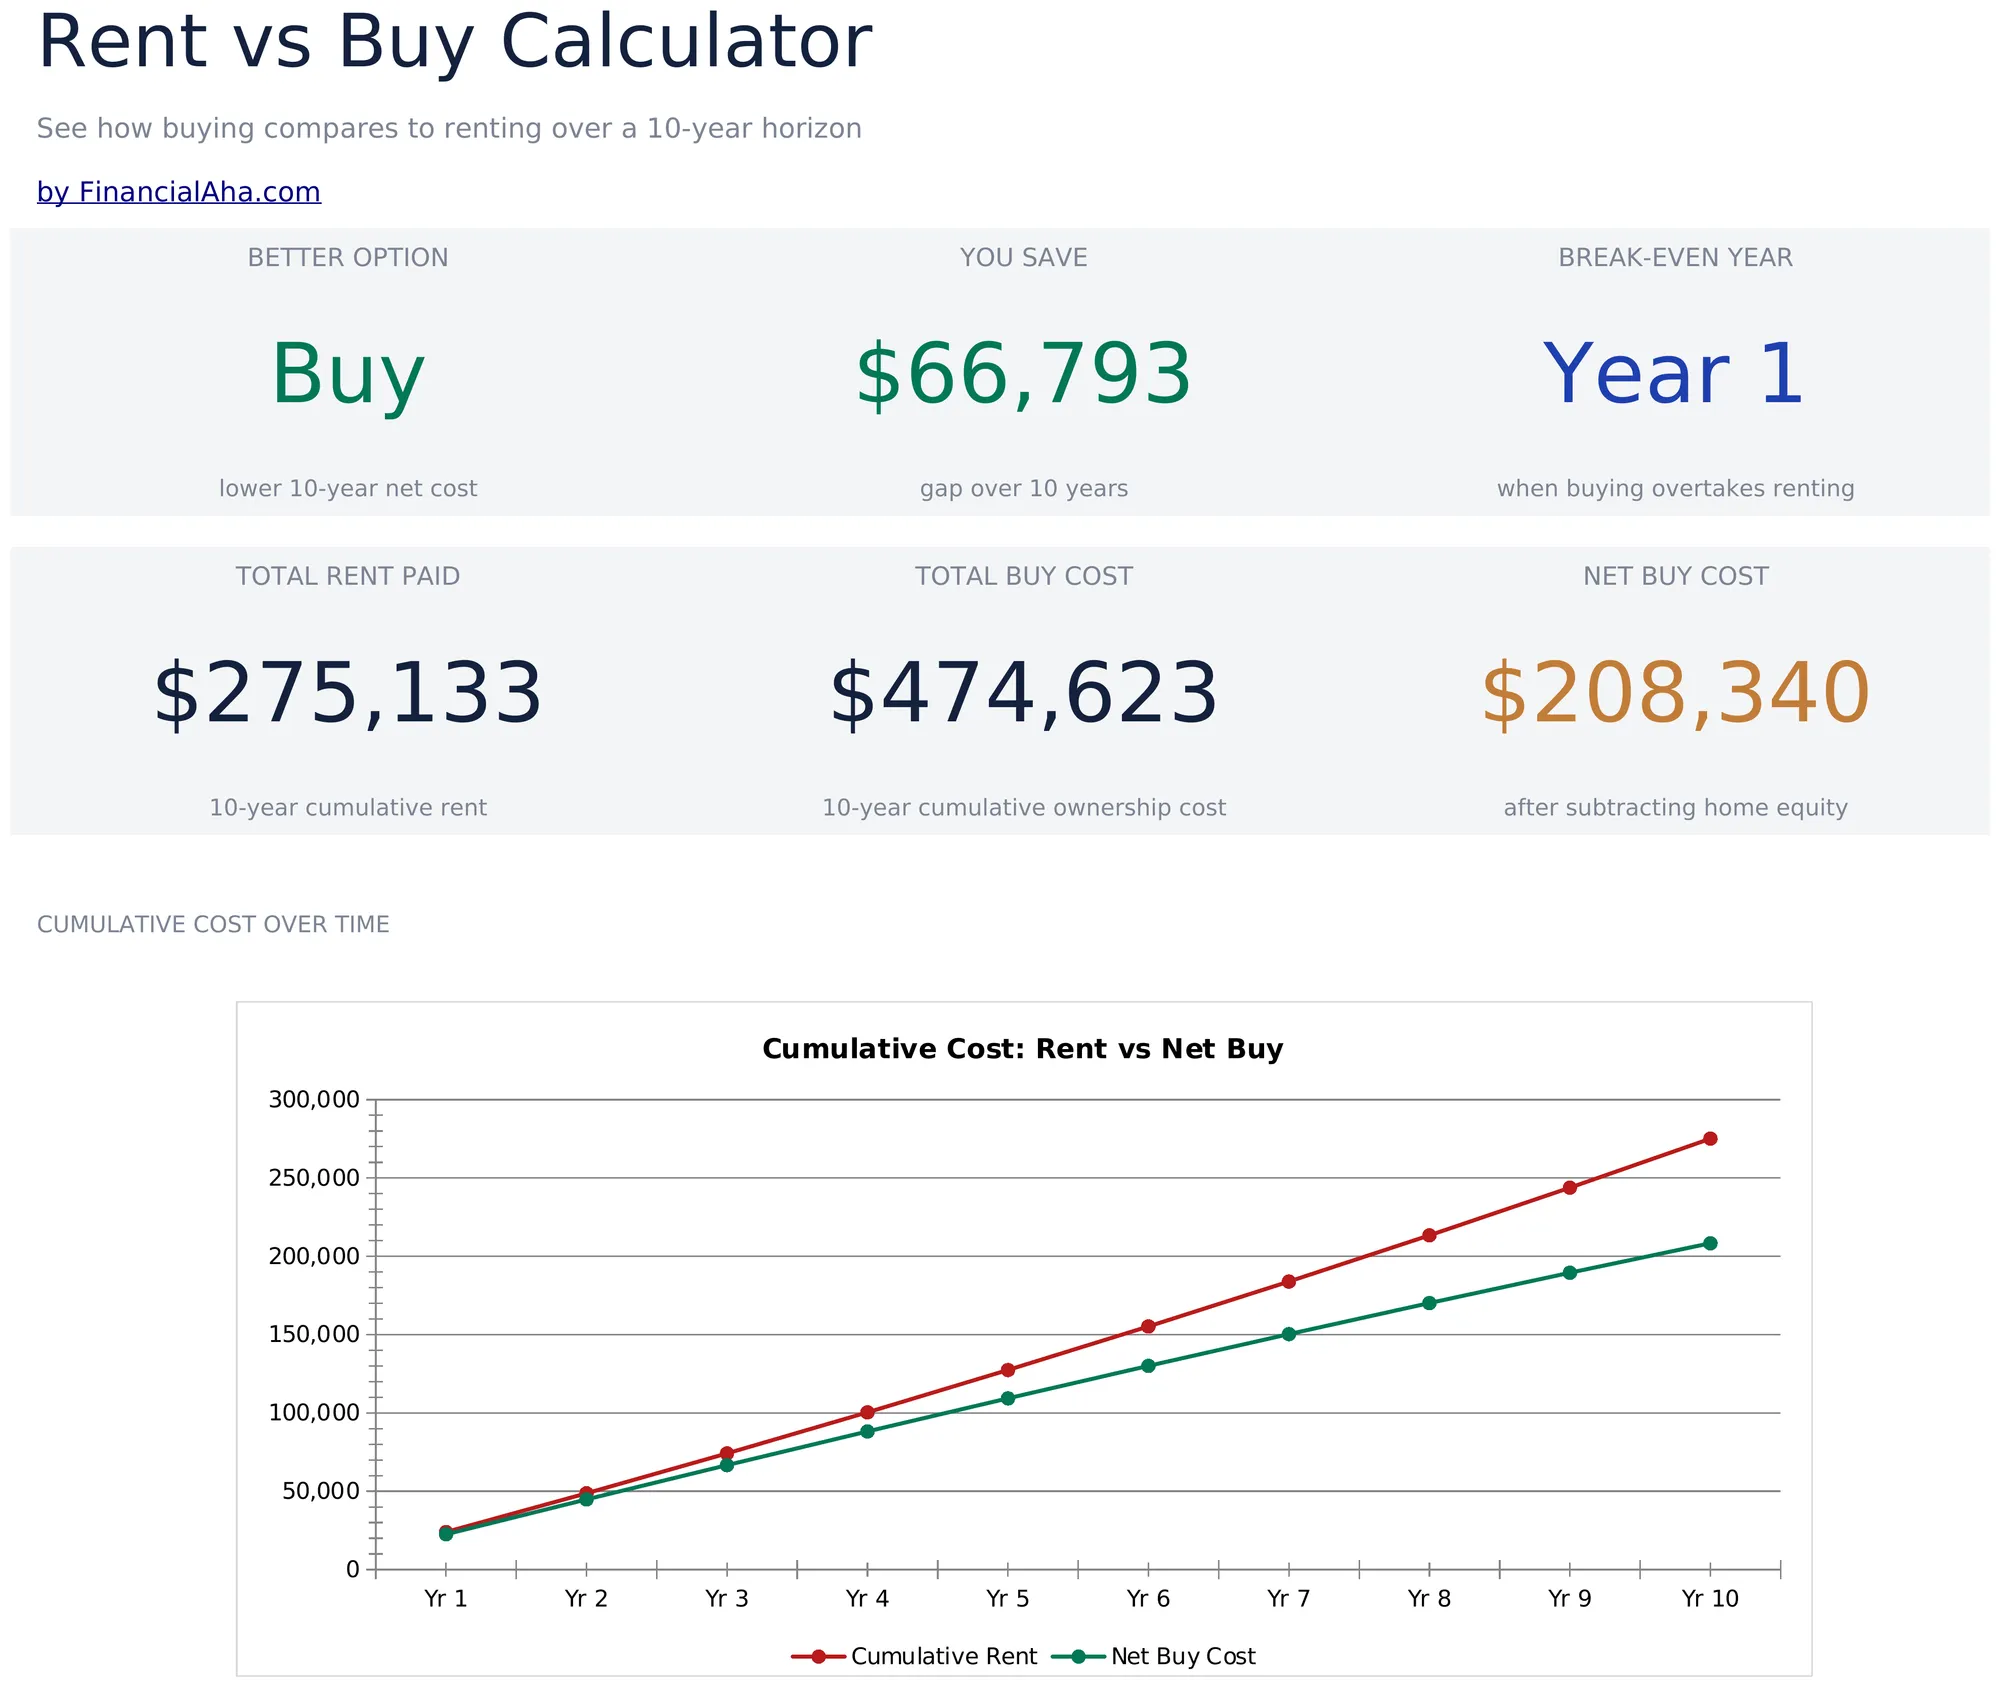
- Dashboard met huren-versus-kopen vergelijking inclusief totale kosten van huren, totale kosten van kopen en nettoverschil
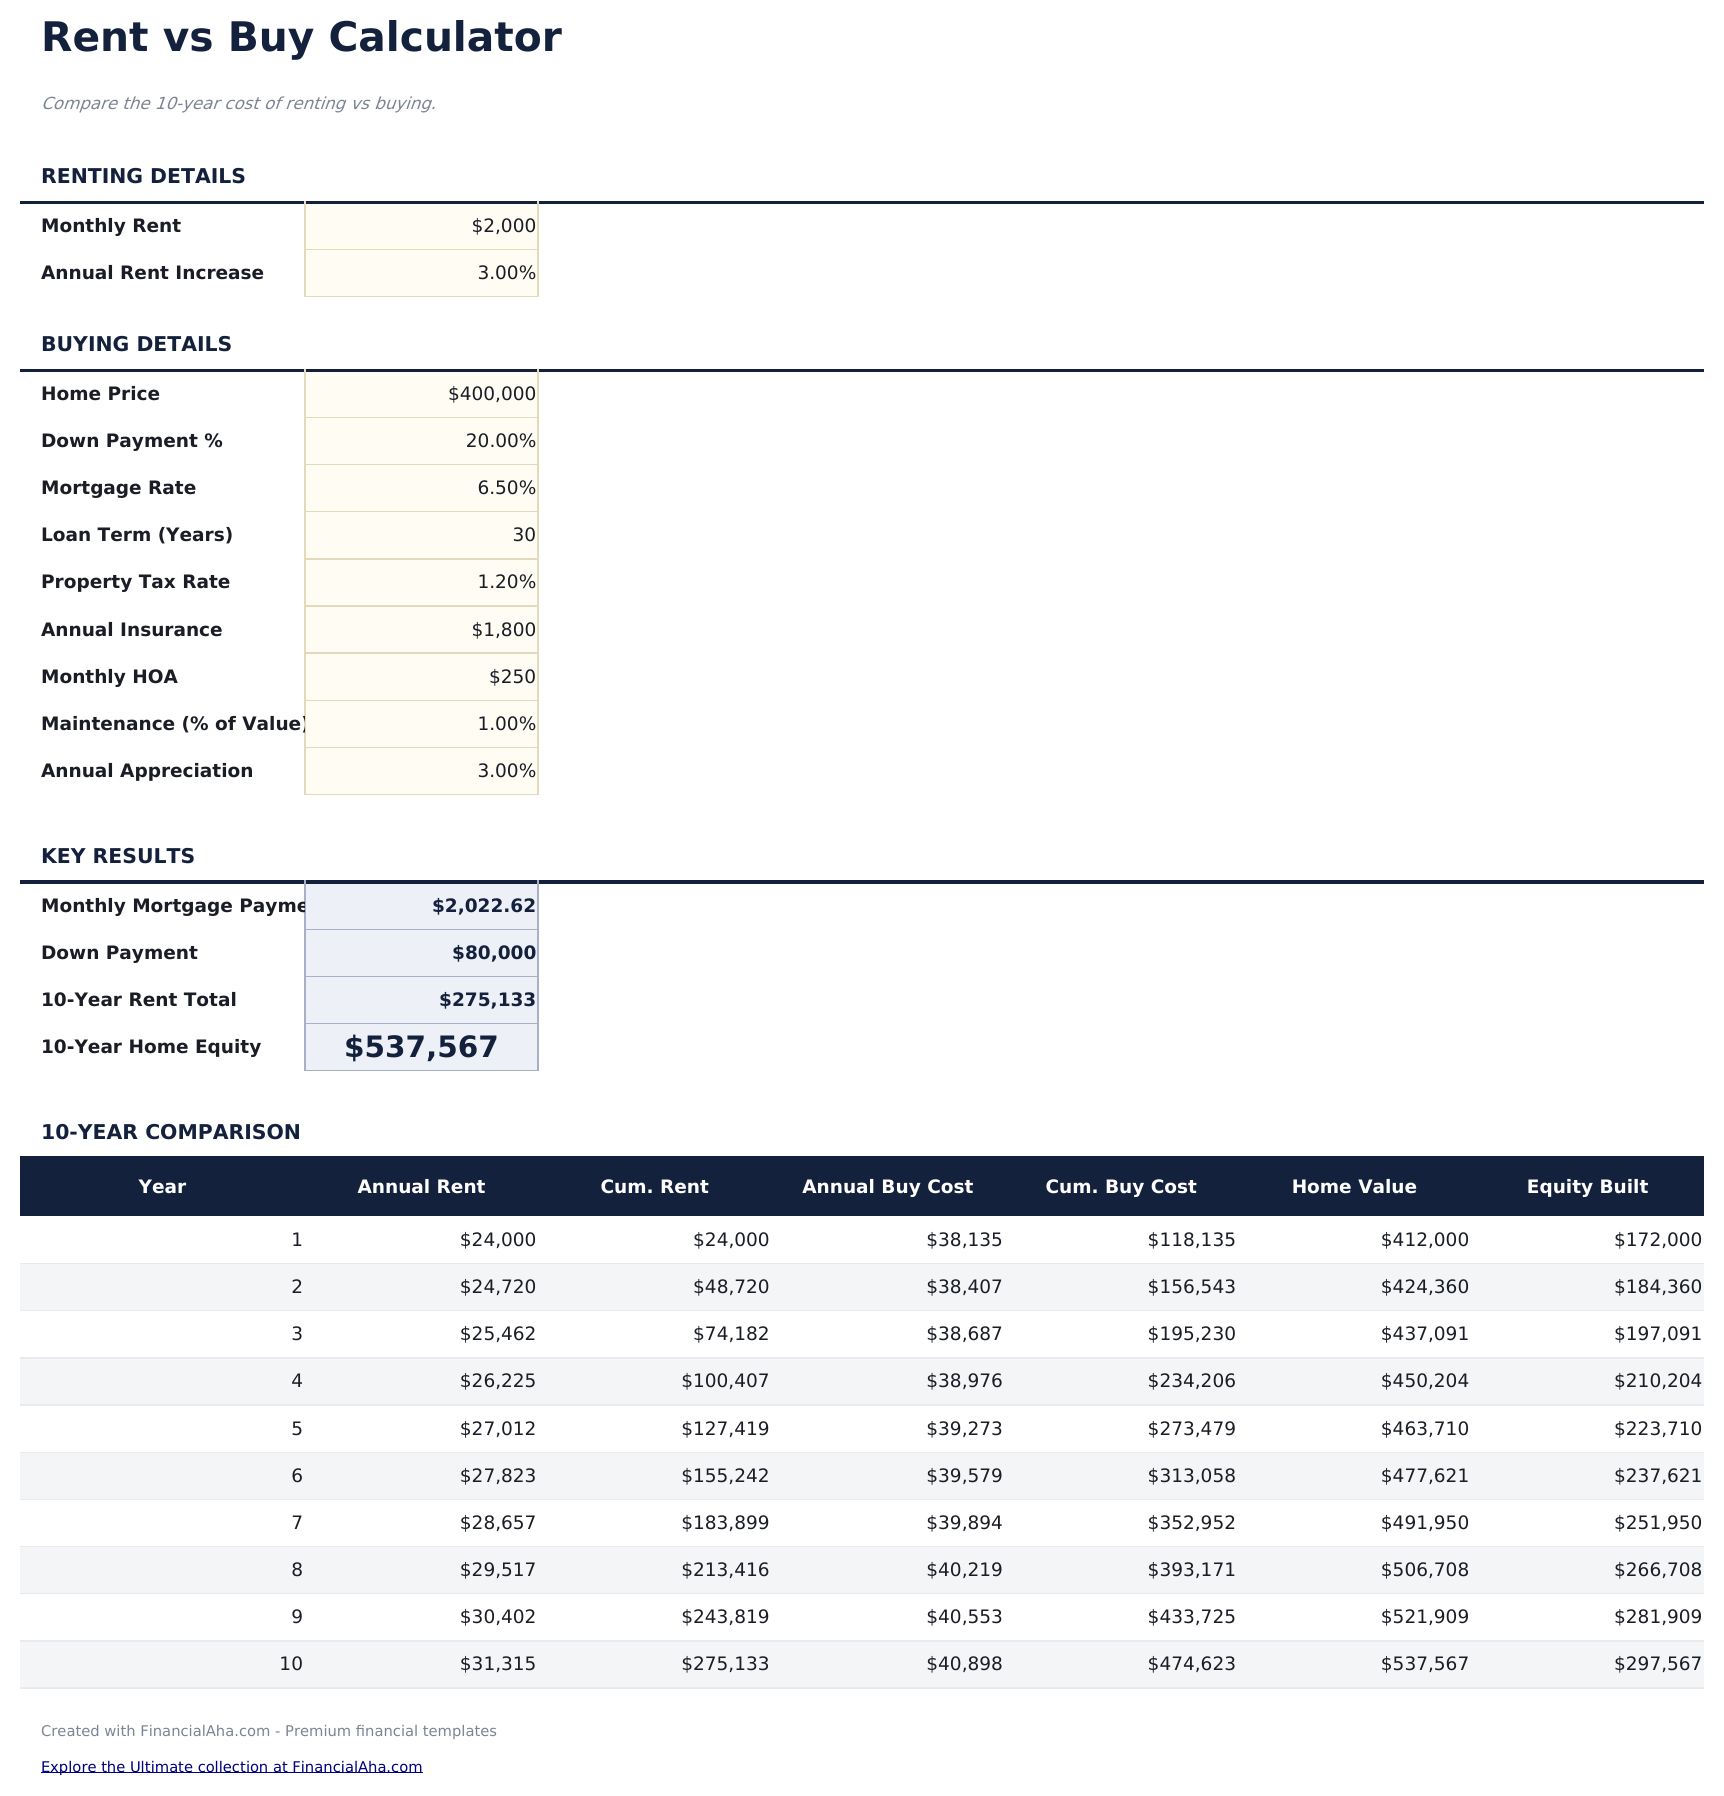
- Calculator met huurinvoer (maandelijkse huur, jaarlijkse verhoging) en koopinvoer (prijs, rentepercentage, aanbetaling)
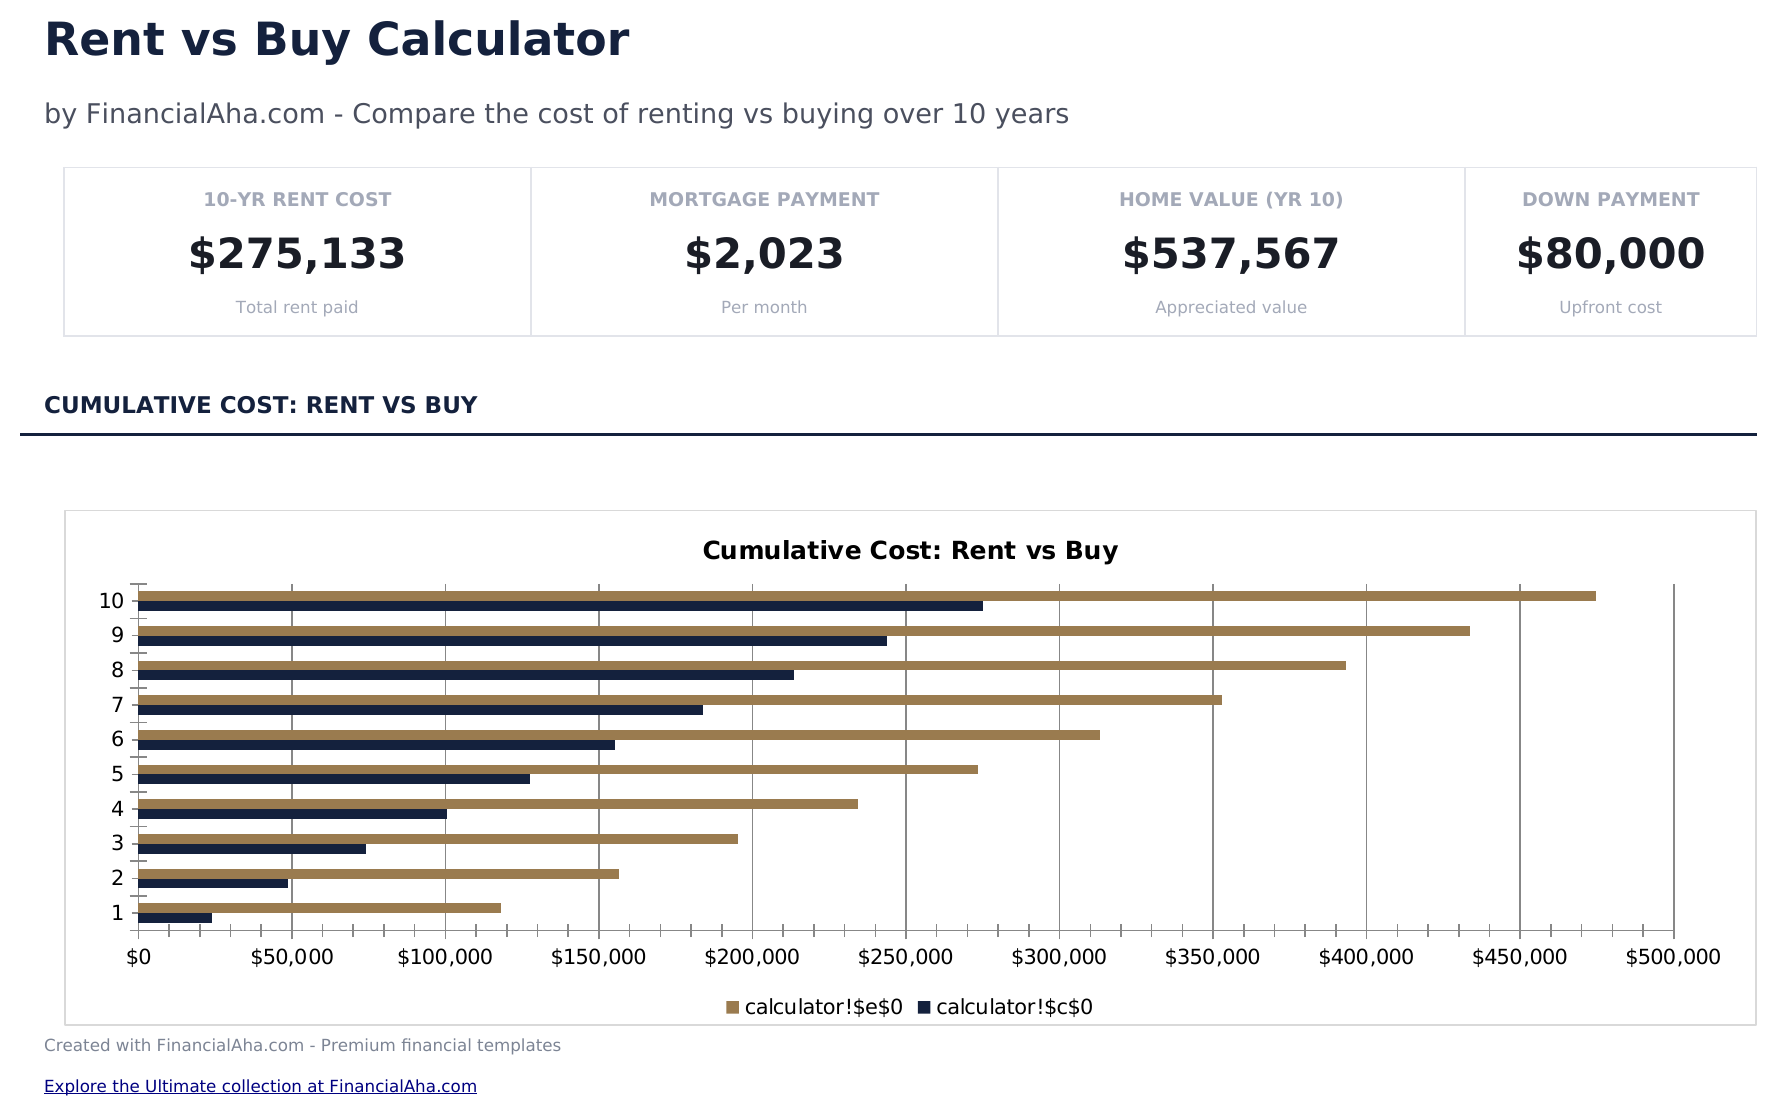
- Jaar-op-jaar kostenvergelijkingstabel met cumulatief betaalde huur versus cumulatieve woonlasten over de tijd
- Vermogensopbouw-tracking die toont hoeveel woningvermogen elk jaar wordt opgebouwd door hypotheekaflossingen
- Omslagpuntanalyse met kleurgecodeerde invoercellen die toont wanneer kopen goedkoper wordt dan huren
- Werkt in Microsoft Excel, Google Sheets en LibreOffice Calc zonder installatie
Need more from this template?
The Essentials version covers everyday tracking. Ultimate goes further with multi-entity support, scenario analysis, and ultimate-grade reporting.
- Dashboard met huren-versus-kopen vergelijking inclusief totale kosten van huren, totale kosten van kopen en nettoverschil
- Calculator met huurinvoer (maandelijkse huur, jaarlijkse verhoging) en koopinvoer (prijs, rentepercentage, aanbetaling)
- Jaar-op-jaar kostenvergelijkingstabel met cumulatief betaalde huur versus cumulatieve woonlasten over de tijd
- Vermogensopbouw-tracking die toont hoeveel woningvermogen elk jaar wordt opgebouwd door hypotheekaflossingen
- Uitgebreid werkblad aannames met aankoopprijs, aanbetaling, hypotheekrente, onroerendezaakbelasting, VvE, onderhoud, woningwaardestijging, huur, huurstijging en beleggingsrendement
- Dashboard met 6 KPI-kaarten: break-evenjaar, 10-jaars koopkosten, 10-jaars huurkosten, netto koopvoordeel, maandelijkse betaling versus huur en vereiste aanbetaling
- Jaar-voor-jaar vergelijkingstabel met cumulatieve kosten voor kopen versus huren over 10 jaar met nettoverschil per jaar
- Break-evenanalyse die het exacte jaar identificeert waarin kopen goedkoper wordt dan huren op cumulatieve basis
- Gevoeligheidsanalyseraster met break-evenjaar bij 5 woningwaardestijgingspercentages gekruist met 5 hypotheektarieven (25 combinaties)
Voorbeeld
Bekijk wat er in dit sjabloon zit
Hoe gebruik je dit Huren vs Kopen Calculator sjabloon
Vul huurgegevens in
Voer de huidige maandelijkse huur en verwacht jaarlijks huurverhogingspercentage in voor de vergelijkingsperiode.
Vul koopgegevens in
Voeg de woningprijs, aanbetaling, hypotheekpercentage, onroerendezaakbelasting, verzekering en onderhoudsschattingen toe.
Stel de tijdshorizon in
Voer het aantal jaren voor de vergelijking in. Resultaten veranderen aanzienlijk bij verschillende bezitsperioden.
Vergelijk de resultaten
Het dashboard toont totale kosten van huren versus totale kosten van kopen, opgebouwd vermogen en het omslagpuntjaar.
Customer Reviews
What Our Customers Say
"If I get half as good at handling my finances as you are at customer service, this'll be the best $26 I've spent lately."
"Great tool! Simplifies financial planning without the hassle of complex spreadsheets."
"I recently purchased your super convenient spreadsheet, it really helps me!"
"They're great and super intuitive. Thank you!"
Gebouwd door Claude AI. Verfijnd door ons.
We gebruiken Claude AI om elk sjabloon te ontwerpen, na uitgebreid onderzoek. Daarna neemt ons team het over. We verfijnen de indeling, testen elke formule grondig, lossen randgevallen op en polijsten het ontwerp totdat het iets is dat we zelf ook echt zouden gebruiken. De AI brengt ons 80% van de weg. De laatste 20% is puur menselijk oordeel.
Veelgestelde vragen
Welke kosten zijn opgenomen aan de koopkant?
Hypotheekbetalingen, onroerendezaakbelasting, verzekering, onderhoud, VvE-bijdragen en opportuniteitskosten van de aanbetaling. Vermogensopbouw wordt als krediet meegenomen.
Houdt het rekening met woningwaardestijging?
Ja. Voer een verwacht jaarlijks waardevermeerderingspercentage in. De calculator neemt waardestijging van het vastgoed mee bij het berekenen van de nettokosten van kopen.
Wat zijn opportuniteitskosten van de aanbetaling?
Als de aanbetaling belegd zou worden in plaats van gebruikt voor een woningaankoop, zou het rendement opleveren. De calculator houdt rekening met dit misgelopen beleggingsrendement.
Wanneer bereikt kopen doorgaans het omslagpunt?
Dit varieert sterk per markt en invoer. De omslagpuntanalyse toont het specifieke jaar waarin cumulatieve koopkosten lager worden dan cumulatieve huurkosten voor jouw scenario.
Hoe open ik dit in Google Sheets?
Upload het .xlsx-bestand naar Google Drive en open het vervolgens met Google Sheets. Alle formules en opmaak blijven behouden.
Meer Essentials-sjablonen voor Hypotheek & Woning
Hoogtepunten:
Op zoek naar premium spreadsheet-sjablonen?
Onze betaalde sjablonen bevatten geavanceerde dashboards met meerdere werkbladen, ingebouwde Excel-grafieken en doorlopende updates.
Krijg in plaats daarvan elk Ultimate sjabloon
Alle 58 Ultimate sjablonen in één aankoop voor $299 - $1,102 waarde, u houdt $803 over.