Calculadora de Alquilar vs Comprar Plantilla Essentials
Compara los resultados financieros de alquilar versus comprar durante un periodo especificado. Incluye apreciacion, implicaciones fiscales y costo de oportunidad.
Qué incluye
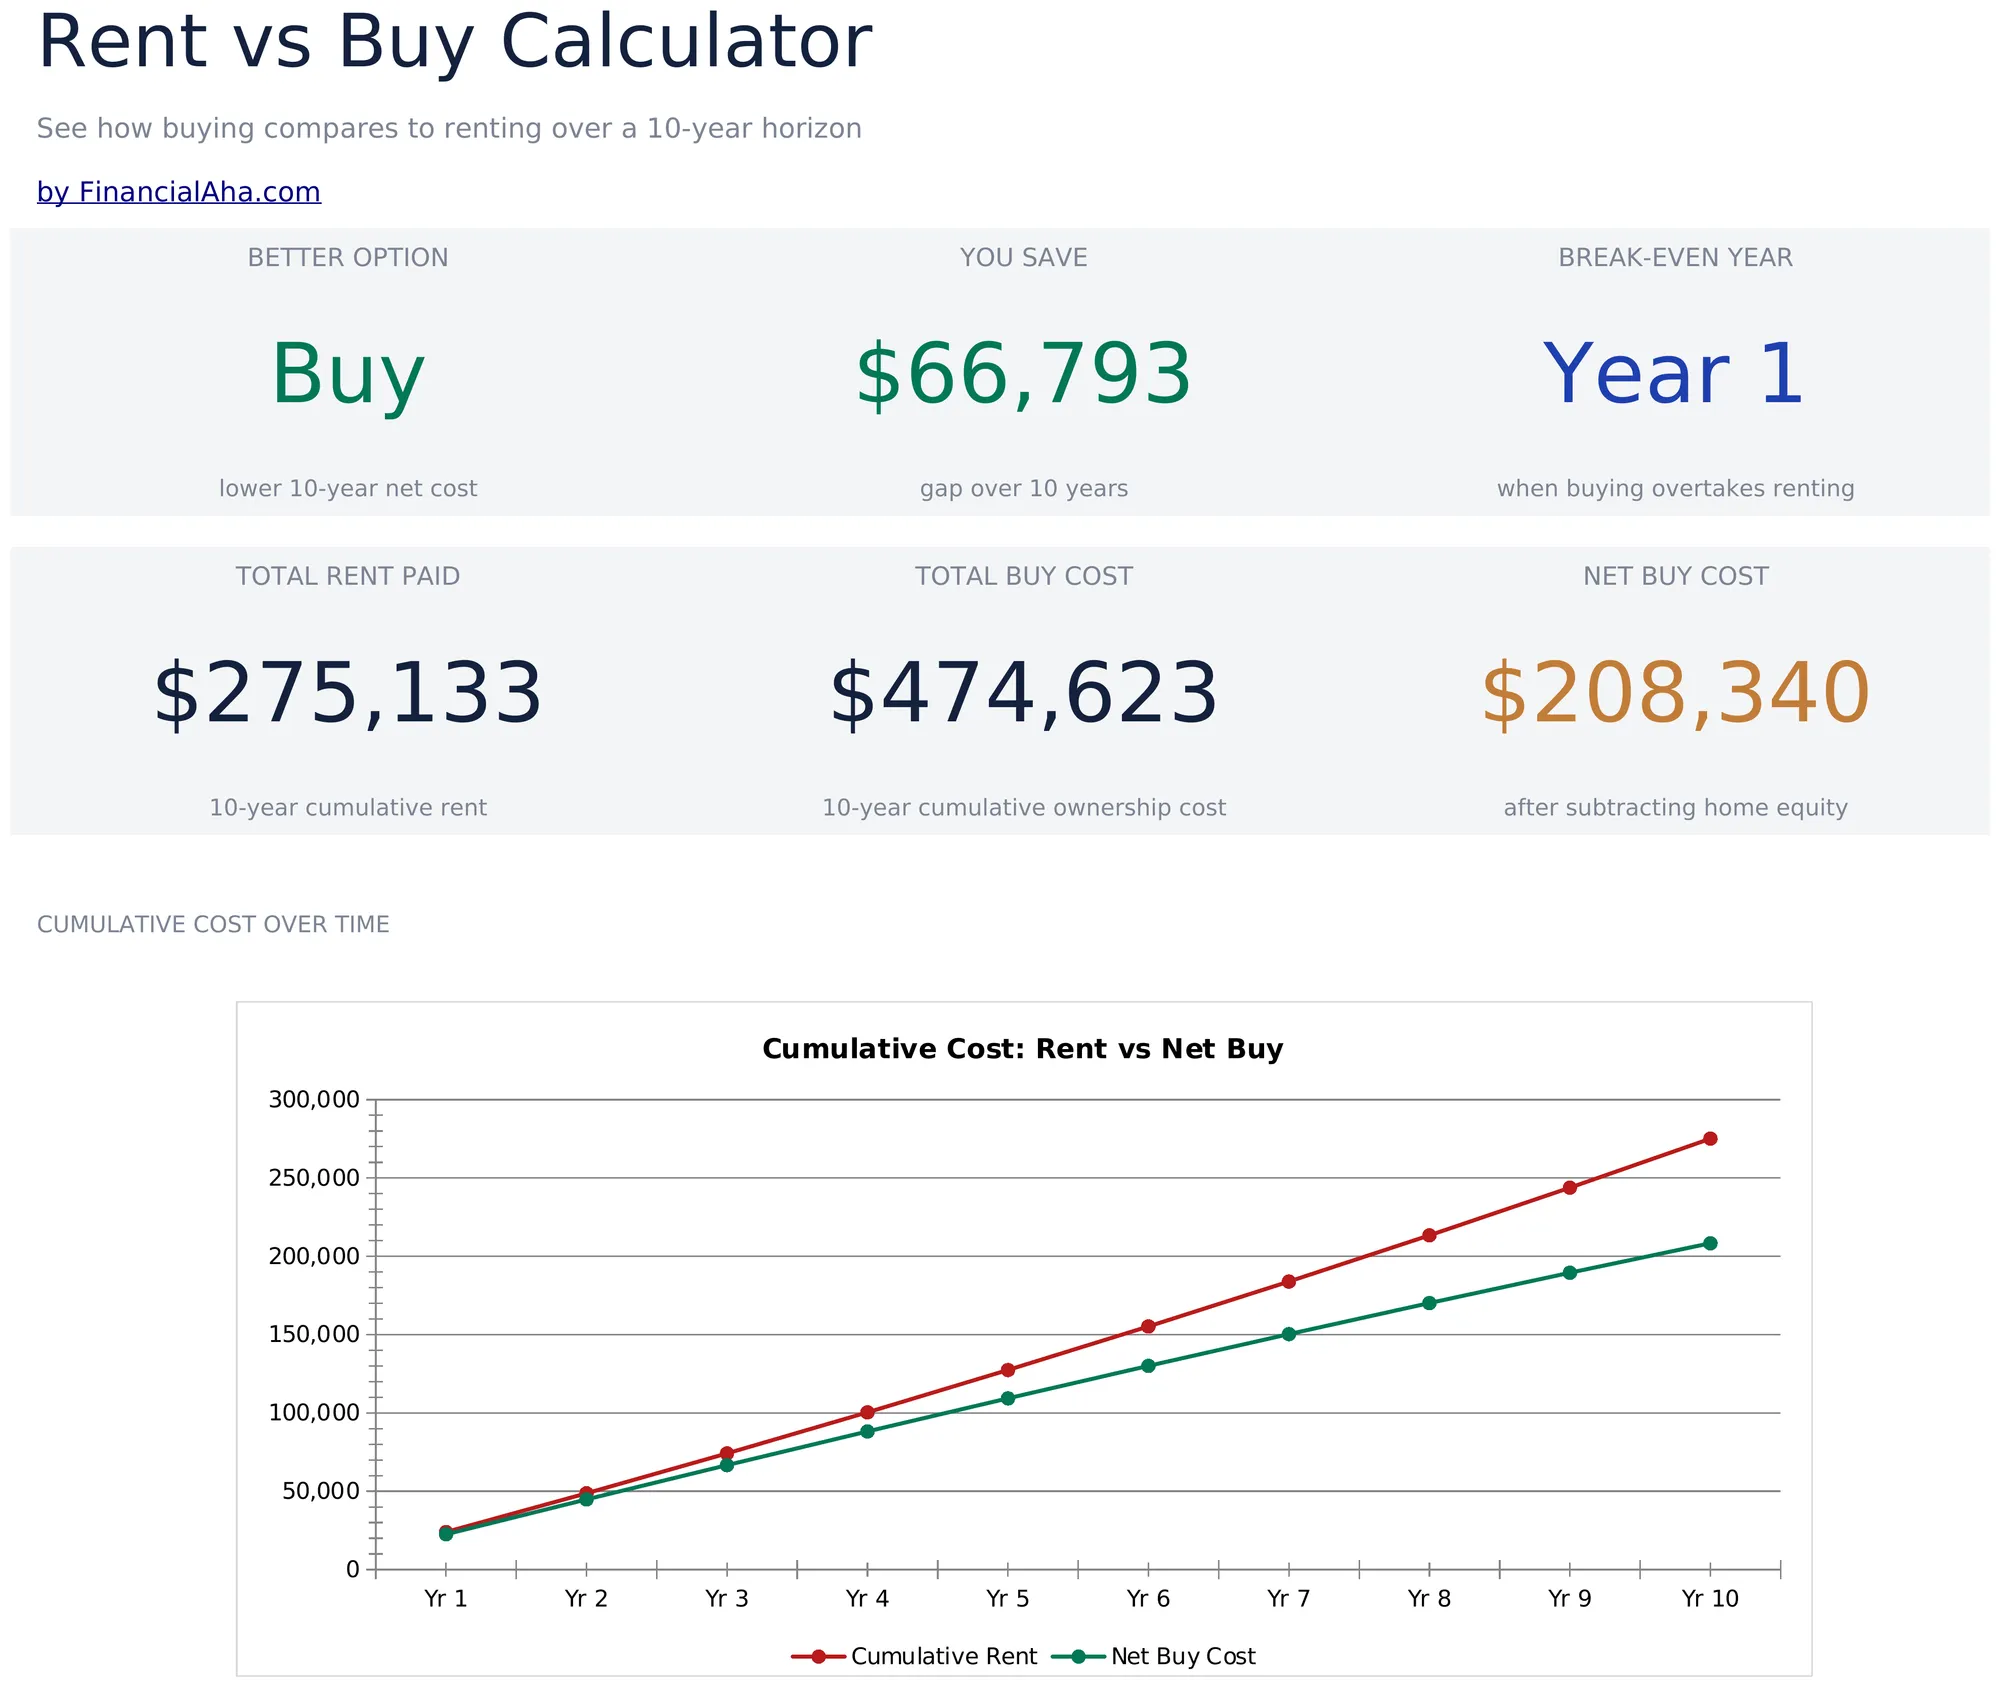
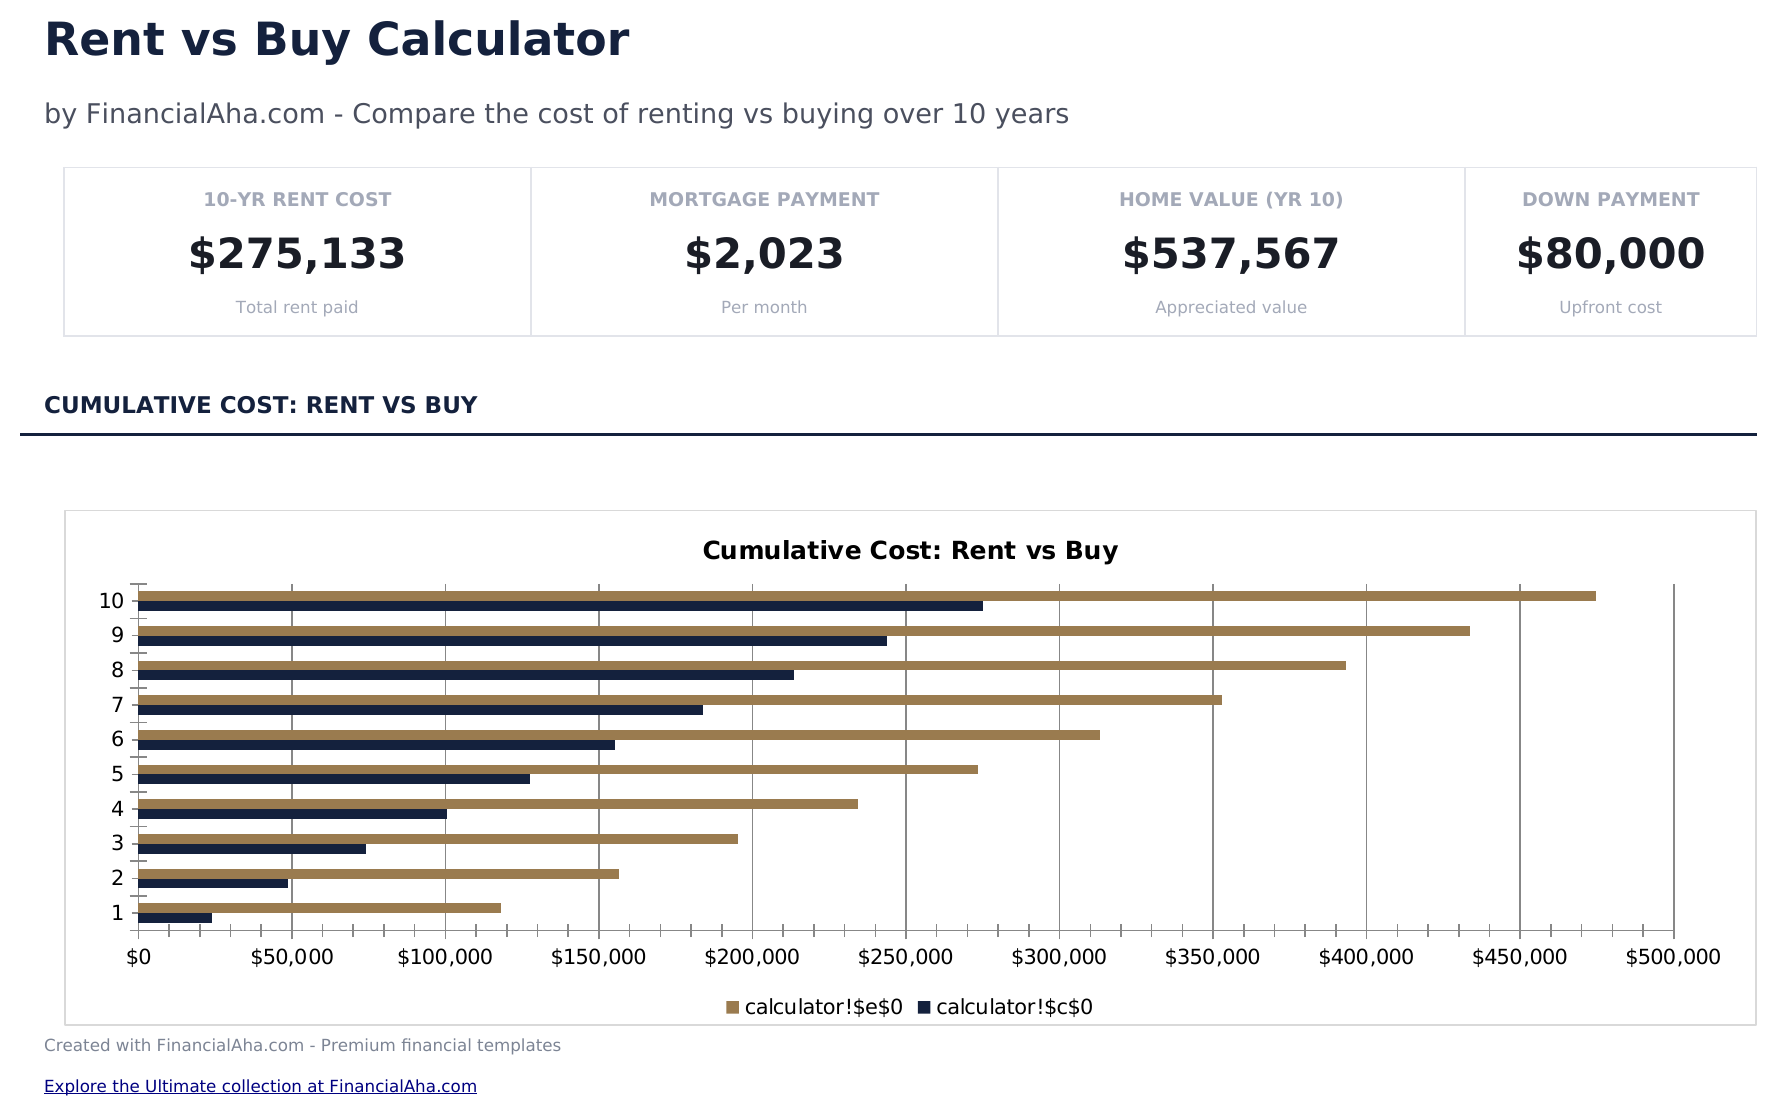
- Panel con comparacion alquilar vs comprar mostrando costo total de alquilar, costo total de comprar y diferencia neta
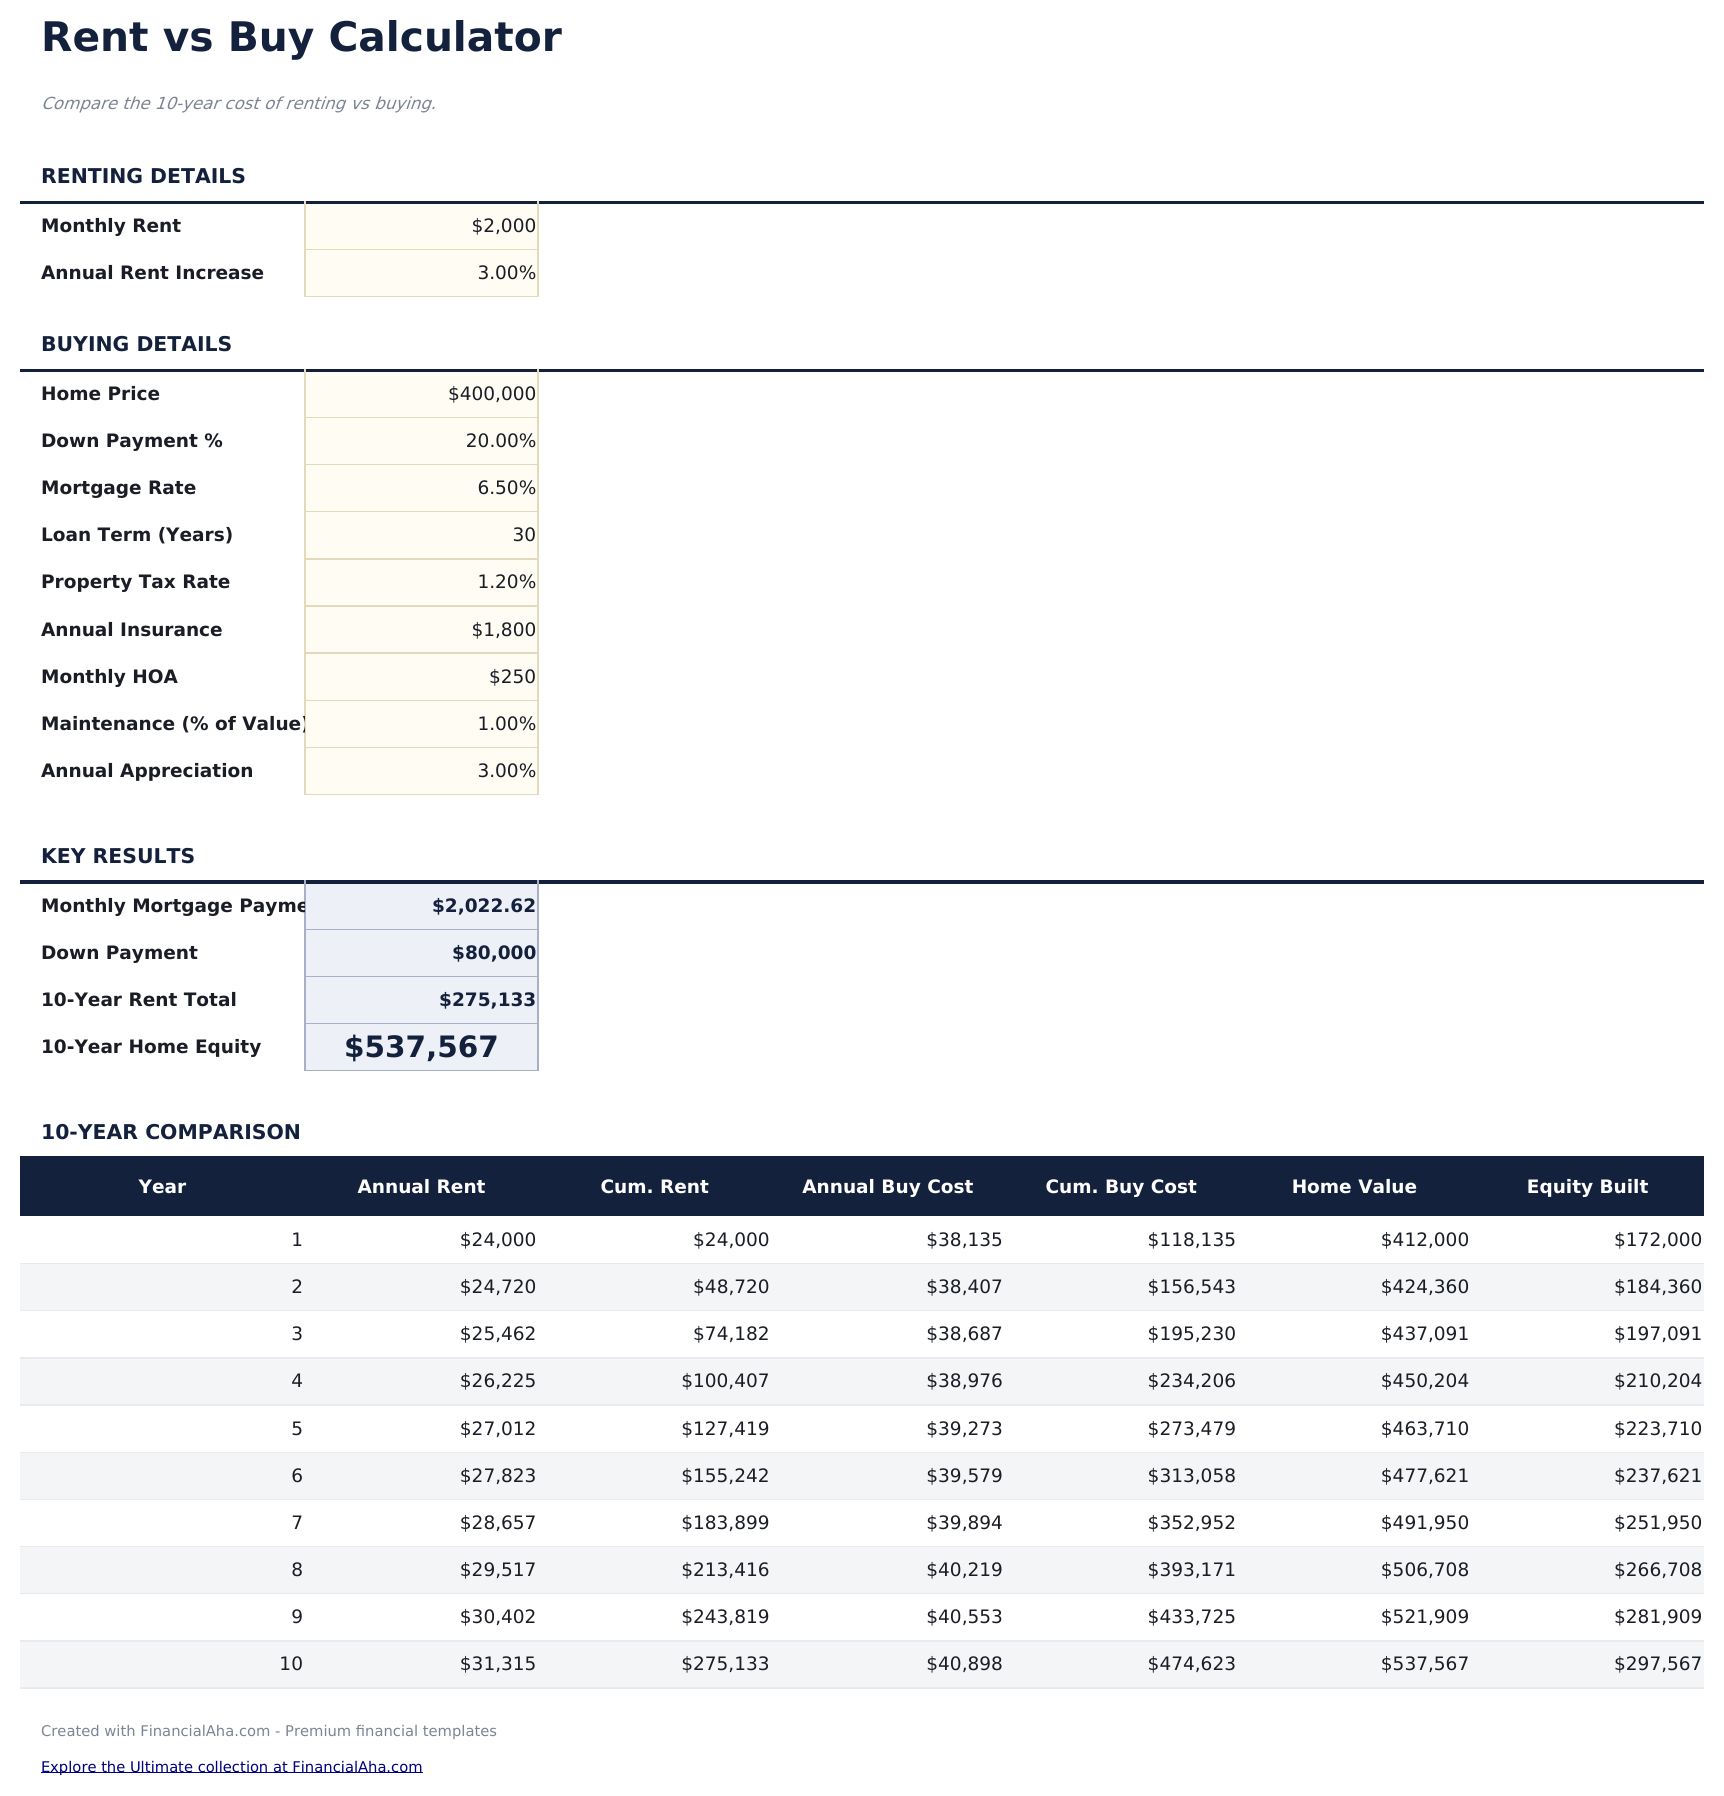
- Calculadora con datos de alquiler (renta mensual, aumento anual) y datos de compra (precio, tasa, enganche)
- Tabla de comparacion de costos ano por ano mostrando alquiler acumulado pagado vs costos acumulados de propiedad en el tiempo
- Seguimiento de acumulacion de capital mostrando cuanto capital inmobiliario se gana cada ano a traves de pagos de capital hipotecario
- Analisis de punto de equilibrio con celdas de entrada con codigo de colores mostrando cuando comprar se vuelve menos costoso que alquilar
- Funciona en Microsoft Excel, Google Sheets y LibreOffice Calc sin necesidad de configuracion
Need more from this template?
The Essentials version covers everyday tracking. Ultimate goes further with multi-entity support, scenario analysis, and ultimate-grade reporting.
- Panel con comparacion alquilar vs comprar mostrando costo total de alquilar, costo total de comprar y diferencia neta
- Calculadora con datos de alquiler (renta mensual, aumento anual) y datos de compra (precio, tasa, enganche)
- Tabla de comparacion de costos ano por ano mostrando alquiler acumulado pagado vs costos acumulados de propiedad en el tiempo
- Seguimiento de acumulacion de capital mostrando cuanto capital inmobiliario se gana cada ano a traves de pagos de capital hipotecario
- Hoja de supuestos completa que cubre precio de compra, enganche, tasa hipotecaria, tasa de impuesto predial, HOA, mantenimiento, apreciacion de la vivienda, alquiler, crecimiento del alquiler y rendimiento de inversiones
- Panel con 6 tarjetas de indicadores: ano de equilibrio, costo de compra a 10 anos, costo de alquiler a 10 anos, ventaja neta de comprar, pago mensual vs alquiler y enganche requerido
- Tabla comparativa ano por ano que muestra los costos acumulados de comprar vs alquilar durante 10 anos con la diferencia neta cada ano
- Analisis de punto de equilibrio que identifica el ano exacto en que comprar se vuelve mas economico que alquilar en base acumulada
- Cuadricula de analisis de sensibilidad que muestra el ano de equilibrio en 5 tasas de apreciacion cruzadas con 5 tasas hipotecarias (25 combinaciones)
Vista previa
Mira qué contiene esta plantilla
Cómo usar esta plantilla de Calculadora de Alquilar vs Comprar
Ingresa los detalles de alquiler
Introduce la renta mensual actual y el porcentaje de aumento anual esperado para el periodo de comparacion.
Ingresa los detalles de compra
Agrega el precio de la vivienda, enganche, tasa hipotecaria, impuestos a la propiedad, seguro y estimaciones de mantenimiento.
Establece el horizonte temporal
Ingresa el numero de anos para la comparacion. Los resultados cambian significativamente en diferentes periodos de tenencia.
Compara los resultados
El panel muestra el costo total de alquilar vs el costo total de comprar, capital acumulado y el ano de punto de equilibrio.
Customer Reviews
What Our Customers Say
"If I get half as good at handling my finances as you are at customer service, this'll be the best $26 I've spent lately."
"Great tool! Simplifies financial planning without the hassle of complex spreadsheets."
"I recently purchased your super convenient spreadsheet, it really helps me!"
"They're great and super intuitive. Thank you!"
Creadas por Claude AI. Perfeccionadas por nosotros.
Usamos Claude AI para crear el borrador de cada plantilla, después de una investigación profunda. Luego nuestro equipo interviene. Refinamos el diseño, probamos cada fórmula a fondo, corregimos casos especiales y pulimos el diseño hasta que se siente como algo que realmente usaríamos nosotros mismos. La IA nos lleva al 80%. El último 20% es criterio humano.
Preguntas frecuentes
Que costos se incluyen en el lado de compra?
Pagos hipotecarios, impuestos a la propiedad, seguro, mantenimiento, cuotas de HOA y costo de oportunidad del enganche. La acumulacion de capital se considera como un credito.
Tiene en cuenta la apreciacion de la vivienda?
Si. Ingresa una tasa de apreciacion anual esperada. La calculadora incluye el crecimiento del valor de la propiedad al calcular el costo neto de compra.
Que es el costo de oportunidad del enganche?
Si el enganche se invirtiera en lugar de usarse para la compra de una vivienda, generaria rendimientos. La calculadora toma en cuenta este crecimiento de inversion no realizado.
Cuando suele alcanzarse el punto de equilibrio al comprar?
Varia ampliamente segun el mercado y los datos. El analisis de punto de equilibrio muestra el ano especifico en que los costos acumulados de compra se vuelven menores que los costos acumulados de alquiler para tu escenario.
¿Cómo abro esto en Google Sheets?
Sube el archivo .xlsx a Google Drive y luego ábrelo con Google Sheets. Todas las fórmulas y el formato se conservarán.
Más plantillas Essentials de Hipoteca y Hogar
Destacados:
¿Buscas plantillas premium?
Nuestras plantillas de pago incluyen paneles avanzados con múltiples hojas, gráficos nativos de Excel y actualizaciones continuas.
Mejor obtenga todas las plantillas Ultimate
Las 58 plantillas Ultimate en una sola compra por $299 - valor de $1,102, usted se queda con $803.