Huurvastgoed Kasstroom Essentials-sjabloon
Volg huurinkomsten en uitgaven voor beleggingsvastgoed. Bereken netto kasstroom, cap rate en rendementscijfers voor verhuurders.
Wat zit erin
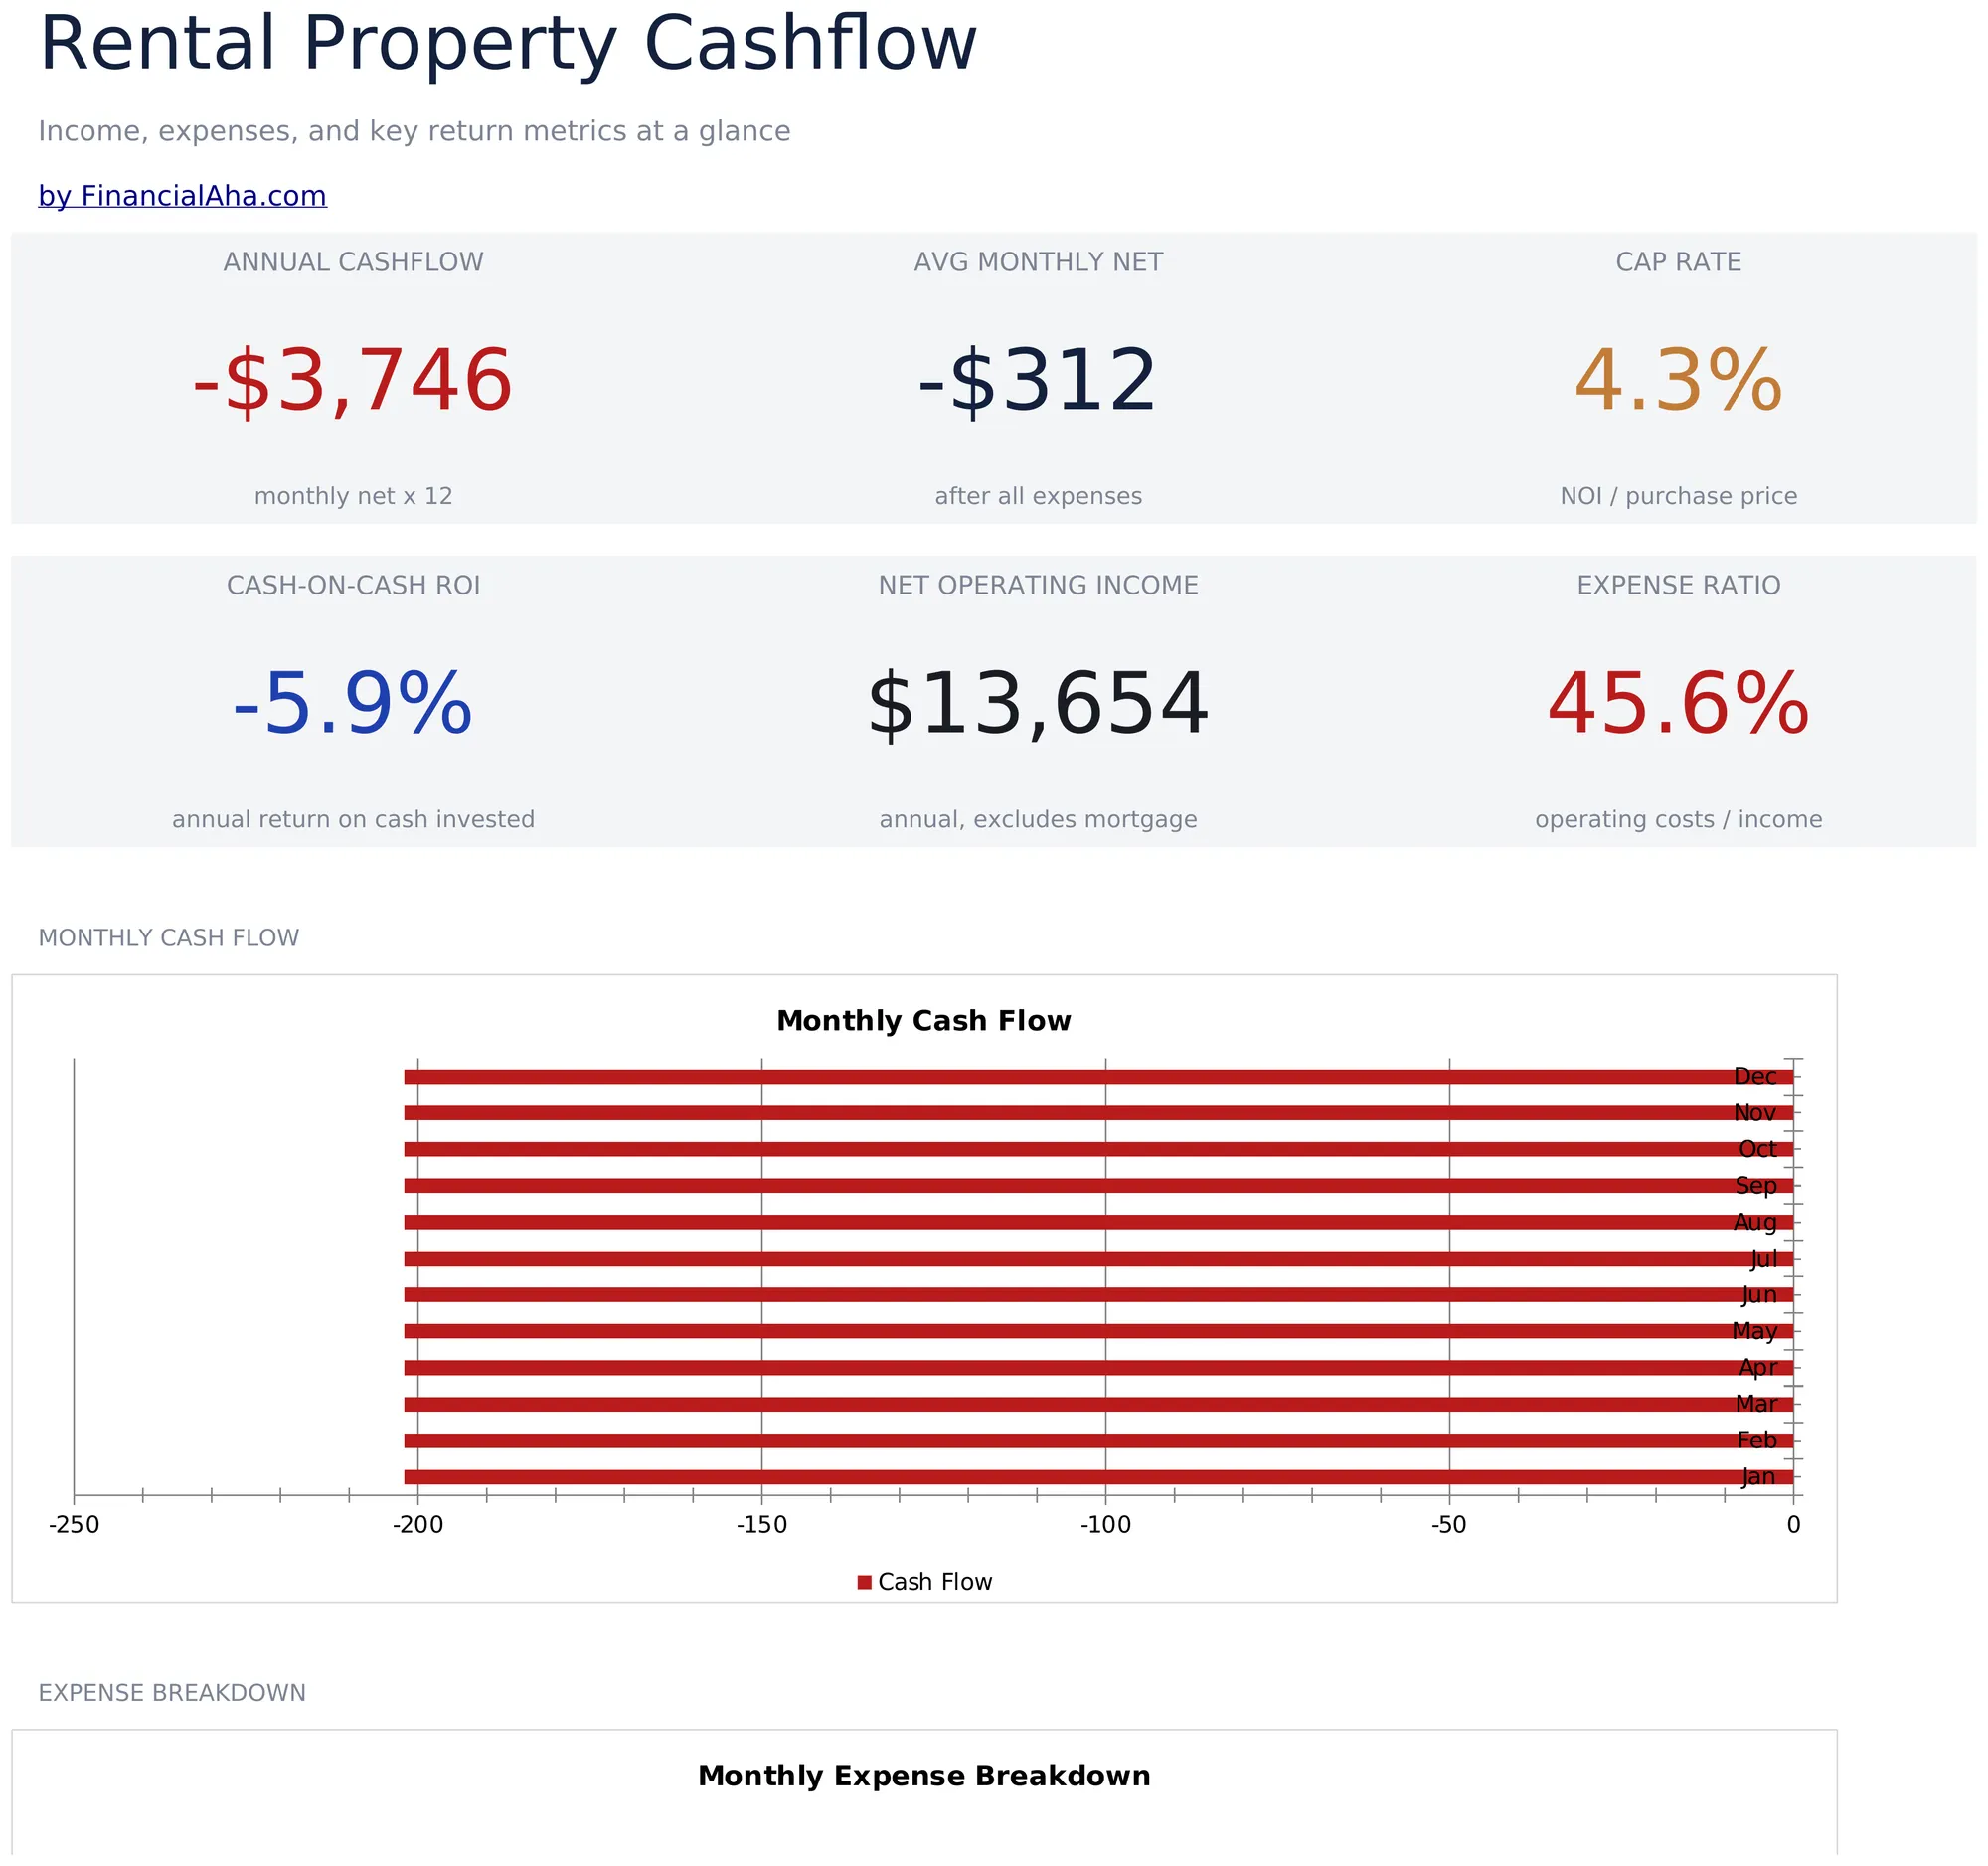
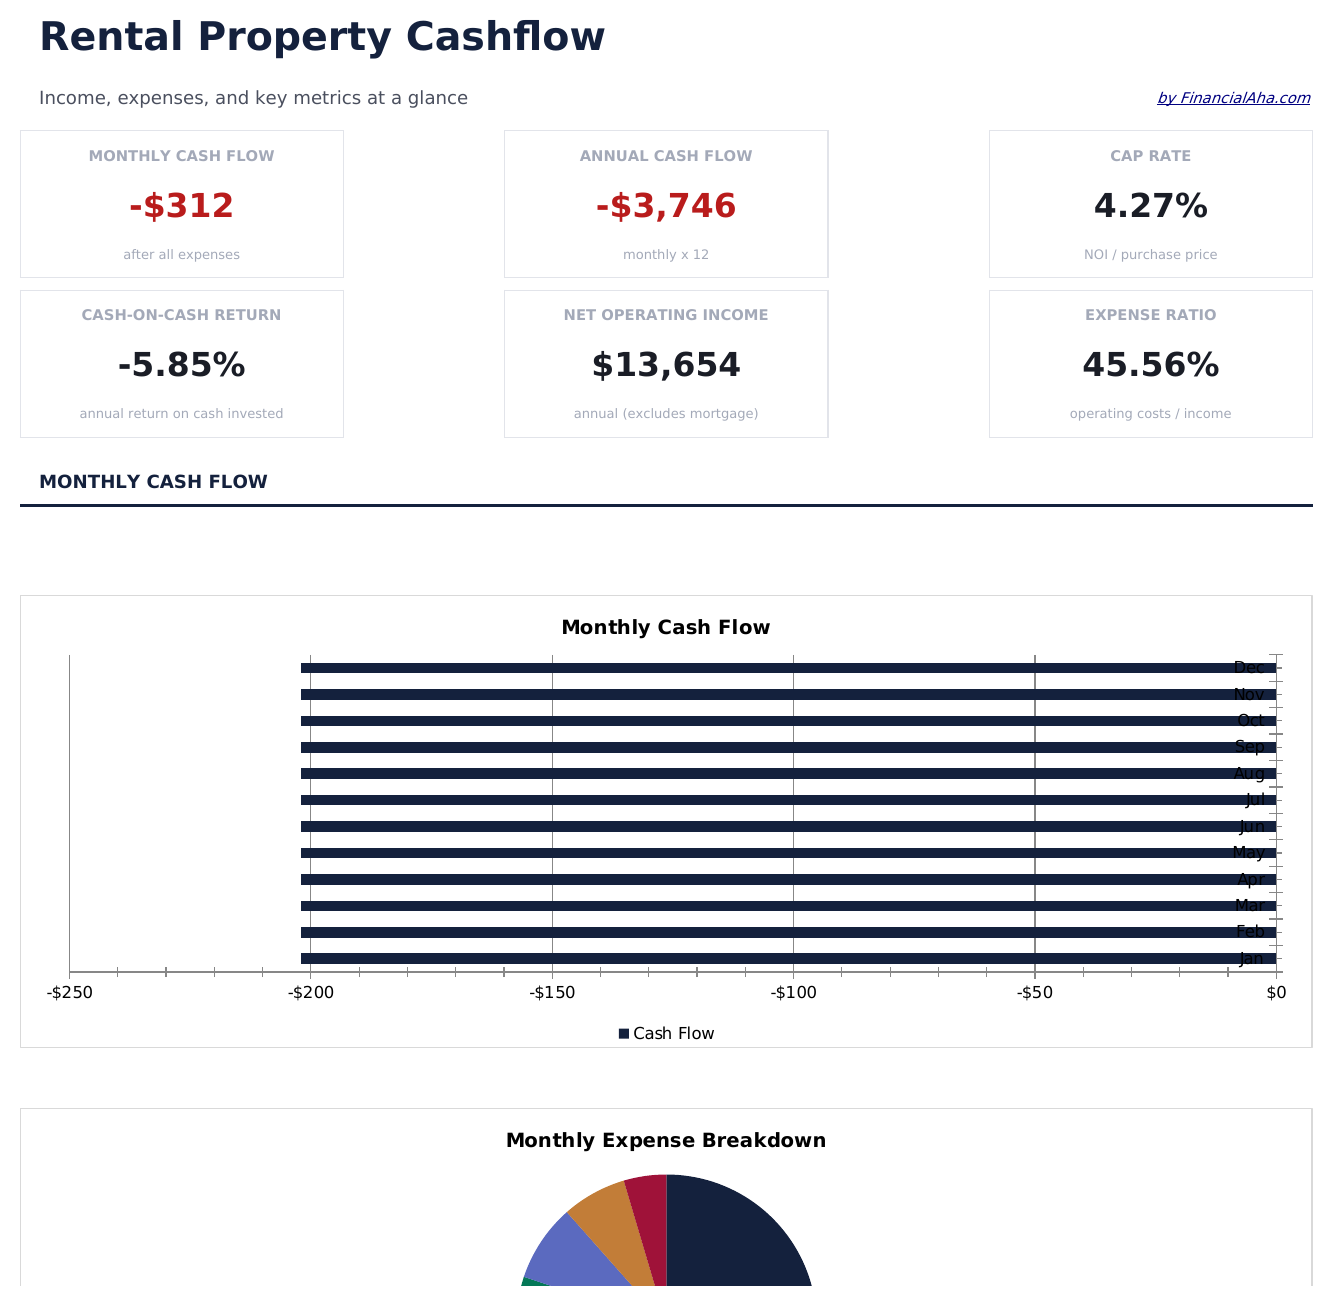
- Dashboard met vastgoedprestatie-indicatoren inclusief netto kasstroom, cap rate en cash-on-cash rendement
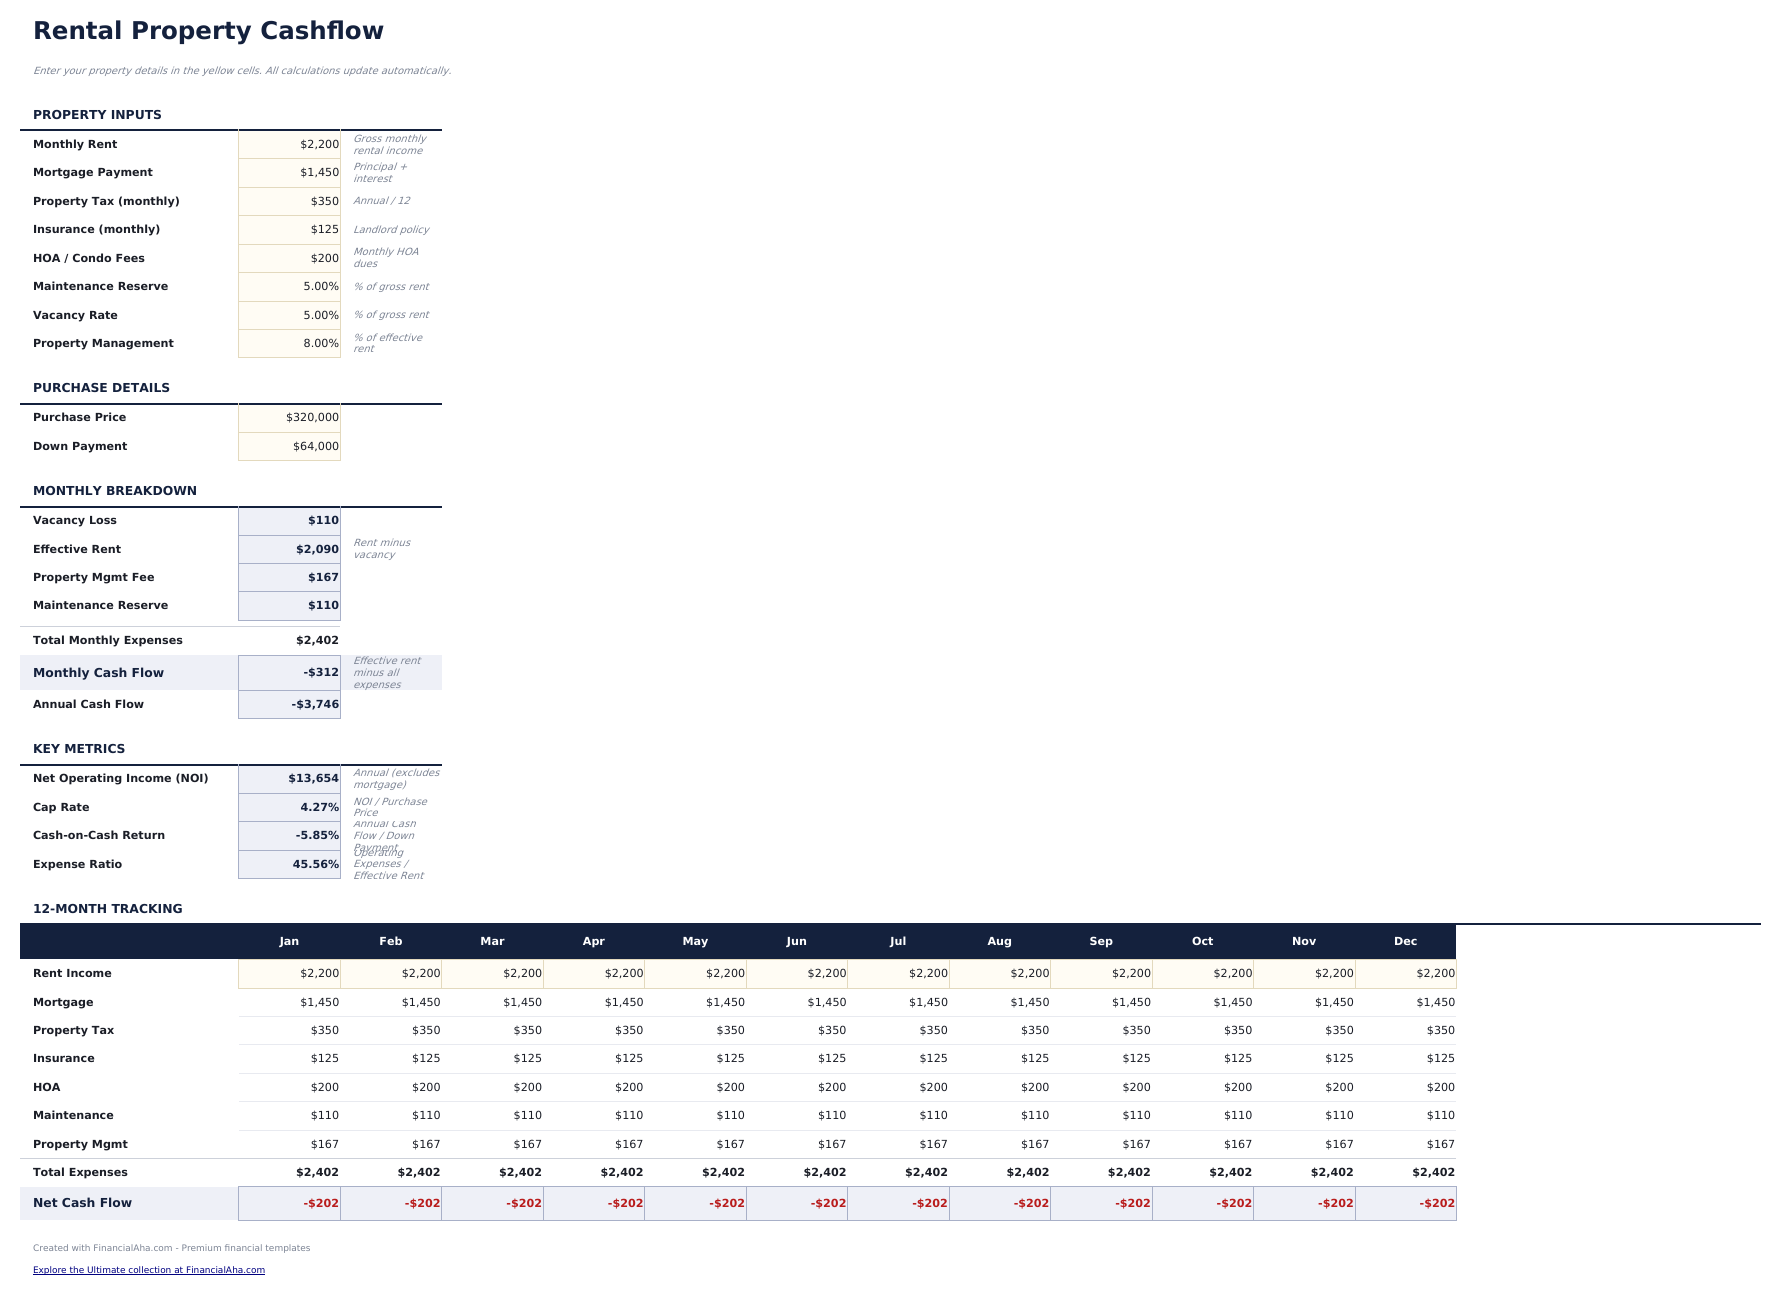
- Vastgoedopstelling met invoer voor huurinkomsten, hypotheekbetaling, onroerendezaakbelasting, verzekering en beheerkosten
- Netto kasstroomberekeningen die alle kosten aftrekken van bruto huurinkomsten om maandelijkse en jaarlijkse winst te tonen
- Leegstand- en onderhoudsreserves met percentagegebaseerde invoer die automatisch de effectieve inkomsten verlagen
- Rendementscijfers met kleurgecodeerde invoercellen (geel) en automatisch berekende prestatiecijfers (blauw)
- Werkt in Microsoft Excel, Google Sheets en LibreOffice Calc zonder installatie
Need more from this template?
The Essentials version covers everyday tracking. Ultimate goes further with multi-entity support, scenario analysis, and ultimate-grade reporting.
- Dashboard met vastgoedprestatie-indicatoren inclusief netto kasstroom, cap rate en cash-on-cash rendement
- Vastgoedopstelling met invoer voor huurinkomsten, hypotheekbetaling, onroerendezaakbelasting, verzekering en beheerkosten
- Netto kasstroomberekeningen die alle kosten aftrekken van bruto huurinkomsten om maandelijkse en jaarlijkse winst te tonen
- Leegstand- en onderhoudsreserves met percentagegebaseerde invoer die automatisch de effectieve inkomsten verlagen
- Volg tot 5 verhuureigendommen met aankoopprijs, hypotheek, belastingen, verzekering, VvE, onderhoud en beheervergoedingsgegevens
- Dashboard met 6 KPI-kaarten: totale maandelijkse cashflow, totaal eigendommen, bruto huurinkomsten, totale uitgaven, netto operationeel inkomen en gemiddelde cap rate
- Werkblad maandelijkse cashflow dat inkomsten en uitgaven per eigendom bijhoudt over 12 maanden met lopende totalen en jaaroverzicht
- ROI-calculator met cash-on-cash rendement, cap rate, brutorendement en totaal rendement per eigendom en over de gehele portefeuille
- Gevoeligheidsanalyseraster dat toont hoe netto cashflow verandert wanneer leegstandspercentage en huurprijs variëren over 25 combinaties
Voorbeeld
Bekijk wat er in dit sjabloon zit
Hoe gebruik je dit Huurvastgoed Kasstroom sjabloon
Vastgoedgegevens invoeren
Vul maandelijkse huurinkomsten, hypotheekbetaling, onroerendezaakbelasting, verzekering en beheerkosten in op het opstellingsblad.
Leegstand en onderhoud instellen
Voer leegstandspercentage en onderhoudsreserve in als percentages. Deze verlagen automatisch de effectieve inkomsten.
Netto kasstroom controleren
Het sjabloon berekent maandelijkse en jaarlijkse netto kasstroom nadat alle kosten en reserves zijn afgetrokken van de huurinkomsten.
Rendementscijfers bekijken
Het dashboard toont cap rate, cash-on-cash rendement en netto bedrijfsresultaat voor het evalueren van vastgoedprestaties.
Customer Reviews
What Our Customers Say
"If I get half as good at handling my finances as you are at customer service, this'll be the best $26 I've spent lately."
"Great tool! Simplifies financial planning without the hassle of complex spreadsheets."
"I recently purchased your super convenient spreadsheet, it really helps me!"
"They're great and super intuitive. Thank you!"
Gebouwd door Claude AI. Verfijnd door ons.
We gebruiken Claude AI om elk sjabloon te ontwerpen, na uitgebreid onderzoek. Daarna neemt ons team het over. We verfijnen de indeling, testen elke formule grondig, lossen randgevallen op en polijsten het ontwerp totdat het iets is dat we zelf ook echt zouden gebruiken. De AI brengt ons 80% van de weg. De laatste 20% is puur menselijk oordeel.
Veelgestelde vragen
Wat is cap rate?
Kapitalisatiegraad deelt het netto bedrijfsresultaat door de aankoopprijs van het vastgoed. Het meet het rendement onafhankelijk van financiering.
Welk leegstandspercentage moet ik gebruiken?
Gangbare aannames liggen tussen 5% en 10% afhankelijk van marktomstandigheden en vastgoedtype. Voer het percentage in dat past bij je lokale markt.
Worden hypotheekbetalingen opgenomen?
Ja. De kasstroomberekening trekt de volledige hypotheekbetaling (aflossing en rente) af van de huurinkomsten naast alle andere kosten.
Kan ik meerdere panden bijhouden?
Dit sjabloon dekt een pand. Dupliceer het bestand voor elk huurpand en houd ze individueel bij.
Hoe open ik dit in Google Sheets?
Upload het .xlsx-bestand naar Google Drive en open het vervolgens met Google Sheets. Alle formules en opmaak blijven behouden.
Meer Essentials-sjablonen voor Bedrijfsfinancien
Hoogtepunten:
Op zoek naar premium spreadsheet-sjablonen?
Onze betaalde sjablonen bevatten geavanceerde dashboards met meerdere werkbladen, ingebouwde Excel-grafieken en doorlopende updates.
Krijg in plaats daarvan elk Ultimate sjabloon
Alle 58 Ultimate sjablonen in één aankoop voor $299 - $1,102 waarde, u houdt $803 over.