Flusso di Cassa Immobile in Affitto Modello Essentials
Monitora i redditi e le spese degli affitti per gli immobili da investimento. Calcola il flusso di cassa netto, il cap rate e le metriche di rendimento per i proprietari.
Cosa include
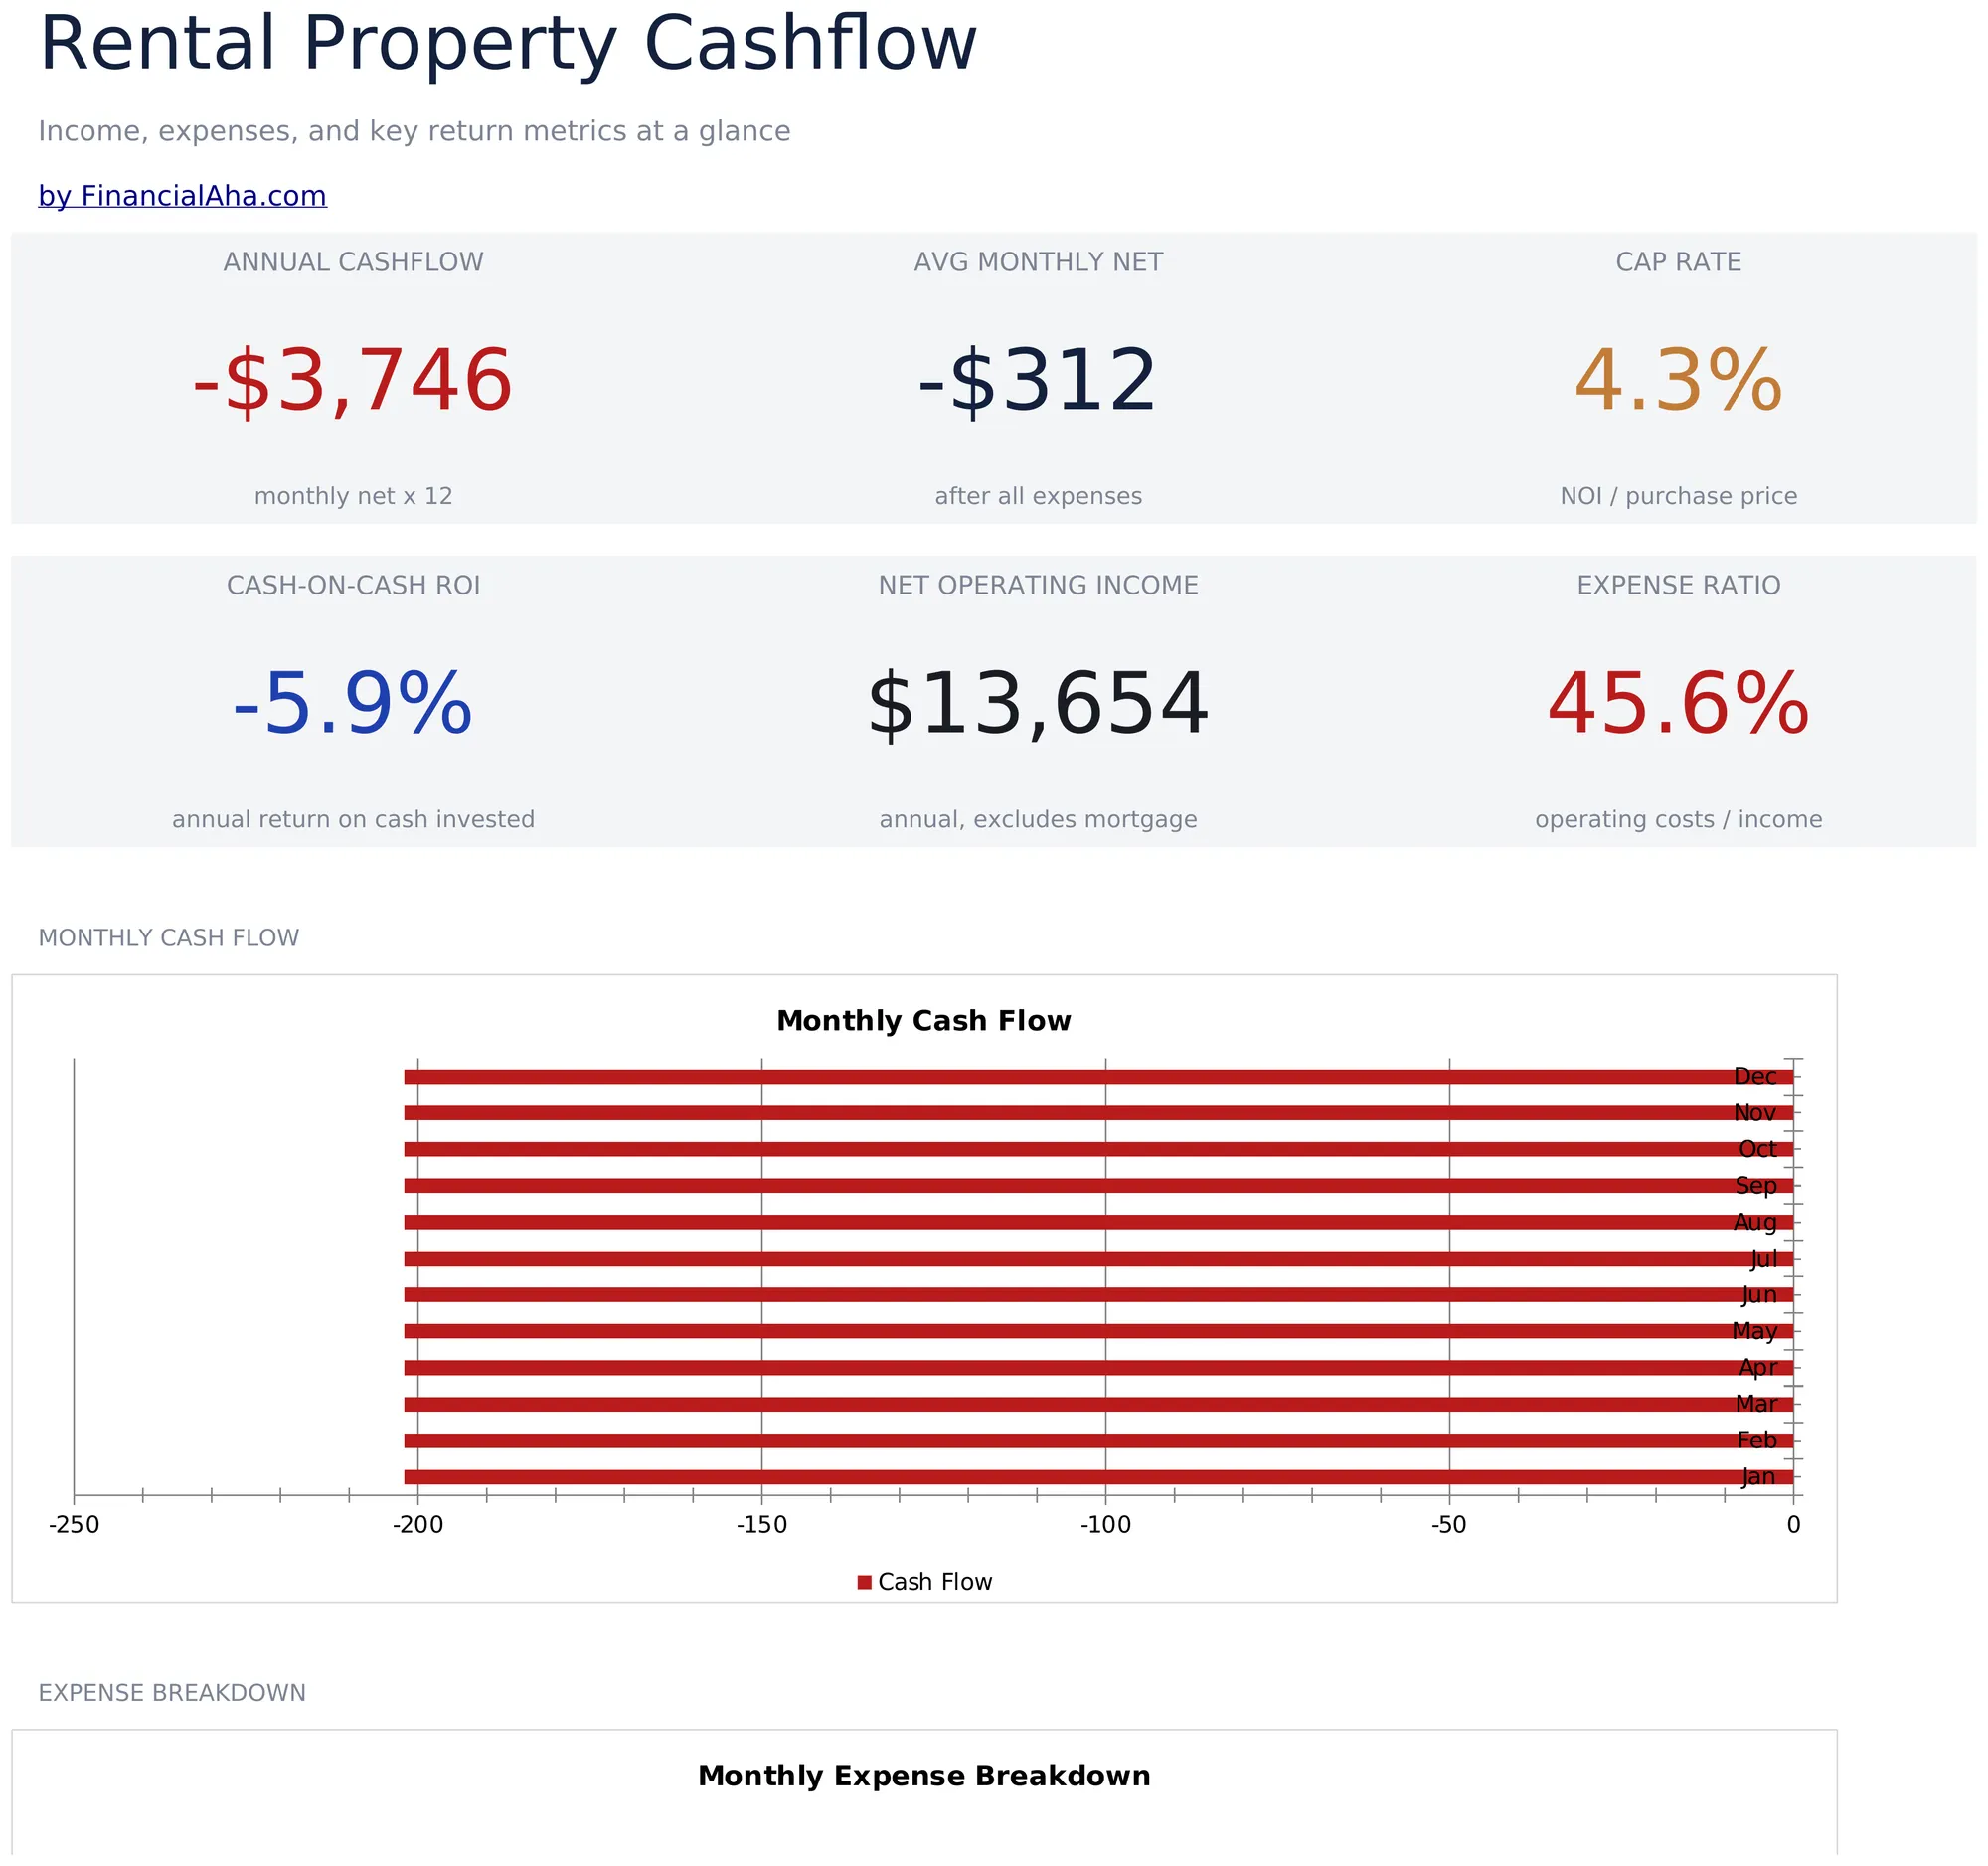
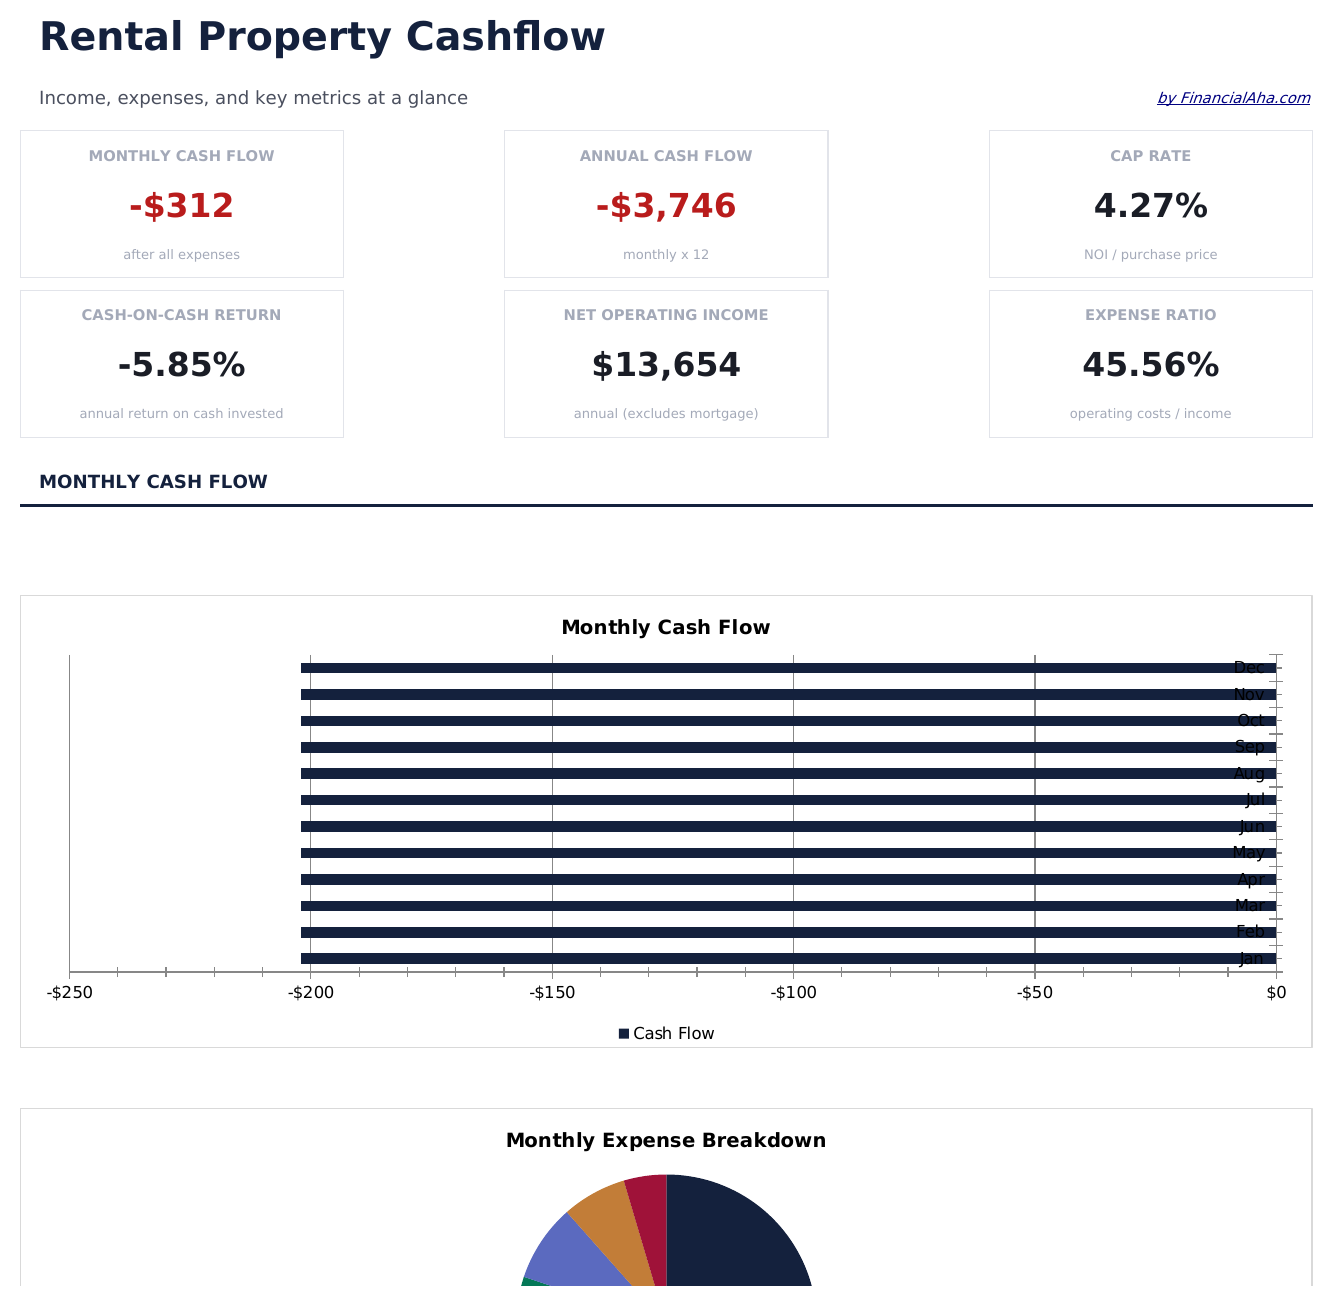
- Dashboard con indicatori di performance della proprietà, tra cui flusso di cassa netto, tasso di capitalizzazione e rendimento cash-on-cash
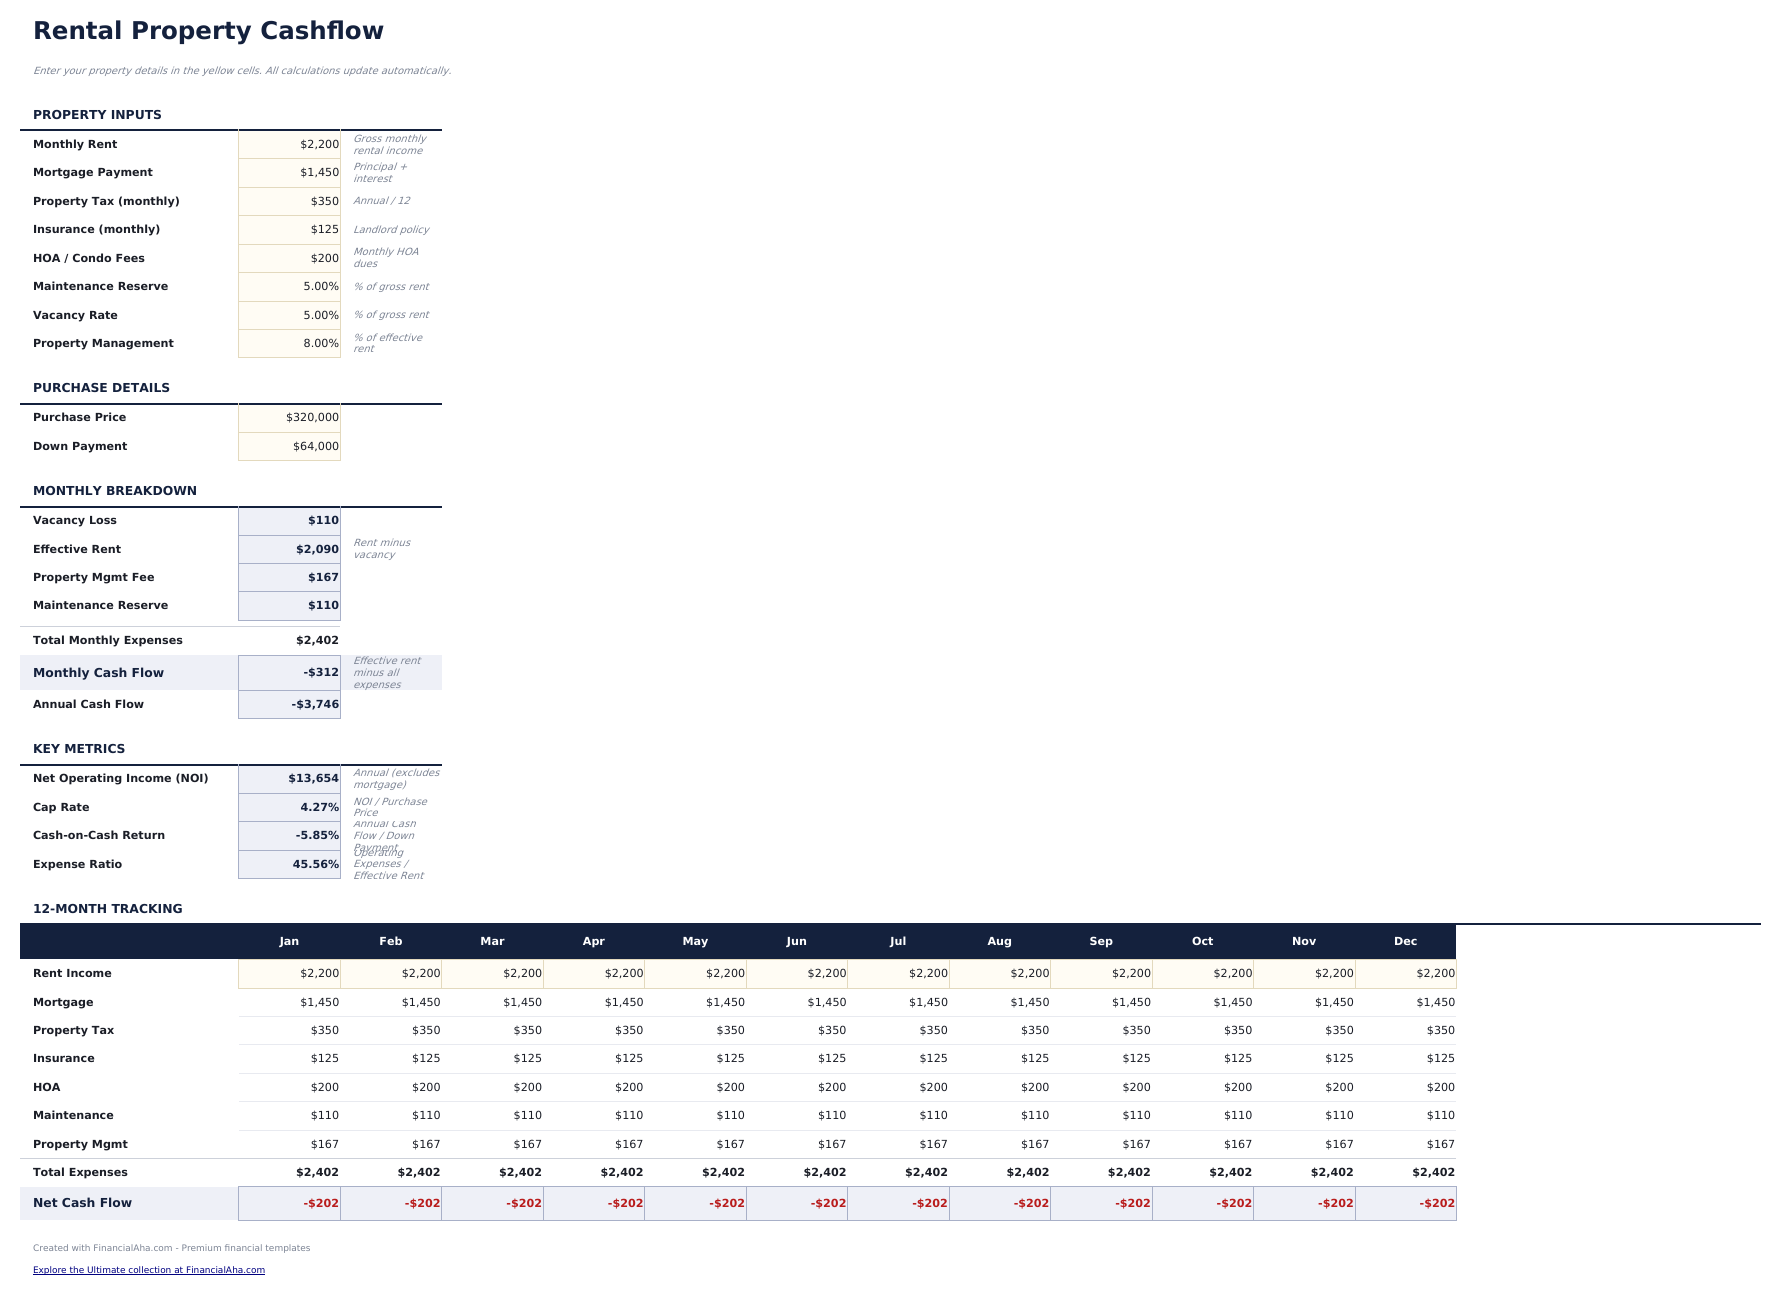
- Configurazione della proprietà con campi per reddito da affitto, rata del mutuo, tasse sulla proprietà, assicurazione e commissioni di gestione
- Calcoli del flusso di cassa netto che sottraggono tutte le spese dal reddito lordo da affitto per mostrare il profitto mensile e annuale
- Riserve per sfitto e manutenzione con campi percentuali che riducono automaticamente il reddito effettivo
- Indicatori di ritorno sull'investimento con celle di inserimento codificate a colori (giallo) e valori di performance calcolati automaticamente (blu)
- Funziona con Microsoft Excel, Google Sheets e LibreOffice Calc senza configurazione iniziale
Need more from this template?
The Essentials version covers everyday tracking. Ultimate goes further with multi-entity support, scenario analysis, and ultimate-grade reporting.
- Dashboard con indicatori di performance della proprietà, tra cui flusso di cassa netto, tasso di capitalizzazione e rendimento cash-on-cash
- Configurazione della proprietà con campi per reddito da affitto, rata del mutuo, tasse sulla proprietà, assicurazione e commissioni di gestione
- Calcoli del flusso di cassa netto che sottraggono tutte le spese dal reddito lordo da affitto per mostrare il profitto mensile e annuale
- Riserve per sfitto e manutenzione con campi percentuali che riducono automaticamente il reddito effettivo
- Monitora fino a 5 proprietà in affitto con prezzo di acquisto, mutuo, tasse, assicurazione, HOA, manutenzione e dettagli sulle spese di gestione
- Dashboard con 6 schede KPI: flusso di cassa mensile totale, numero totale proprietà, reddito lordo da locazione, spese totali, reddito operativo netto e cap rate medio
- Foglio flusso di cassa mensile che monitora entrate e uscite per proprietà su 12 mesi con totali progressivi e riepilogo annuale
- Calcolatore ROI che mostra rendimento cash-on-cash, cap rate, rendimento lordo e rendimento totale per proprietà e per l'intero portafoglio
- Griglia di analisi di sensibilità che mostra come il flusso di cassa netto cambia al variare del tasso di sfitto e del prezzo dell'affitto su 25 combinazioni
Anteprima
Scopri cosa contiene questo modello
Come usare questo modello Flusso di Cassa Immobile in Affitto
Inserisci i dettagli della proprietà
Inserisci il reddito mensile da affitto, la rata del mutuo, le tasse sulla proprietà, l'assicurazione e le commissioni di gestione nel foglio di configurazione.
Imposta sfitto e manutenzione
Inserisci il tasso di sfitto e la riserva per manutenzione come percentuali. Questi riducono automaticamente il reddito effettivo.
Controlla il flusso di cassa netto
Il template calcola il flusso di cassa netto mensile e annuale dopo che tutte le spese e le riserve sono state detratte dal reddito da affitto.
Verifica gli indicatori di rendimento
La dashboard mostra il tasso di capitalizzazione, il rendimento cash-on-cash e il reddito operativo netto per valutare le performance della proprietà.
Customer Reviews
What Our Customers Say
"If I get half as good at handling my finances as you are at customer service, this'll be the best $26 I've spent lately."
"Great tool! Simplifies financial planning without the hassle of complex spreadsheets."
"I recently purchased your super convenient spreadsheet, it really helps me!"
"They're great and super intuitive. Thank you!"
Creati da Claude AI. Perfezionati da noi.
Utilizziamo Claude AI per creare ogni modello, dopo una ricerca approfondita. Poi interviene il nostro team. Miglioriamo il layout, testiamo ogni formula, correggiamo i casi limite e rifiniamo il design fino a ottenere qualcosa che useremmo noi stessi. L'AI ci porta all'80%. L'ultimo 20% è tutto giudizio umano.
Domande frequenti
Cos'è il cap rate?
Il tasso di capitalizzazione divide il reddito operativo netto per il prezzo di acquisto della proprietà. Misura il rendimento indipendentemente dal finanziamento.
Quale tasso di sfitto dovrei usare?
Le stime comuni variano dal 5% al 10% a seconda delle condizioni di mercato e del tipo di proprietà. Inserisci il tasso che corrisponde al tuo mercato locale.
Include i pagamenti del mutuo?
Sì. Il calcolo del flusso di cassa deduce il pagamento completo del mutuo (capitale e interessi) dal reddito da affitto insieme a tutte le altre spese.
Posso monitorare più proprietà?
Questo template copre una proprietà. Duplica il file per ogni immobile in affitto e tienili tracciati singolarmente.
Come posso aprirlo in Google Sheets?
Carica il file .xlsx su Google Drive, poi aprilo con Google Sheets. Tutte le formule e la formattazione saranno conservate.
Altri modelli Essentials Finanza Aziendale
Punti Chiave:
Cerchi modelli di fogli di calcolo premium?
I nostri modelli a pagamento includono dashboard multi-foglio avanzate, grafici nativi Excel e aggiornamenti continui.
Privato e sicuro
I tuoi dati finanziari restano sul tuo dispositivo. Non li vediamo mai.
Scopri di piu →Ottieni invece ogni modello Ultimate
Tutti i 58 modelli Ultimate in un unico acquisto per $299 - valore di $1,102, risparmi $803.