Best Value Complete Financial Planning Bundle
✓ Financial Planning✓ Net Worth Tracker✓ Monthly Budgeting✓ Travel Budget Planner✓ Annual Budgeting Planner✓ Monthly Expense Tracker✓ Annual Tax Planner✓ Retirement Planning
View Bundle →

Instant digital delivery · Terms & Conditions apply

Ultimate Template - Excel & Google Sheets

Ultimate Sales Forecast Spreadsheet Template for Google Sheets & Excel

Every pipeline row carries deal, client, stage, amount, close date and owner, and the probability is read from the stage rather than typed per deal, so the weighted amount follows on its own. The Ultimate Sales Forecast spreadsheet template builds a monthly forecast from expected close dates, leaves closed-lost deals out of the pipeline totals, adds stage analysis with a win rate, and sets three scenarios side by side. Six working sheets, Google Sheets and Excel. No macros, no VBA.

See Preview

Instant digital delivery · Terms & Conditions apply

Sales Forecast Spreadsheet Template - Ultimate version for Google Sheets and Excel

What's Included

  • Deal, client, stage, amount, close date and owner on every pipeline row
  • A probability read from the stage rather than typed per deal
  • A weighted amount on every deal, following the probability
  • Pipeline totals that exclude closed-lost deals automatically
  • A monthly forecast summing weighted deals by stage and close month
  • A forecast-year cell, so twelve columns know which year they are
  • Stage analysis with deal counts, average deal size and a win rate
  • Twelve months of planned against actual, with a year-to-date accuracy figure
  • Three scenarios defined as stage cut-offs rather than percentages
  • A currency dropdown that relabels the money columns across every sheet
  • Works in Microsoft Excel and Google Sheets with no setup required

The FinancialAha Ultimate Sales Forecast Spreadsheet Template is a six-sheet workbook for Google Sheets and Excel, with a How to Use guide on a seventh tab. It works as an Ultimate Sales Forecast Excel template and an Ultimate Sales Forecast Google Sheets template from the same download. Deals weighted by the stage they are at, a monthly forecast built from their expected close dates, stage analysis with a win rate, and three scenarios. No macros, no VBA.

Inside the workbook

What's inside the FinancialAha Ultimate Sales Forecast spreadsheet template

The FinancialAha Ultimate Sales Forecast Spreadsheet Template runs on six working sheets, with the instructions on a tab of their own. It works in both Microsoft Excel and Google Sheets and here is what the Ultimate Sales Forecast spreadsheet holds.

  1. 01 of 06

    Pipeline

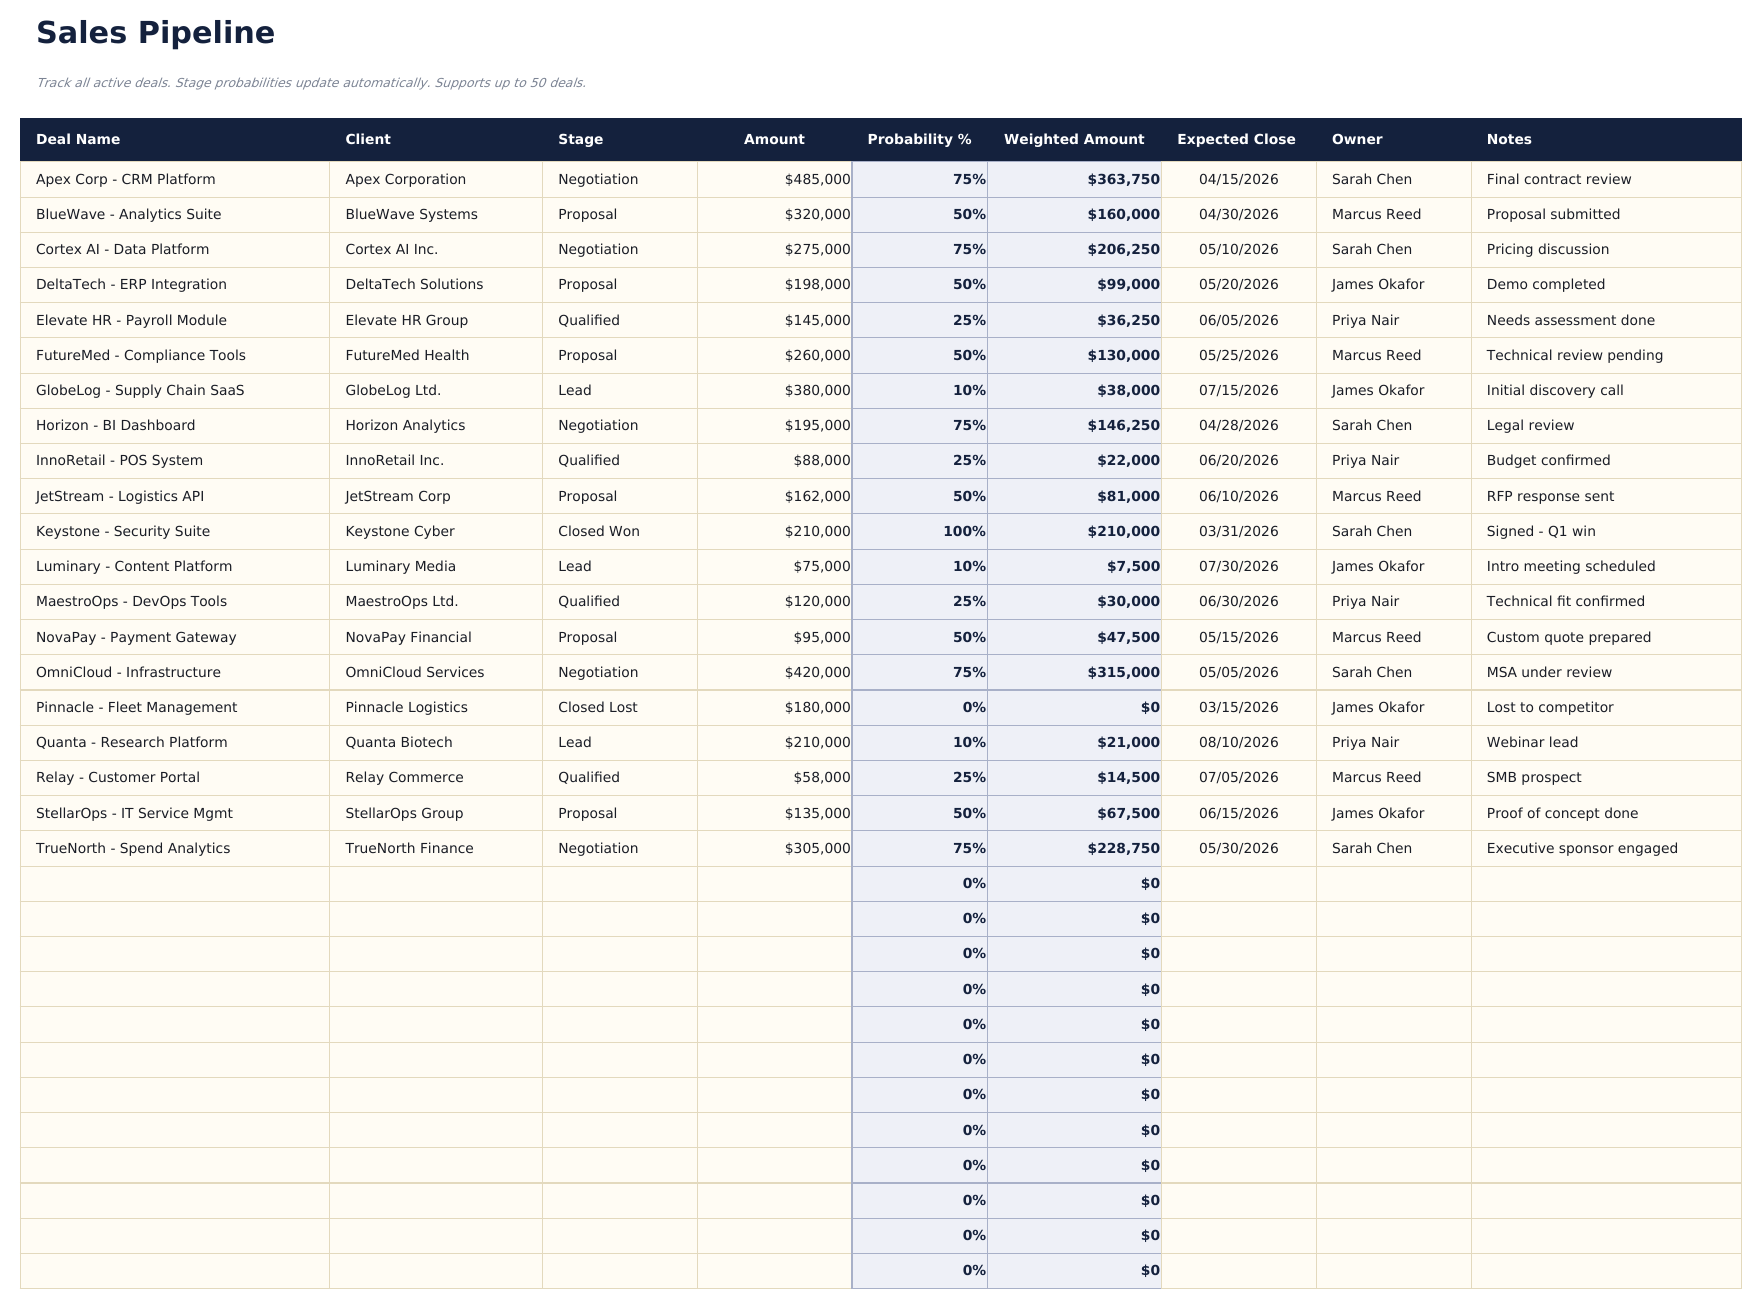
    A row per deal: the deal, the client, the stage it is at, what it is worth, when it is expected to close, who owns it and a note. The probability column is not typed. It reads the stage, so a deal moved from proposal to negotiation reprices itself, and the weighted amount beside it follows. That is the whole discipline the sheet enforces - a forecast where probabilities are typed per deal becomes a forecast of how optimistic each salesperson was feeling. The totals at the foot exclude closed-lost deals, which is the one exclusion that has to be automatic. A pipeline total that quietly includes deals you have already lost is worse than no total.

  2. 02 of 06

    Monthly Forecast

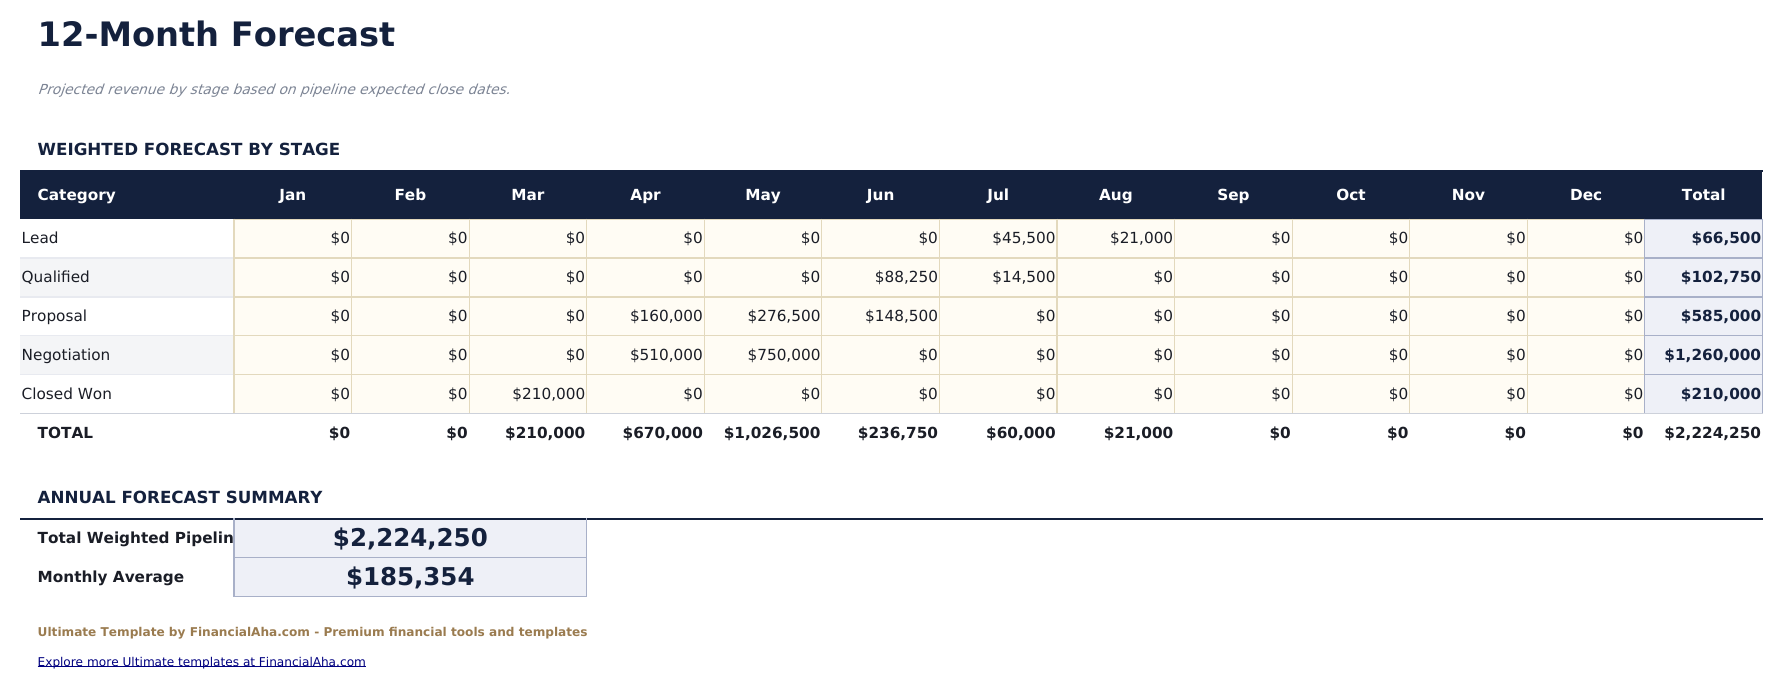
    The pipeline, arranged by when it is expected to land. Each stage gets a row and each month a column, and every cell sums the weighted amount of the deals at that stage closing in that month. A forecast-year cell sits above the grid, because twelve month columns cannot otherwise tell a deal closing this March from one closing next March. Reading it by row rather than by column is the useful direction. A month carried entirely by leads is a month that will not happen; one carried by negotiations mostly will.

  3. 03 of 06

    Stage Analysis

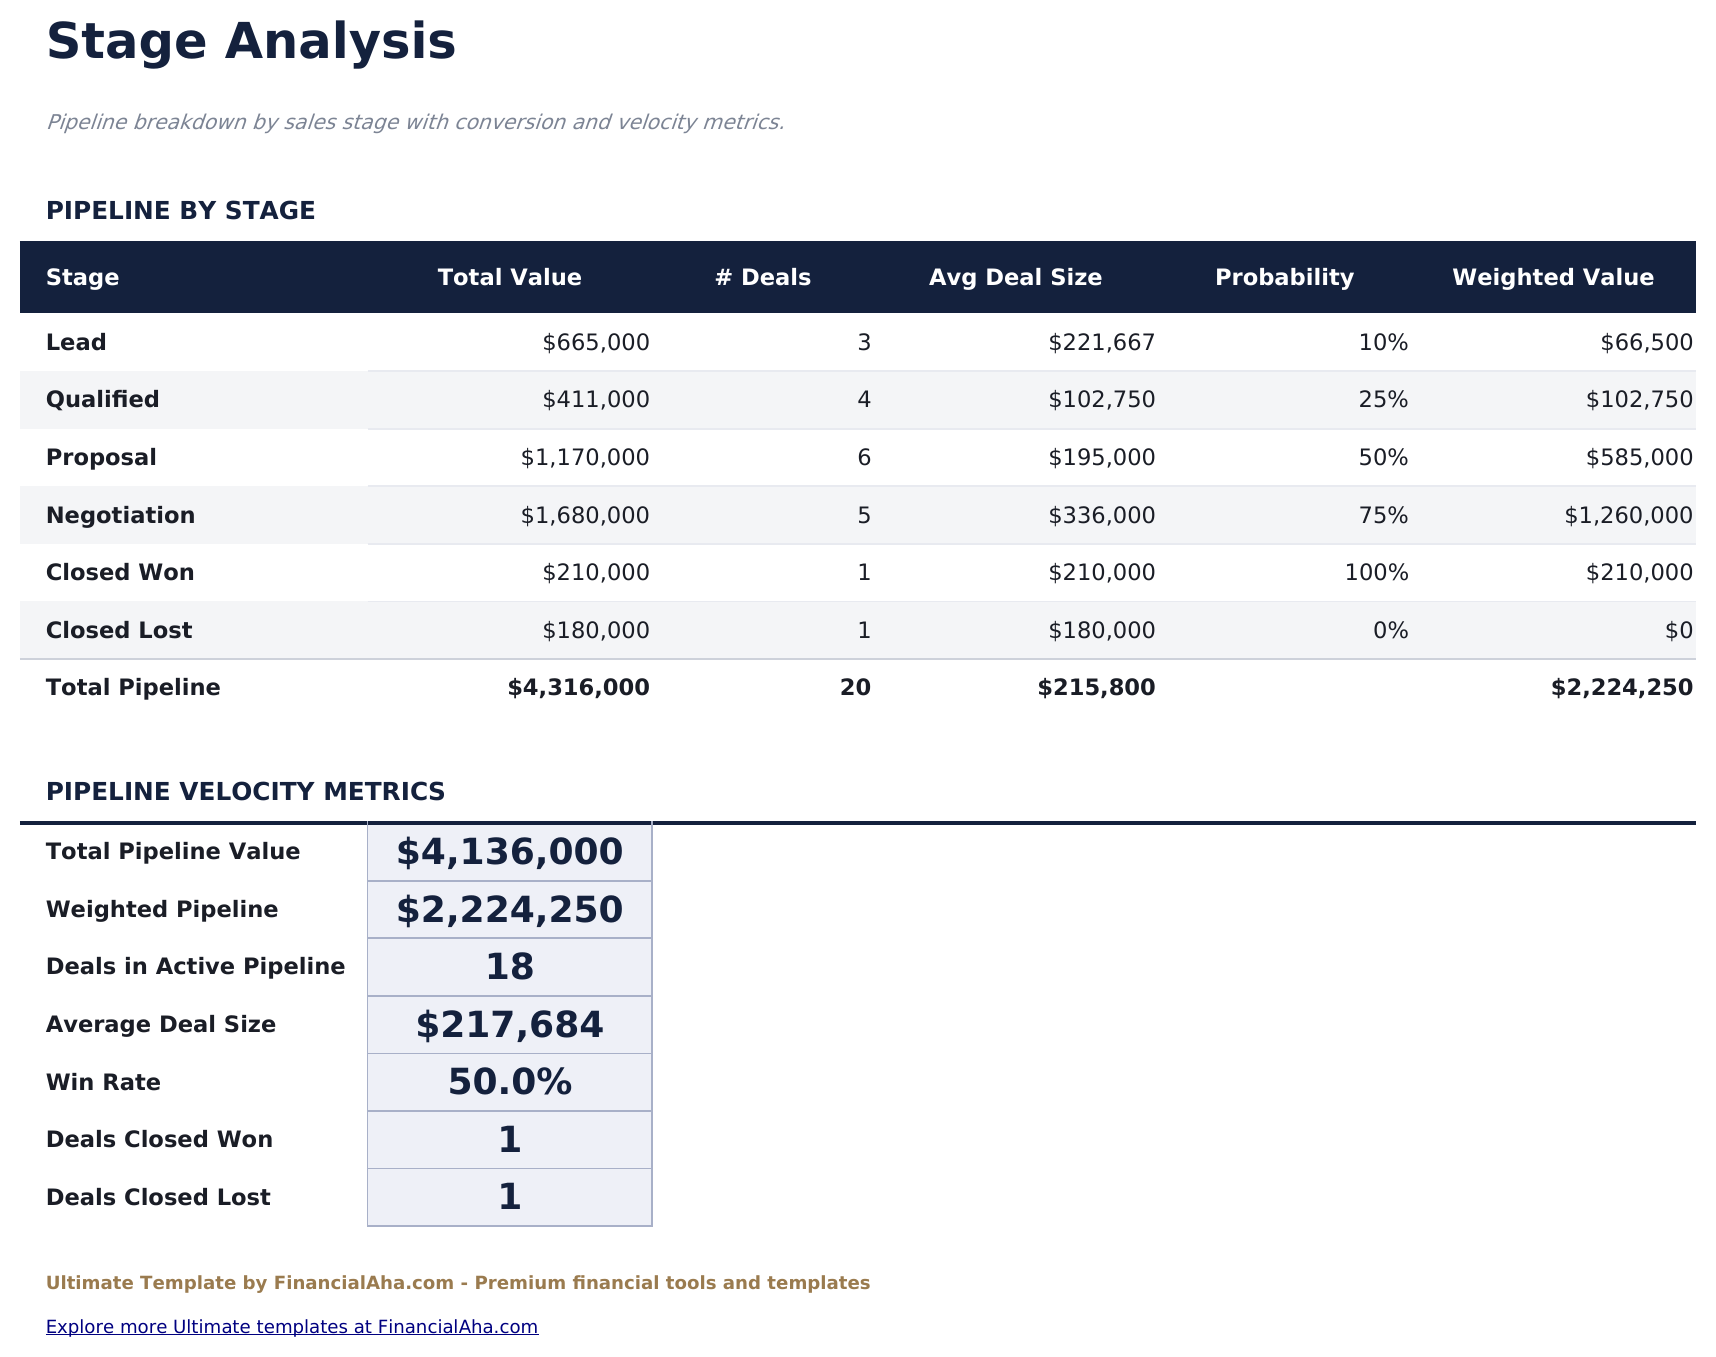
    The pipeline cut by stage: total value, how many deals, the average deal size, the probability applied and the weighted value. Underneath, the velocity block - active deals, average deal size, and a win rate worked out from closed-won against closed-lost. The average deal size per stage is the figure worth watching. When it is much higher at proposal than at negotiation, the big deals are stalling before the end, which is a different problem from a thin pipeline.

  4. 04 of 06

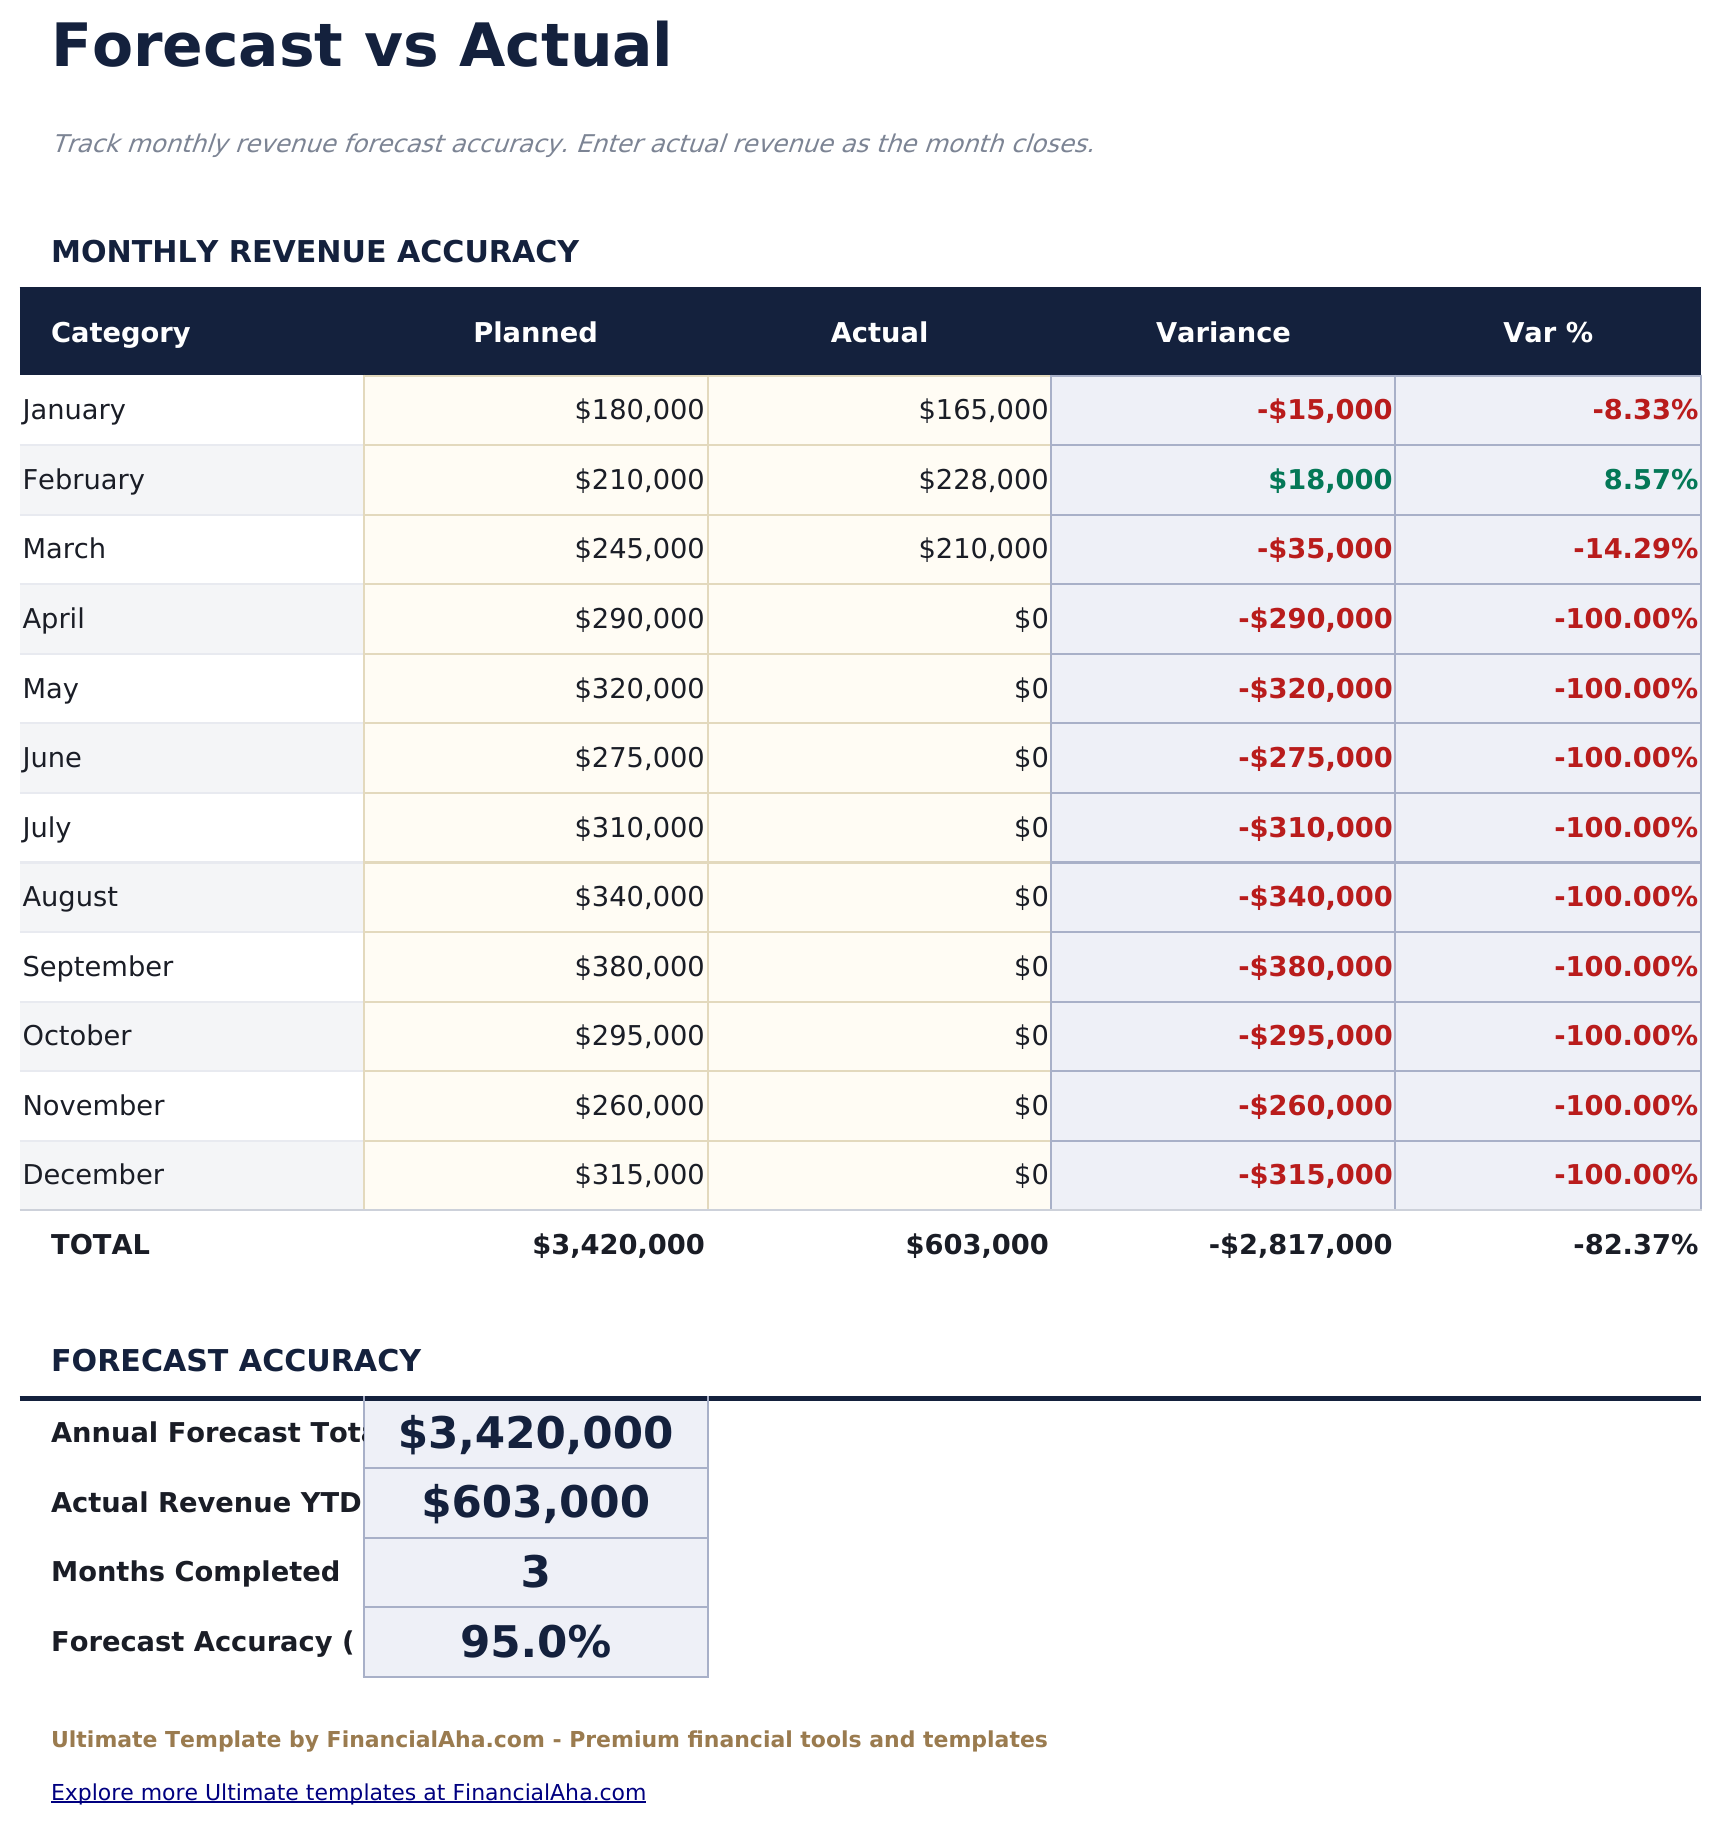
    Forecast vs Actual

    Twelve months of planned revenue against actual, with the variance in money and as a percentage, and a year-to-date accuracy figure that only counts the months with actuals in them. That last guard matters: without it, an accuracy figure in March would read as a catastrophic shortfall rather than as nine months not yet happened.

  5. 05 of 06

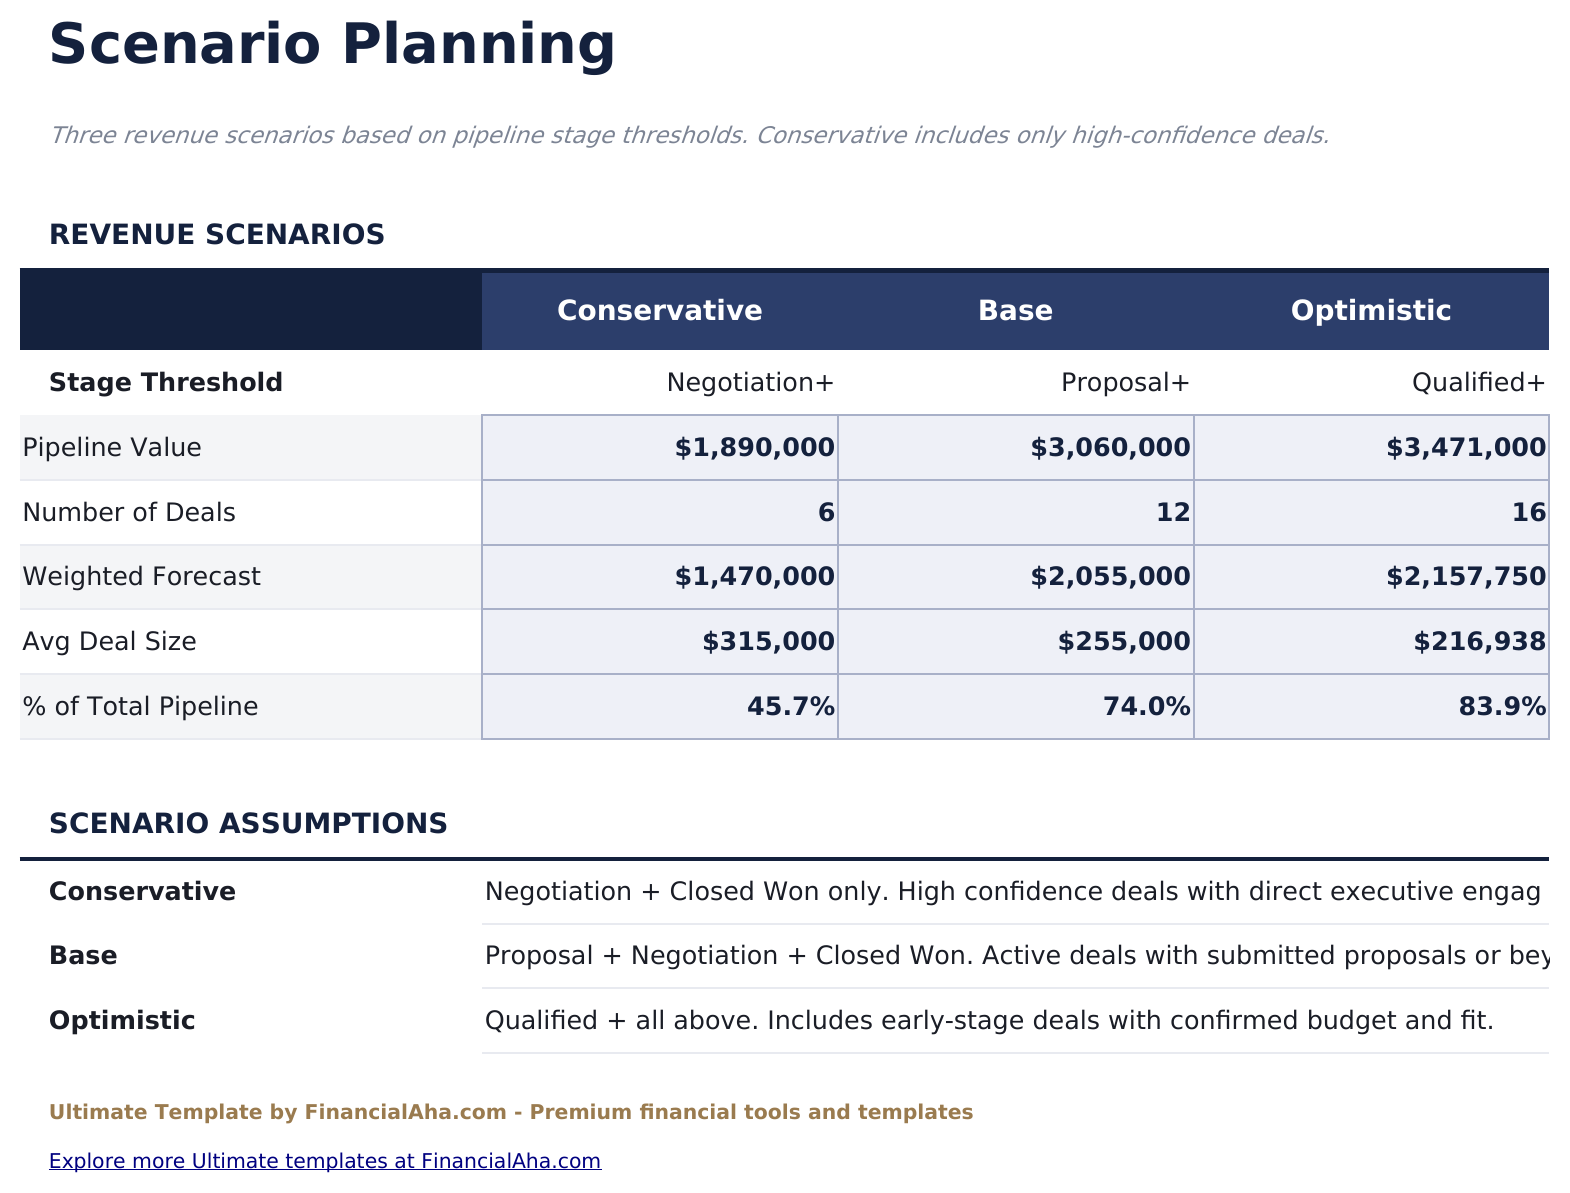
    Scenario Planning

    Three cut-offs rather than three multipliers: count only negotiations and wins, count proposals and beyond, or count everything from qualified up. Each column reports the pipeline value, the number of deals, the weighted forecast, the average deal size and the share of the pipeline it represents. Defining a scenario as a stage cut-off rather than a percentage is what makes it defensible. Conservative means something you can point at on the pipeline sheet.

  6. 06 of 06

    Dashboard

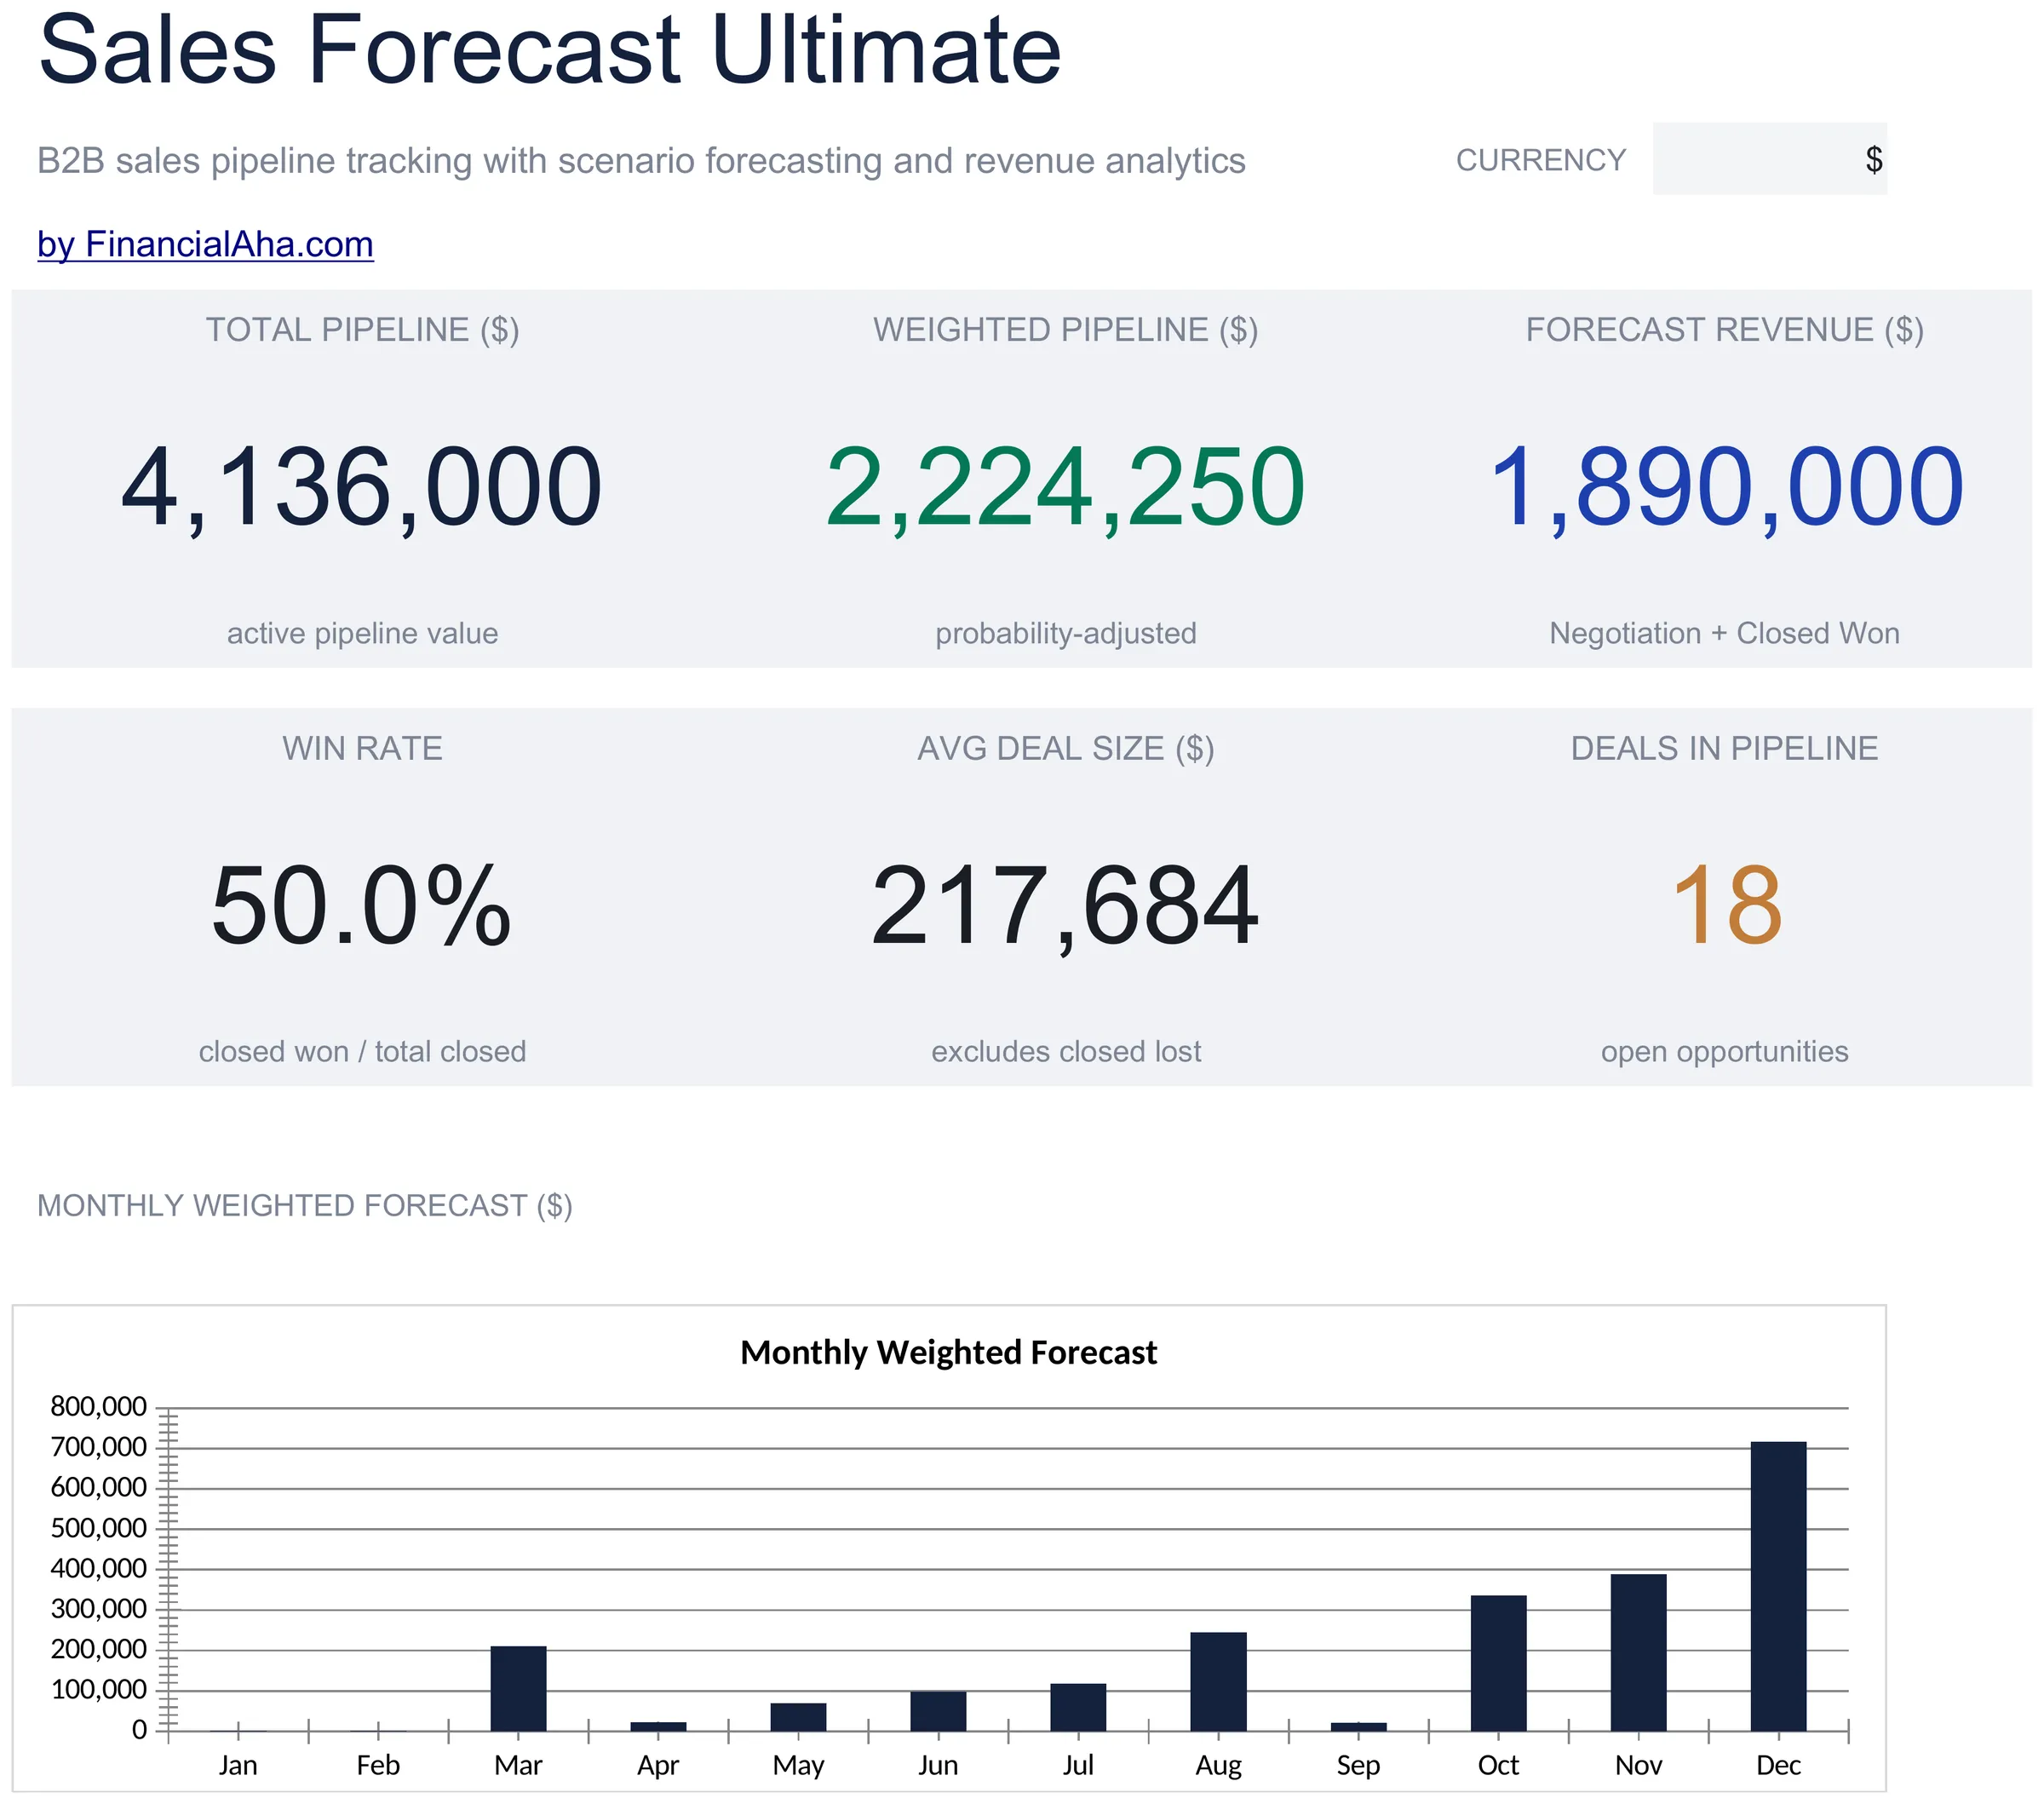
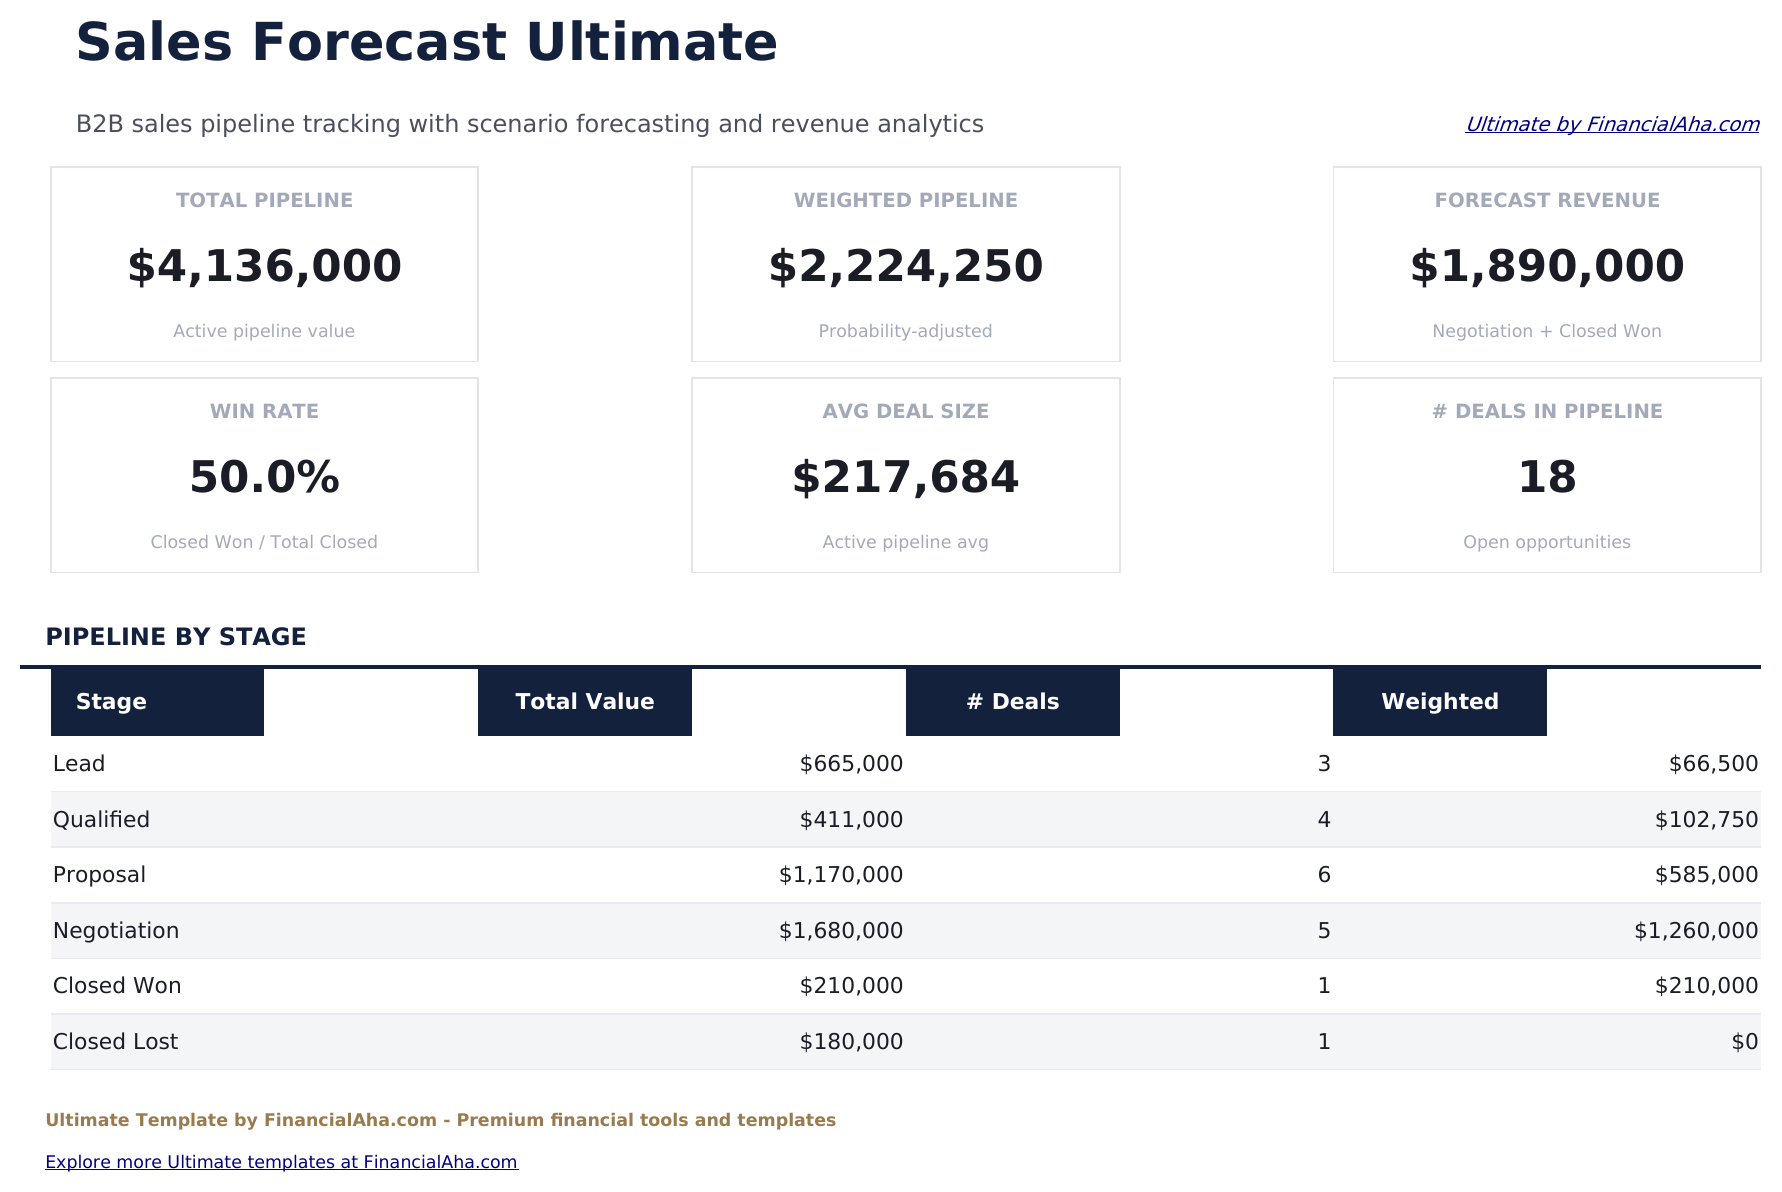
    Six figures. Total pipeline, weighted pipeline and forecast revenue on the top row; the win rate on closed deals, the average size of an active deal, and how many opportunities are still open on the second. Weighted against unweighted pipeline is the pair worth reading. One is what is on the table and the other is what it is worth after each deal's own probability, and the gap between them is how optimistic the pipeline is. Charts sit alongside for the pipeline by stage and the forecast over time.

  7. Included guide

    How to Use

    A step-by-step guide on its own tab, covering which sheet takes input, how the stage drives the probability, what the forecast year does, and how to change the currency. Because it ships inside the file, the instructions travel with the template wherever it is opened.

Works in both Google Sheets and Excel

Ultimate Sales Forecast Spreadsheet template for Google Sheets

Upload the Ultimate Sales Forecast Spreadsheet Template to Drive, right-click it, and choose "Open with Google Sheets". This Ultimate Sales Forecast Google Sheets template needs no conversion step, the cross-sheet references resolve, and both charts come across intact.

Ultimate Sales Forecast Google Sheets template setup

A shared copy of the Ultimate Sales Forecast Google Sheets template suits a team where each owner keeps their own deals current, since every other sheet reads the pipeline rather than a copy of it.

Running the Ultimate Sales Forecast Google Sheets template

The Ultimate Sales Forecast Google Sheet is updated as deals move. Changing a stage is the single edit that reprices a deal, moves the monthly forecast and shifts every scenario.

Ultimate Sales Forecast Spreadsheet template for Excel

The Ultimate Sales Forecast spreadsheet Excel download is a plain .xlsx. Excel opens this Ultimate Sales Forecast Excel template directly, with no import step, and both charts are native Excel charts. There are no macros and no VBA in the file.

Ultimate Sales Forecast Excel template setup

The same Ultimate Sales Forecast Excel template opens in Excel on Windows, Excel on Mac, and Excel for the web. It is also the identical file you would upload to Drive, so there is no separate Ultimate Sales Forecast spreadsheet download to choose between.

Ultimate Sales Forecast spreadsheet template notes for Excel

The Ultimate Sales Forecast spreadsheet Excel file carries no macros and no VBA, so Excel opens it without a trust prompt.

Opening the Ultimate Sales Forecast spreadsheet Excel file

Nothing in the Ultimate Sales Forecast Excel template is version-specific, so this Ultimate Sales Forecast spreadsheet Excel workbook behaves identically in Excel on Windows, Excel on Mac, and older builds.

Spreadsheet template highlights

What the Ultimate Sales Forecast spreadsheet template tracks

A row per deal. This is what the Ultimate Sales Forecast Spreadsheet Template records for each deal:

Deal Name
what the opportunity is, in your own words
Client
who it is with
Stage
lead, qualified, proposal, negotiation, closed won or closed lost
Amount ($)
what the deal is worth if it lands
Probability % auto
derived from the stage rather than typed per deal
Weighted Amount ($)
the amount at that probability
Expected Close
the date, which is what places the deal in the monthly forecast
Owner
whose deal it is
Notes
where it actually stands

Compare builds

FinancialAha Sales Forecast spreadsheet template: Free, Essentials, and Ultimate compared

Feature Free View Spreadsheet Template Essentials View Spreadsheet Template Ultimate This page
Working sheets 1 2 6
Grain Four quarters Twelve months Deal by deal
Forecast lines 14 products 10 products 50 deals
Actuals recorded against the forecast Yes Yes, monthly
Variance in money and percent Yes Yes
Probability weighting by stage Yes
Pipeline by stage, with win rate Yes
Scenario comparison Three stage cut-offs
Charts 2 2

The Free Sales Forecast Spreadsheet Template covers a year in four quarters, forecast only. The Essentials Sales Forecast Spreadsheet Template moves to twelve months and records actuals beside the forecast. The FinancialAha Ultimate Sales Forecast Spreadsheet Template forecasts deal by deal instead, each weighted by the stage it is at, a monthly forecast built from expected close dates, stage analysis with a win rate, and three scenarios defined as stage cut-offs.

Good to know

Notes on working in the Ultimate Sales Forecast spreadsheet template

  • The probability reads the stage rather than being typed, so moving a deal reprices it.
  • The pipeline totals exclude closed-lost deals, which is the one exclusion that has to be automatic.
  • The monthly grid places a deal by its expected close date, against a forecast year you set.
  • A month carried by leads and a month carried by negotiations are not the same month.
  • Scenarios are stage cut-offs rather than percentages, so conservative means something you can point at.
  • The currency dropdown on the dashboard relabels the money columns across every sheet. It changes the label only and does not convert the numbers.

How to Use This Template

1

List the deals

List the deals: deal, client, stage, amount, close date, owner.

2

Let the stage price them

The probability and weighted amount follow the stage.

3

Read the monthly forecast

Weighted value by stage and expected close month.

4

Compare the scenarios

Negotiation and up, proposal and up, qualified and up.

Stress-tested with AI.

Every template starts with deep research into how people actually track the topic. We design the layout, build the formulas, and polish the design until it feels like something we would use ourselves. Along the way, we use AI to stress-test the calculations: unusual inputs, edge cases, and formula behavior, checked until the numbers hold.

One-time purchase. No subscription. Works in Excel & Google Sheets.

Frequently Asked Questions

Is the FinancialAha Ultimate Sales Forecast Spreadsheet Template a Google Sheets template?

Yes. Upload the file to Drive and choose "Open with Google Sheets". The cross-sheet references in the Ultimate Sales Forecast Google Sheets template resolve on import and both charts come across intact.

Is the FinancialAha Ultimate Sales Forecast Spreadsheet Template an Excel template?

Yes. The download is a plain .xlsx, so the Ultimate Sales Forecast Excel template opens directly in Excel with no import step, and both charts are native Excel charts.

Will the FinancialAha Ultimate Sales Forecast spreadsheet Excel file open in older versions of Excel?

Yes. The Ultimate Sales Forecast spreadsheet Excel workbook ships as a plain .xlsx, so it opens identically in current Excel and in builds that predate dynamic arrays.

Why does the Ultimate Sales Forecast spreadsheet derive probability from the stage instead of taking it typed?

Because a forecast with a probability typed per deal becomes a record of how optimistic each salesperson felt. Reading it from the stage means moving a deal is the only way to reprice it.

How does the Ultimate Sales Forecast Excel template know which month a deal belongs to?

From its expected close date, against a forecast-year cell above the grid. Each cell sums the weighted amount of the deals at that stage closing in that month.

How are the three scenarios in the Ultimate Sales Forecast spreadsheet defined?

As stage cut-offs: negotiations and wins only, proposals and beyond, or everything from qualified up. A cut-off is something you can point at on the pipeline sheet, which a percentage is not.

What does the year-to-date accuracy figure in the Ultimate Sales Forecast spreadsheet count?

Only the months with actuals recorded. Without that guard, an accuracy figure read in March would show the nine months that have not happened yet as a shortfall.

Does the FinancialAha Ultimate Sales Forecast spreadsheet include closed-lost deals in the totals?

No. The pipeline totals exclude them automatically, which is the one exclusion that cannot be left to whoever is reading.

What do I get after buying the Ultimate Sales Forecast spreadsheet template?

You receive the Ultimate Sales Forecast spreadsheet template as an Excel file (.xlsx) that works in Microsoft Excel and Google Sheets. Download it immediately after purchase - no signup or account required.

Is there a free Ultimate Sales Forecast spreadsheet template?

Yes. A free version of the Ultimate Sales Forecast spreadsheet template is available with basic features. The Ultimate version adds advanced analysis, more capacity, and additional sheets.

What if the Ultimate Sales Forecast spreadsheet template does not work for me?

Contact us and we will help troubleshoot. The Ultimate Sales Forecast spreadsheet template works in Microsoft Excel and Google Sheets with no macros required.

Ultimate

Highlights:

Instant download after purchase
No macros or VBA required
All formulas auto-calculate
No subscription required
Works in
Excel Google Sheets

Looking for more Ultimate templates?

We offer Ultimate versions of our most popular spreadsheet templates with advanced features, more capacity, and deeper analysis.

Private & secure

Your financial data stays on your device. We never see it.

Learn more →

Need help?

Check our guides or reach out with questions.

View FAQ →