Best Value Complete Financial Planning Bundle
✓ Financial Planning✓ Net Worth Tracker✓ Monthly Budgeting✓ Travel Budget Planner✓ Annual Budgeting Planner✓ Monthly Expense Tracker✓ Annual Tax Planner✓ Retirement Planning
View Bundle →

Instant digital delivery · Terms & Conditions apply

Essentials Template - Excel & Google Sheets

Essentials Break-Even Analysis Spreadsheet Template for Google Sheets & Excel

Fixed and variable costs itemised on named lines rather than arriving as two totals, which is what makes the result worth acting on. The Essentials Break-Even Analysis spreadsheet template returns the contribution margin per unit and as a ratio, the break-even point in both units and revenue, monthly and annually, and a safety margin at a target you set. Every result is guarded, so a break-even point reads N/A rather than an error. Google Sheets and Excel. No macros, no VBA.

Instant digital delivery · Terms & Conditions apply

Essentials Break-Even Analysis spreadsheet template - Google Sheets and Excel preview

What's Included

  • Fixed costs itemised on named lines rather than totalled
  • Variable costs itemised per unit on lines of their own
  • Contribution margin per unit and as a ratio
  • Break-even point in units and revenue, monthly and annually
  • Every result checked, so no break-even point reports N/A rather than an error
  • Current units sold, with how far above or below break-even that is
  • A safety margin at your actual volume
  • Monthly profit or loss at that volume
  • The units and revenue a target profit would require
  • A price what-if block running the break-even point at five prices either side of yours
  • A break-even price: name the units you expect to sell and it returns the price that covers everything
  • A day-of-month break-even estimate at your current sales pace, with the profit days it leaves
  • Revenue, cost, profit and margin at five volume levels from a quarter of break-even to one and a half times it
  • Two charts on the dashboard

The FinancialAha Essentials Break-Even Analysis Spreadsheet Template for Google Sheets and Excel is a two-sheet workbook that itemises both sides of the calculation, with a How to Use guide on a third tab. It works as an Essentials Break-Even Analysis Excel template and an Essentials Break-Even Analysis Google Sheets template from the same download. This Essentials Break-Even Analysis spreadsheet template also answers the question after break-even: how far current sales sit above it, and what a target profit would take. No macros, no VBA.

Inside the workbook

What's inside the FinancialAha Essentials Break-Even Analysis spreadsheet template

The FinancialAha Essentials Break-Even Analysis Spreadsheet Template runs on two working sheets - one you fill in, one that reports back - plus the guide. It works in both Microsoft Excel and Google Sheets and here is what the Essentials Break-Even Analysis spreadsheet holds.

  1. 01 of 02

    Setup

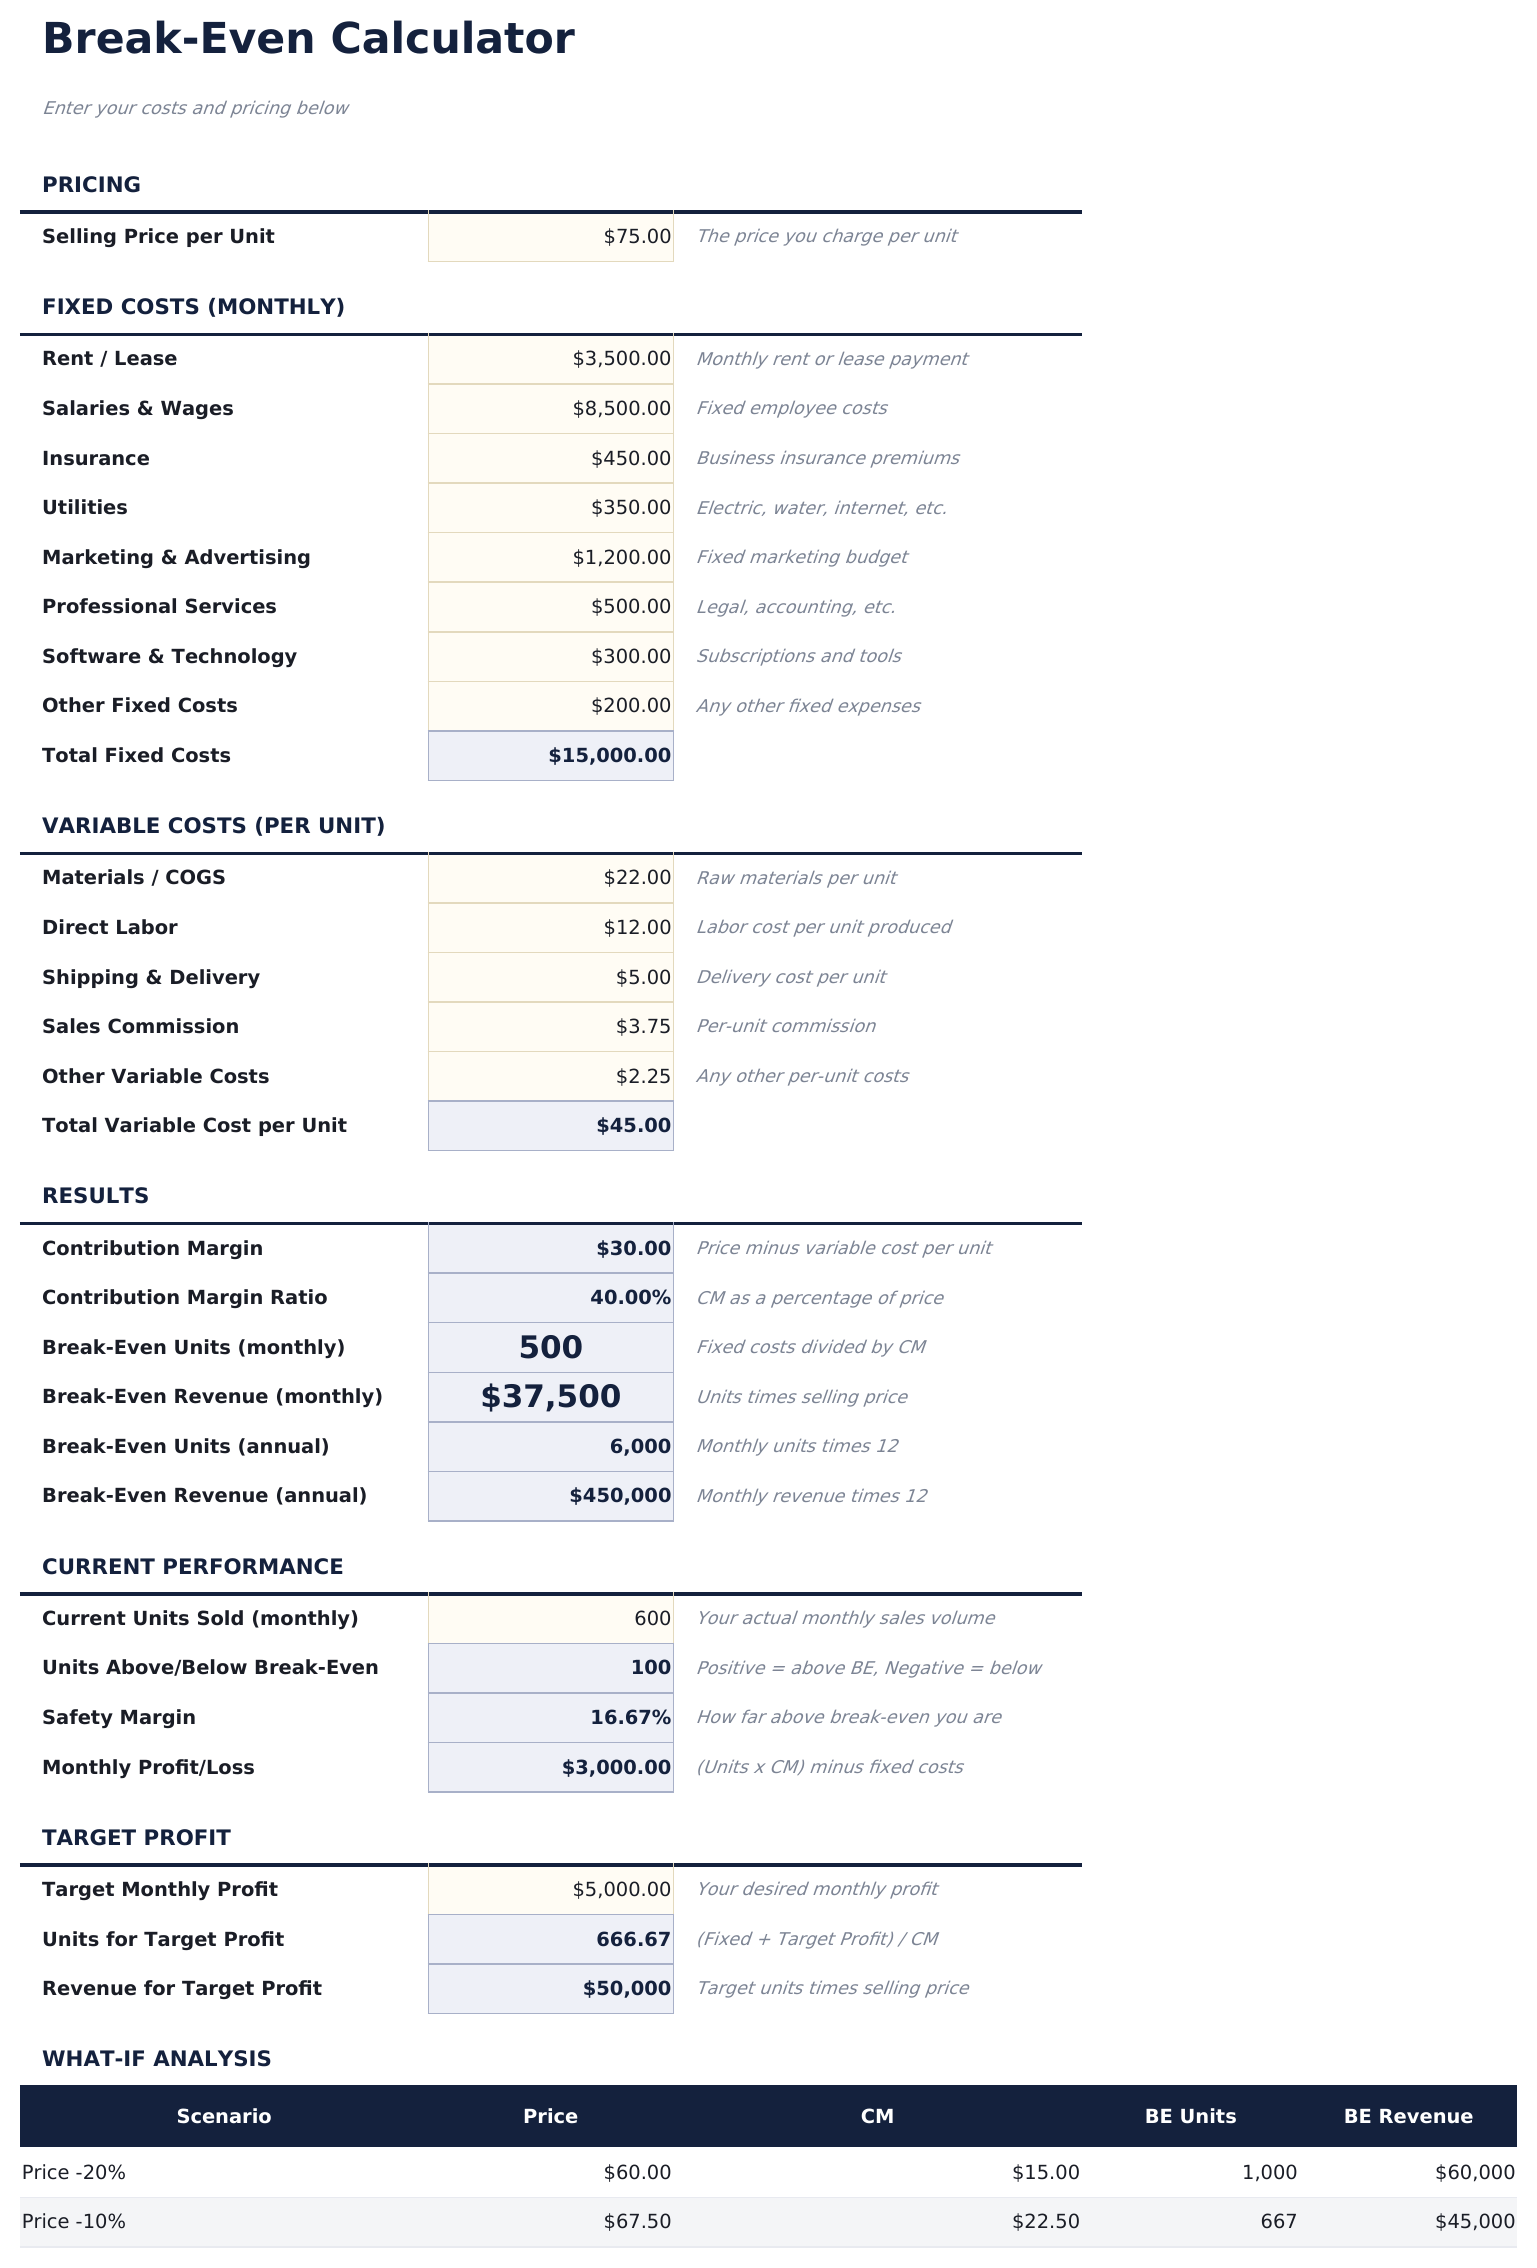
    The price at the top, then both sides of the cost base itemised rather than summarised. Named fixed lines cover rent, wages, insurance, utilities, marketing, professional services, software and anything else; five variable lines cover materials, direct labour, shipping, commission and the rest. Itemising matters because the commonest error in a break-even calculation is a fixed cost left out, and a list of named lines makes an omission visible in a way a single total never does. The results follow: the contribution margin per unit and as a ratio, then the break-even point in units and revenue, monthly and annually. Every one of those is checked first - if the price does not exceed the variable cost there is no break-even point at all, and the sheet says so rather than returning an error or a negative figure that looks like an answer. Two blocks beneath go past break-even, which is where the sheet earns its tier. The current performance block takes what you actually sell and reports how far above or below the break-even point that is, the safety margin it represents, and the profit or loss it produces. The target profit block runs the calculation the other way: name a profit you want, and it returns the units and the revenue required to reach it. Break-even is a floor rather than a goal, and this is the part that treats it that way. Two more blocks run the question backwards. The what-if block puts your price down twenty and ten per cent, leaves it where it is, and puts it up ten and twenty, then reports the contribution margin, the break-even units and the break-even revenue at each - so the cost of a discount is a figure rather than a feeling. The next block asks the opposite question: name how many units you expect to sell, and it returns the price per unit that would cover everything at that volume. The sheet closes with two blocks on time and volume rather than price. Time to break even turns the break-even point into a day of a typical month, given what you currently sell, and reports the profit days that leaves in the rest of it - guarded to N/A where current sales never reach break-even at all. Volume analysis lays out revenue, total cost, profit or loss and margin at five points around the break-even level, from a quarter of it up to one and a half times it, so the shape of the result is visible on either side of the break-even point rather than only at it.

  2. 02 of 02

    Dashboard

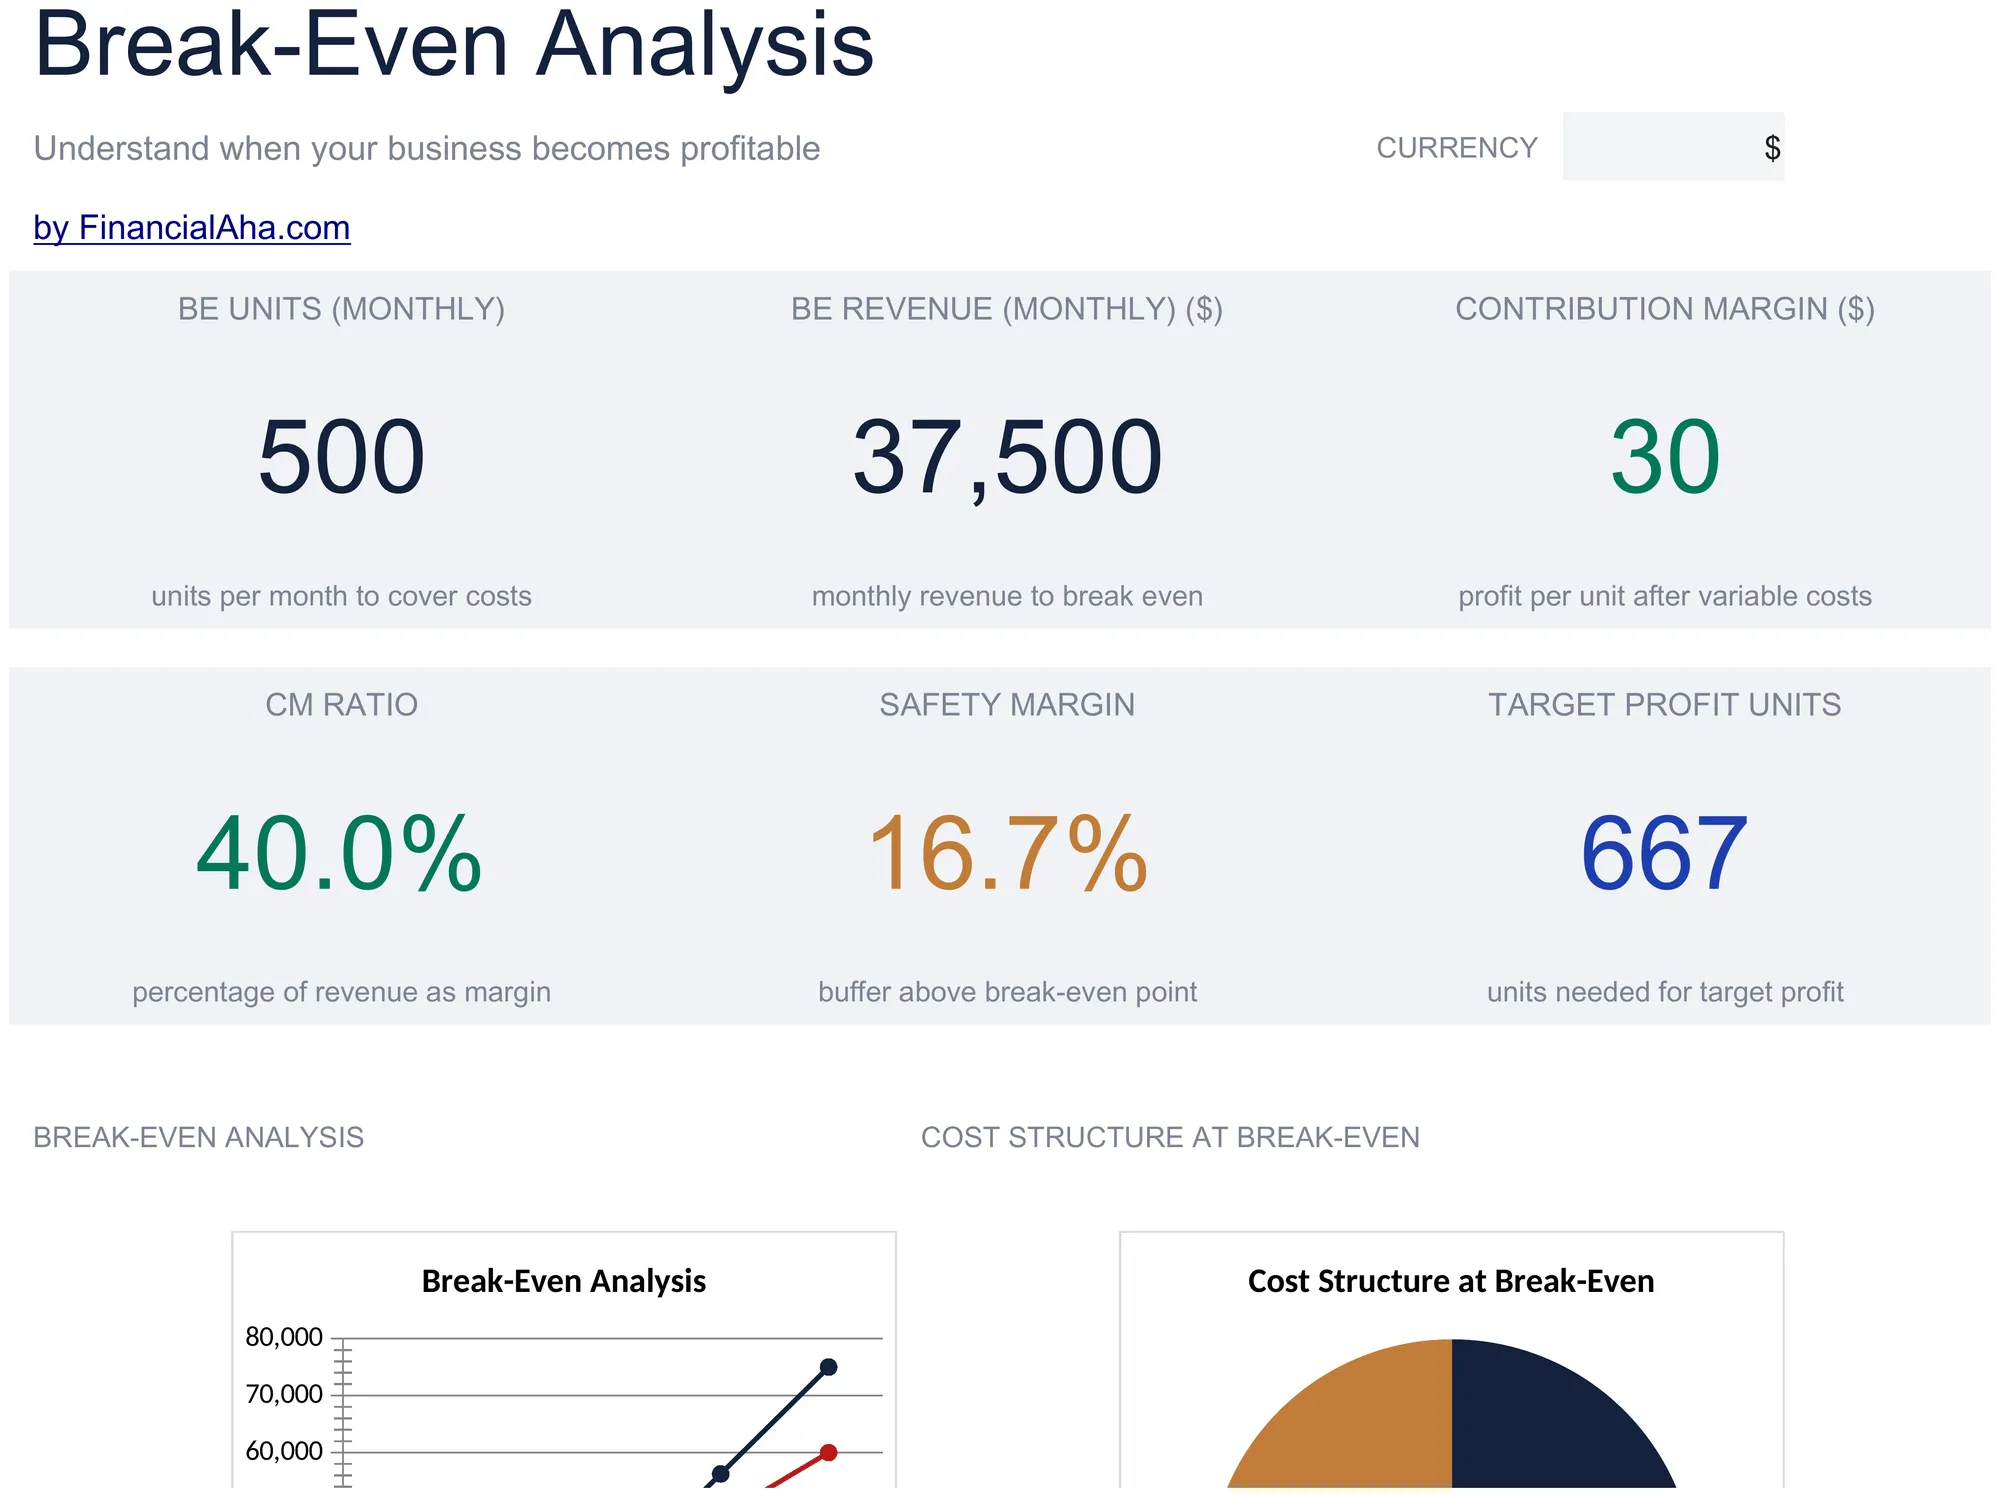
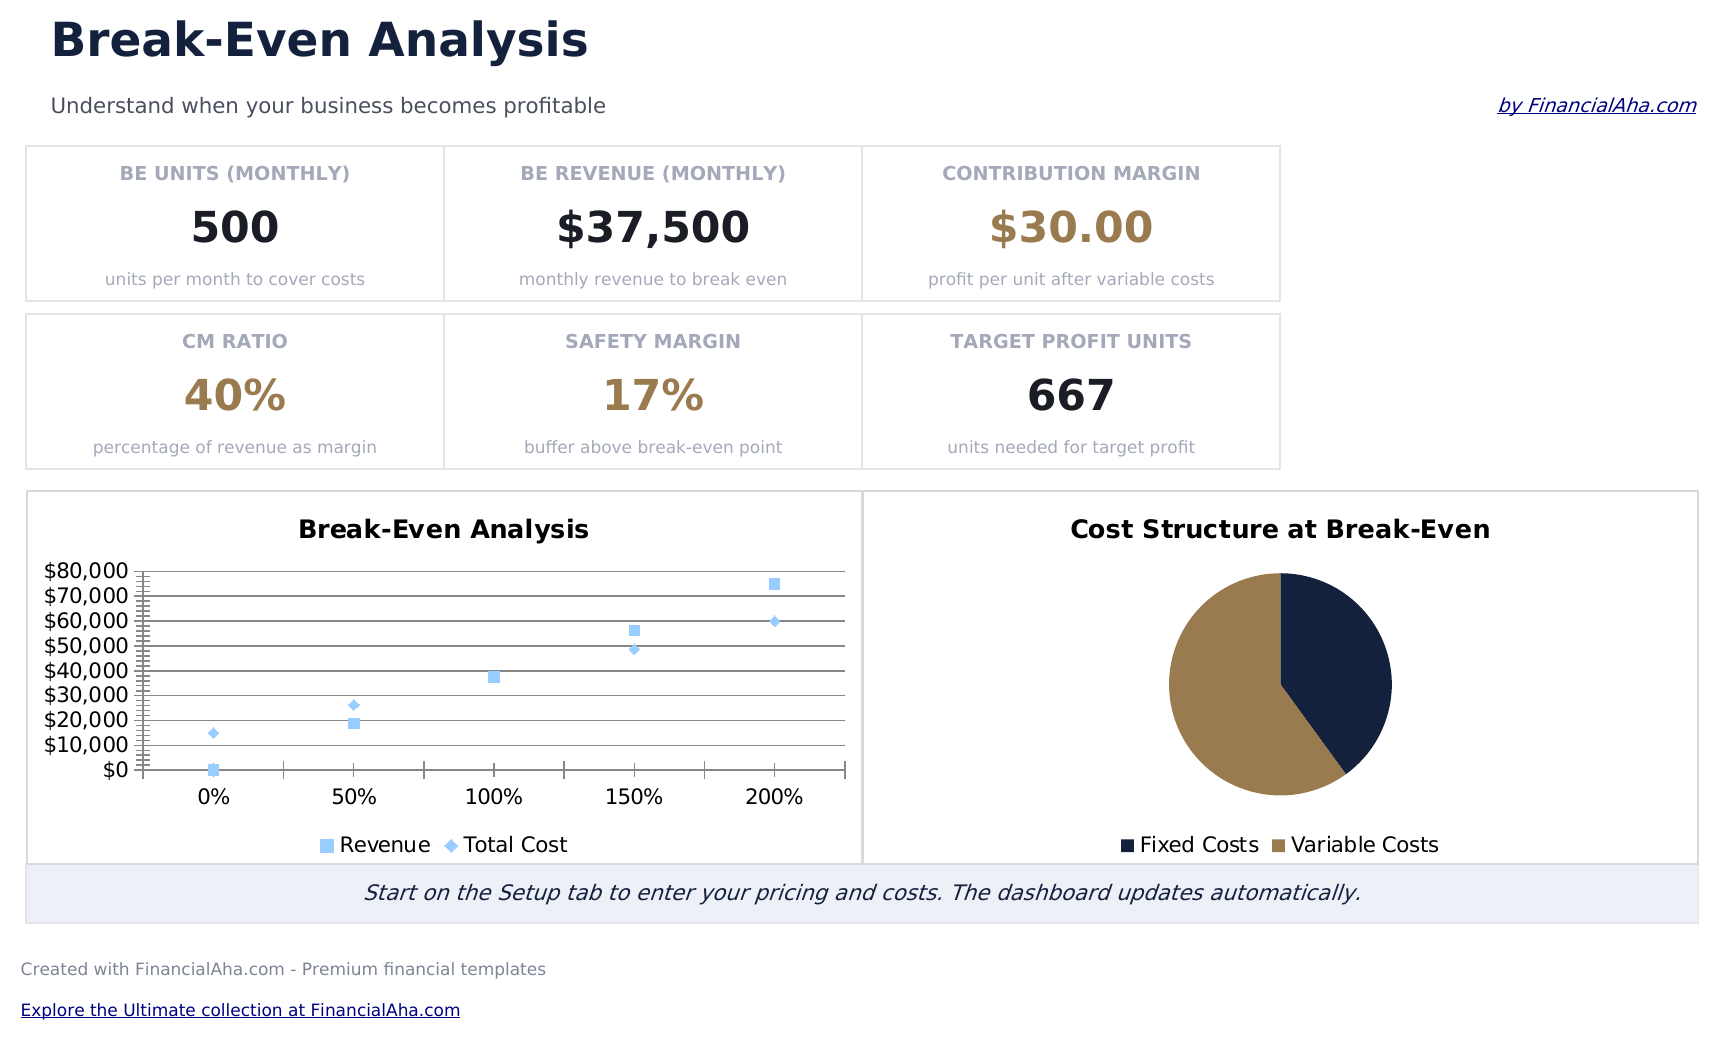
    Six figures. The top row is the contribution margin, the units per month needed to cover costs, and the revenue that represents. The row beneath is the margin as a ratio, the safety margin at what you actually sell, and the units a target profit would take - the three that say where you stand rather than where the floor is. Two charts sit alongside: a line chart running revenue against total cost as volume rises, and a pie splitting fixed from variable costs at the break-even point.

  3. Included guide

    How to Use

    A step-by-step guide on its own tab, covering what belongs in each cost block, how the margin drives everything, and how the target profit calculation reads. Because it ships inside the file, the instructions travel with the template wherever it is opened.

Works in both Google Sheets and Excel

Essentials Break-Even Analysis Spreadsheet template for Google Sheets

Upload the Essentials Break-Even Analysis Spreadsheet Template to Drive, right-click it, and choose "Open with Google Sheets". This Essentials Break-Even Analysis Google Sheets template needs no conversion step and both charts survive the trip intact - every guarded result recalculates exactly as it does in Excel. The currency dropdown on the Dashboard relabels the money fields on both sheets at once.

Essentials Break-Even Analysis Google Sheets template setup

A shared copy of the Essentials Break-Even Analysis Google Sheets template suits a pricing conversation between founders or with an accountant, since every cost line is visible and moving one shows its effect on the break-even point immediately. Sheets version history covers a figure typed over.

Sharing the Essentials Break-Even Analysis spreadsheet template as a Google Sheet

This is not a daily sheet. The Essentials Break-Even Analysis Google Sheet is worked through when a price, a cost or a fixed overhead changes, and the useful exercise is watching the safety margin move rather than the break-even point alone.

Essentials Break-Even Analysis Spreadsheet template for Excel

The Essentials Break-Even Analysis spreadsheet Excel download is a plain .xlsx. Excel opens this Essentials Break-Even Analysis Excel template directly, with no import step and no compatibility prompt, and both charts are native Excel charts that redraw as the inputs change. There are no macros and no VBA in the file.

Essentials Break-Even Analysis Excel template setup

The same Essentials Break-Even Analysis Excel template opens in Excel on Windows, Excel on Mac, and Excel for the web. It is also the identical file you would upload to Drive, so there is no separate Essentials Break-Even Analysis spreadsheet download to choose between.

Essentials Break-Even Analysis spreadsheet Excel notes

The Essentials Break-Even Analysis spreadsheet Excel file carries no macros and no VBA, so Excel opens it without a trust prompt - which matters when the figures go into a plan a lender or investor will read.

Opening the Essentials Break-Even Analysis spreadsheet Excel file

Nothing in the Essentials Break-Even Analysis Excel template is version-specific, so this Essentials Break-Even Analysis spreadsheet Excel workbook behaves identically in Excel on Windows, Excel on Mac, and older builds.

Spreadsheet template highlights

What the Essentials Break-Even Analysis spreadsheet template tracks

Both sides of the cost base are itemised. These are the figures the Essentials Break-Even Analysis Spreadsheet Template works from and returns:

Selling Price per Unit
what you charge
Fixed costs
named lines from rent and wages through to software
Variable costs
per-unit lines from materials through to commission
Contribution Margin auto
derived, what each sale leaves toward the fixed costs
Contribution Margin Ratio auto
derived, that margin as a share of the price
Break-Even Units auto
derived, monthly and annually, and N/A where none exists
Break-Even Revenue auto
derived, on the same basis
Current Units Sold
what you actually sell each month
Safety Margin auto
derived, how far above the break-even point that leaves you
Target Monthly Profit
a profit you want, and the units and revenue it needs
Price scenarios auto
derived, the break-even point at your price and at ten and twenty per cent either side of it
Expected Units Sold
what you think you can sell, and the break-even price per unit that follows from it
Days to Break Even auto
derived, the day of a typical month sales are expected to cover costs at your current volume
Volume Analysis auto
derived, revenue, cost, profit and margin at five levels from 25% to 150% of break-even

Compare builds

FinancialAha Break-Even Analysis spreadsheet template: Free and Essentials compared

Feature Free View Spreadsheet Template Essentials This page
Working sheets 1 2
Fixed costs One total you supply 8 itemised lines
Variable costs One per-unit figure 5 itemised lines
Contribution margin Per unit and as a share Per unit and as a share
Break-even units and revenue Monthly Monthly and annual
Guarded when no break-even exists Yes Yes
Safety margin at current volume Yes
Units needed for a target profit Yes
Price what-if Five prices, with break-even at each
Break-even price from expected volume Yes
Charts 2

The FinancialAha Essentials Break-Even Analysis Spreadsheet Template covers two working sheets and itemises both sides of the calculation, fixed costs and variable ones on named lines, where the Free Break-Even Analysis Spreadsheet Template takes a single total for each. It reports the break-even point monthly and annually, says N/A where no break-even point exists rather than returning an error, and adds what the free build has no equivalent of: the safety margin at your current sales volume, the units a target profit would require, a what-if block running the break-even point at five prices either side of yours, and a break-even price worked back from the volume you expect to sell. Two charts sit alongside.

Good to know

Notes on working in the Essentials Break-Even Analysis spreadsheet template

  • Itemising the fixed costs is the point. The commonest error in a break-even calculation is an overhead left out, and named lines make that visible.
  • Every result is checked first, so a price at or below the variable cost reports N/A rather than an error or a negative that looks like an answer.
  • The safety margin is more useful day to day than the break-even point itself, because it says how much room a fall in sales would leave.
  • Break-even is a floor rather than a goal, which is what the target profit block is for.
  • The what-if block is the one to look at before discounting. A ten per cent price cut does not raise the break-even point by ten per cent, because the whole cut comes out of the margin rather than the price.
  • The last block inverts the calculation - it takes the volume you expect and returns the price that covers everything, which is the question a quote often actually poses.
  • The currency dropdown sits on the Dashboard and relabels money fields across the whole Essentials Break-Even Analysis spreadsheet. It changes the label only and does not convert the numbers.

How to Use the Essentials Break-Even Analysis Spreadsheet Template

1

Set the price

What you charge per unit, at the top of the setup sheet.

2

Itemise fixed costs

Give each fixed cost a named line, so an overlooked overhead is visible.

3

Itemise variable costs

Five per-unit lines from materials to commission.

4

Add your volume

What you actually sell, and the profit you are aiming for.

Stress-tested with AI.

Every template starts with deep research into how people actually track the topic. We design the layout, build the formulas, and polish the design until it feels like something we would use ourselves. Along the way, we use AI to stress-test the calculations: unusual inputs, edge cases, and formula behavior, checked until the numbers hold.

Instant digital delivery · Terms & Conditions apply

Frequently Asked Questions

Is the FinancialAha Essentials Break-Even Analysis Spreadsheet Template a Google Sheets template?

Yes. Upload the file to Drive and choose "Open with Google Sheets". The Essentials Break-Even Analysis Google Sheets template needs no conversion step and both charts survive the trip intact.

Is the FinancialAha Essentials Break-Even Analysis Spreadsheet Template an Excel template?

Yes. The download is a plain .xlsx, so the Essentials Break-Even Analysis Excel template opens directly in Excel with no import step. Both charts are native Excel charts, and there are no macros or VBA.

Will the FinancialAha Essentials Break-Even Analysis spreadsheet Excel file open in older versions of Excel?

Yes. The Essentials Break-Even Analysis spreadsheet Excel workbook ships as a plain .xlsx, so it opens identically in current Excel and in builds that predate dynamic arrays.

Why itemise the fixed costs instead of entering a total?

Because the commonest error in a break-even calculation is an overhead left out, and named lines make an omission visible in a way a single total never does.

What happens if my price is below the variable cost?

Every result reports N/A rather than an error or a negative figure that looks like an answer. There is no break-even point in that situation, and the sheet says so.

What does the safety margin tell me?

How far your actual sales sit above the break-even point, which is more useful day to day than the break-even figure alone because it says how much room a fall in sales would leave.

What is the target profit block for?

Running the calculation the other way. Break-even is a floor rather than a goal, so you name a profit you want and it returns the units and revenue needed to reach it.

Does it show the break-even point annually as well?

Yes, in both units and revenue. The free build reports the monthly figures only.

How do I open the Essentials Break-Even Analysis spreadsheet template in Google Sheets?

Upload the .xlsx file to Google Drive, then open it with Google Sheets. All formulas and formatting will be preserved.

More Essentials Business Finance Templates

Essentials

Highlights:

Dashboard with charts and KPIs
Pre-filled categories and sample data
No sign-up, no subscription
Lifetime free updates
Works in
Excel Google Sheets

Looking for premium spreadsheet templates?

Our paid templates include advanced multi-sheet dashboards, native Excel charts, and ongoing updates.

Private & secure

Your financial data stays on your device. We never see it.

Learn more →

Need help?

Check our guides or reach out with questions.

View FAQ →