Break-evenanalyse Essentials-sjabloon
Bereken het break-evenpunt waar omzet alle kosten dekt. Voer vaste kosten, variabele kosten en prijzen in om het benodigde verkoopvolume te zien.
Wat zit erin
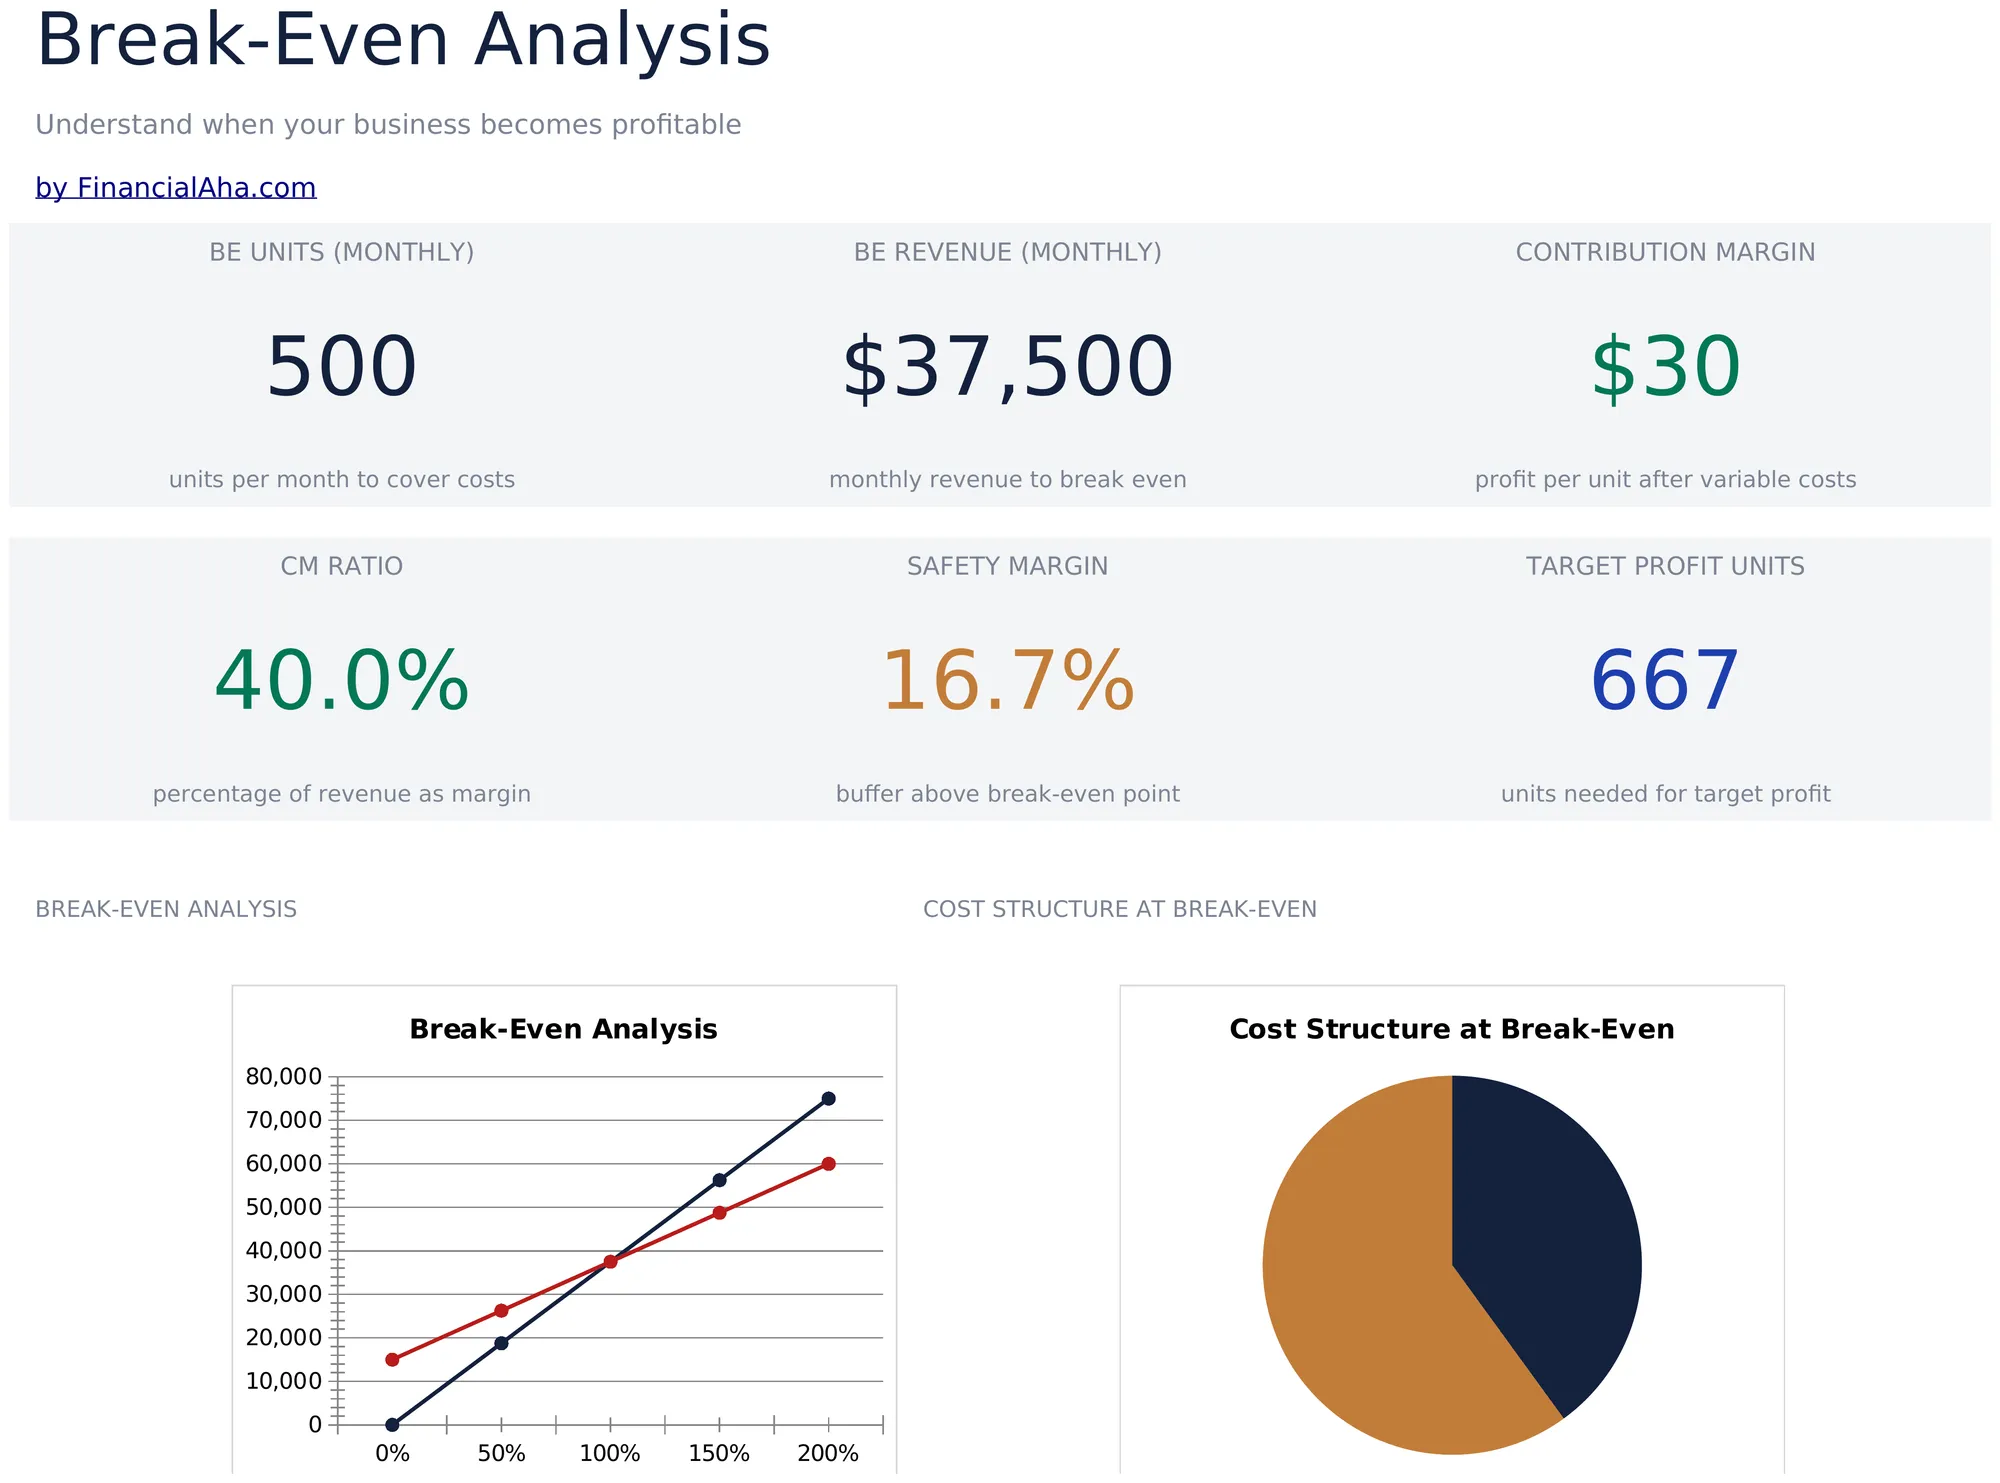
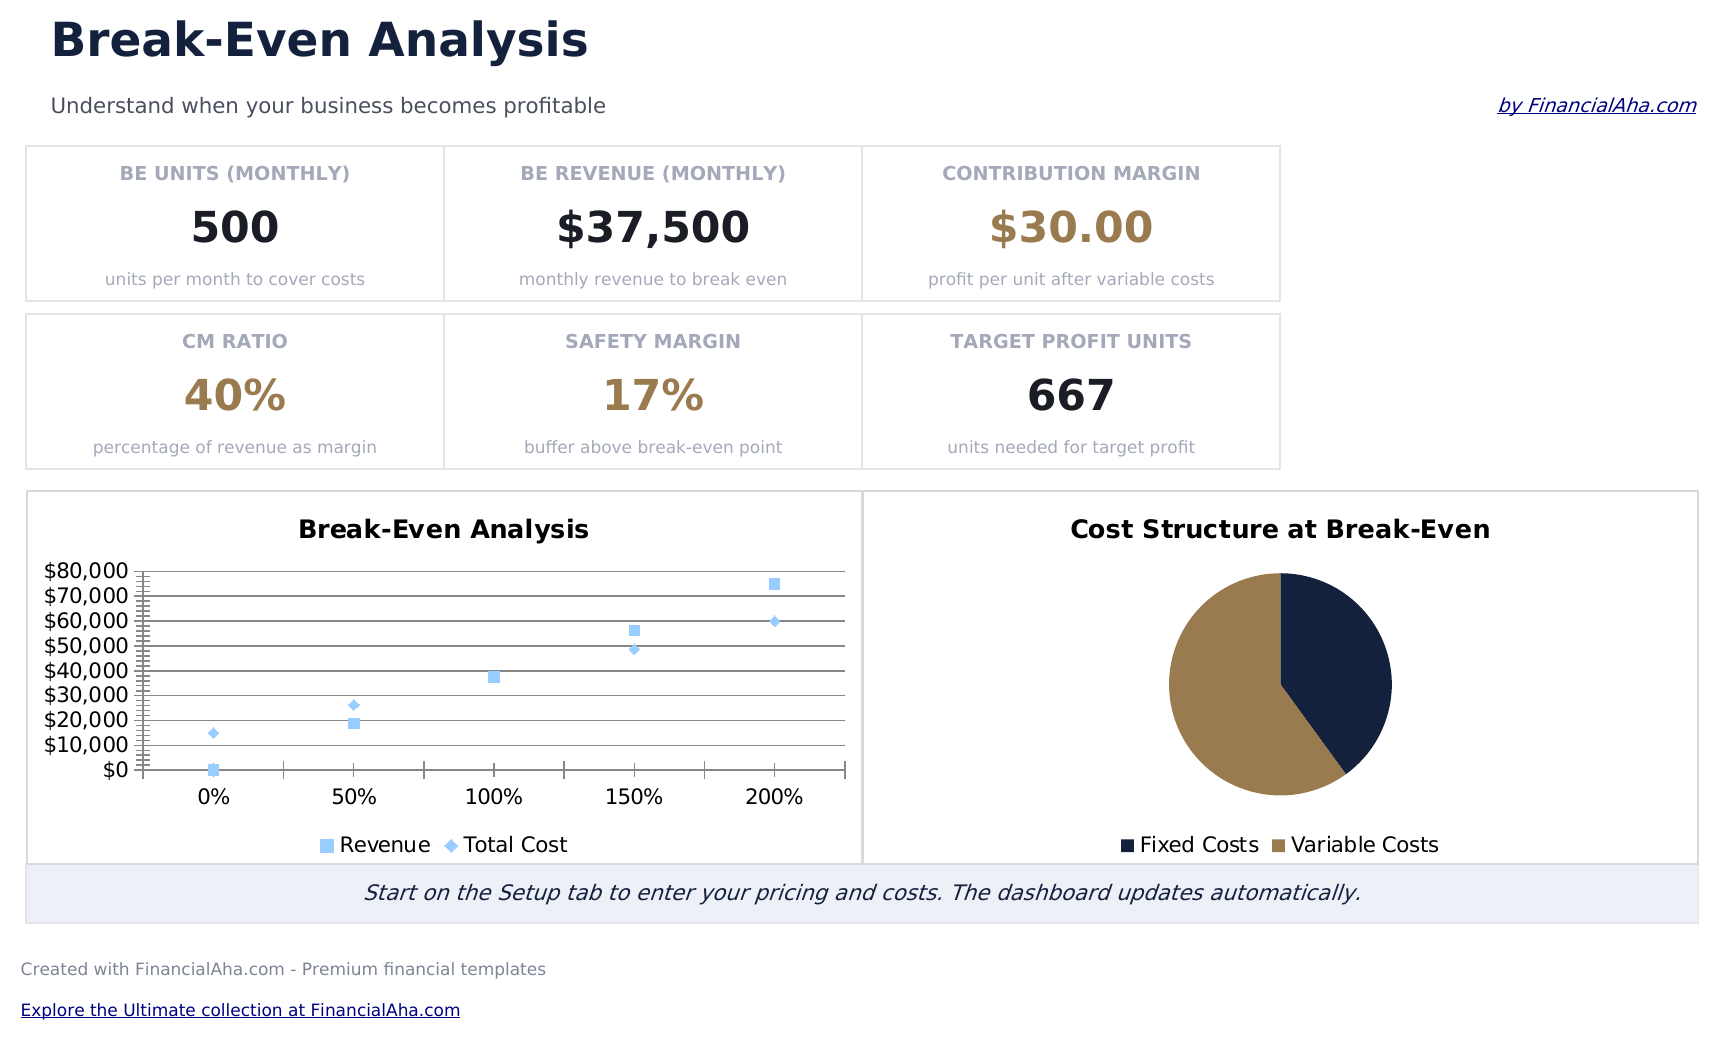
- Dashboard met break-evenpuntweergave die het exacte aantal eenheden en bedrag toont dat nodig is om alle kosten te dekken
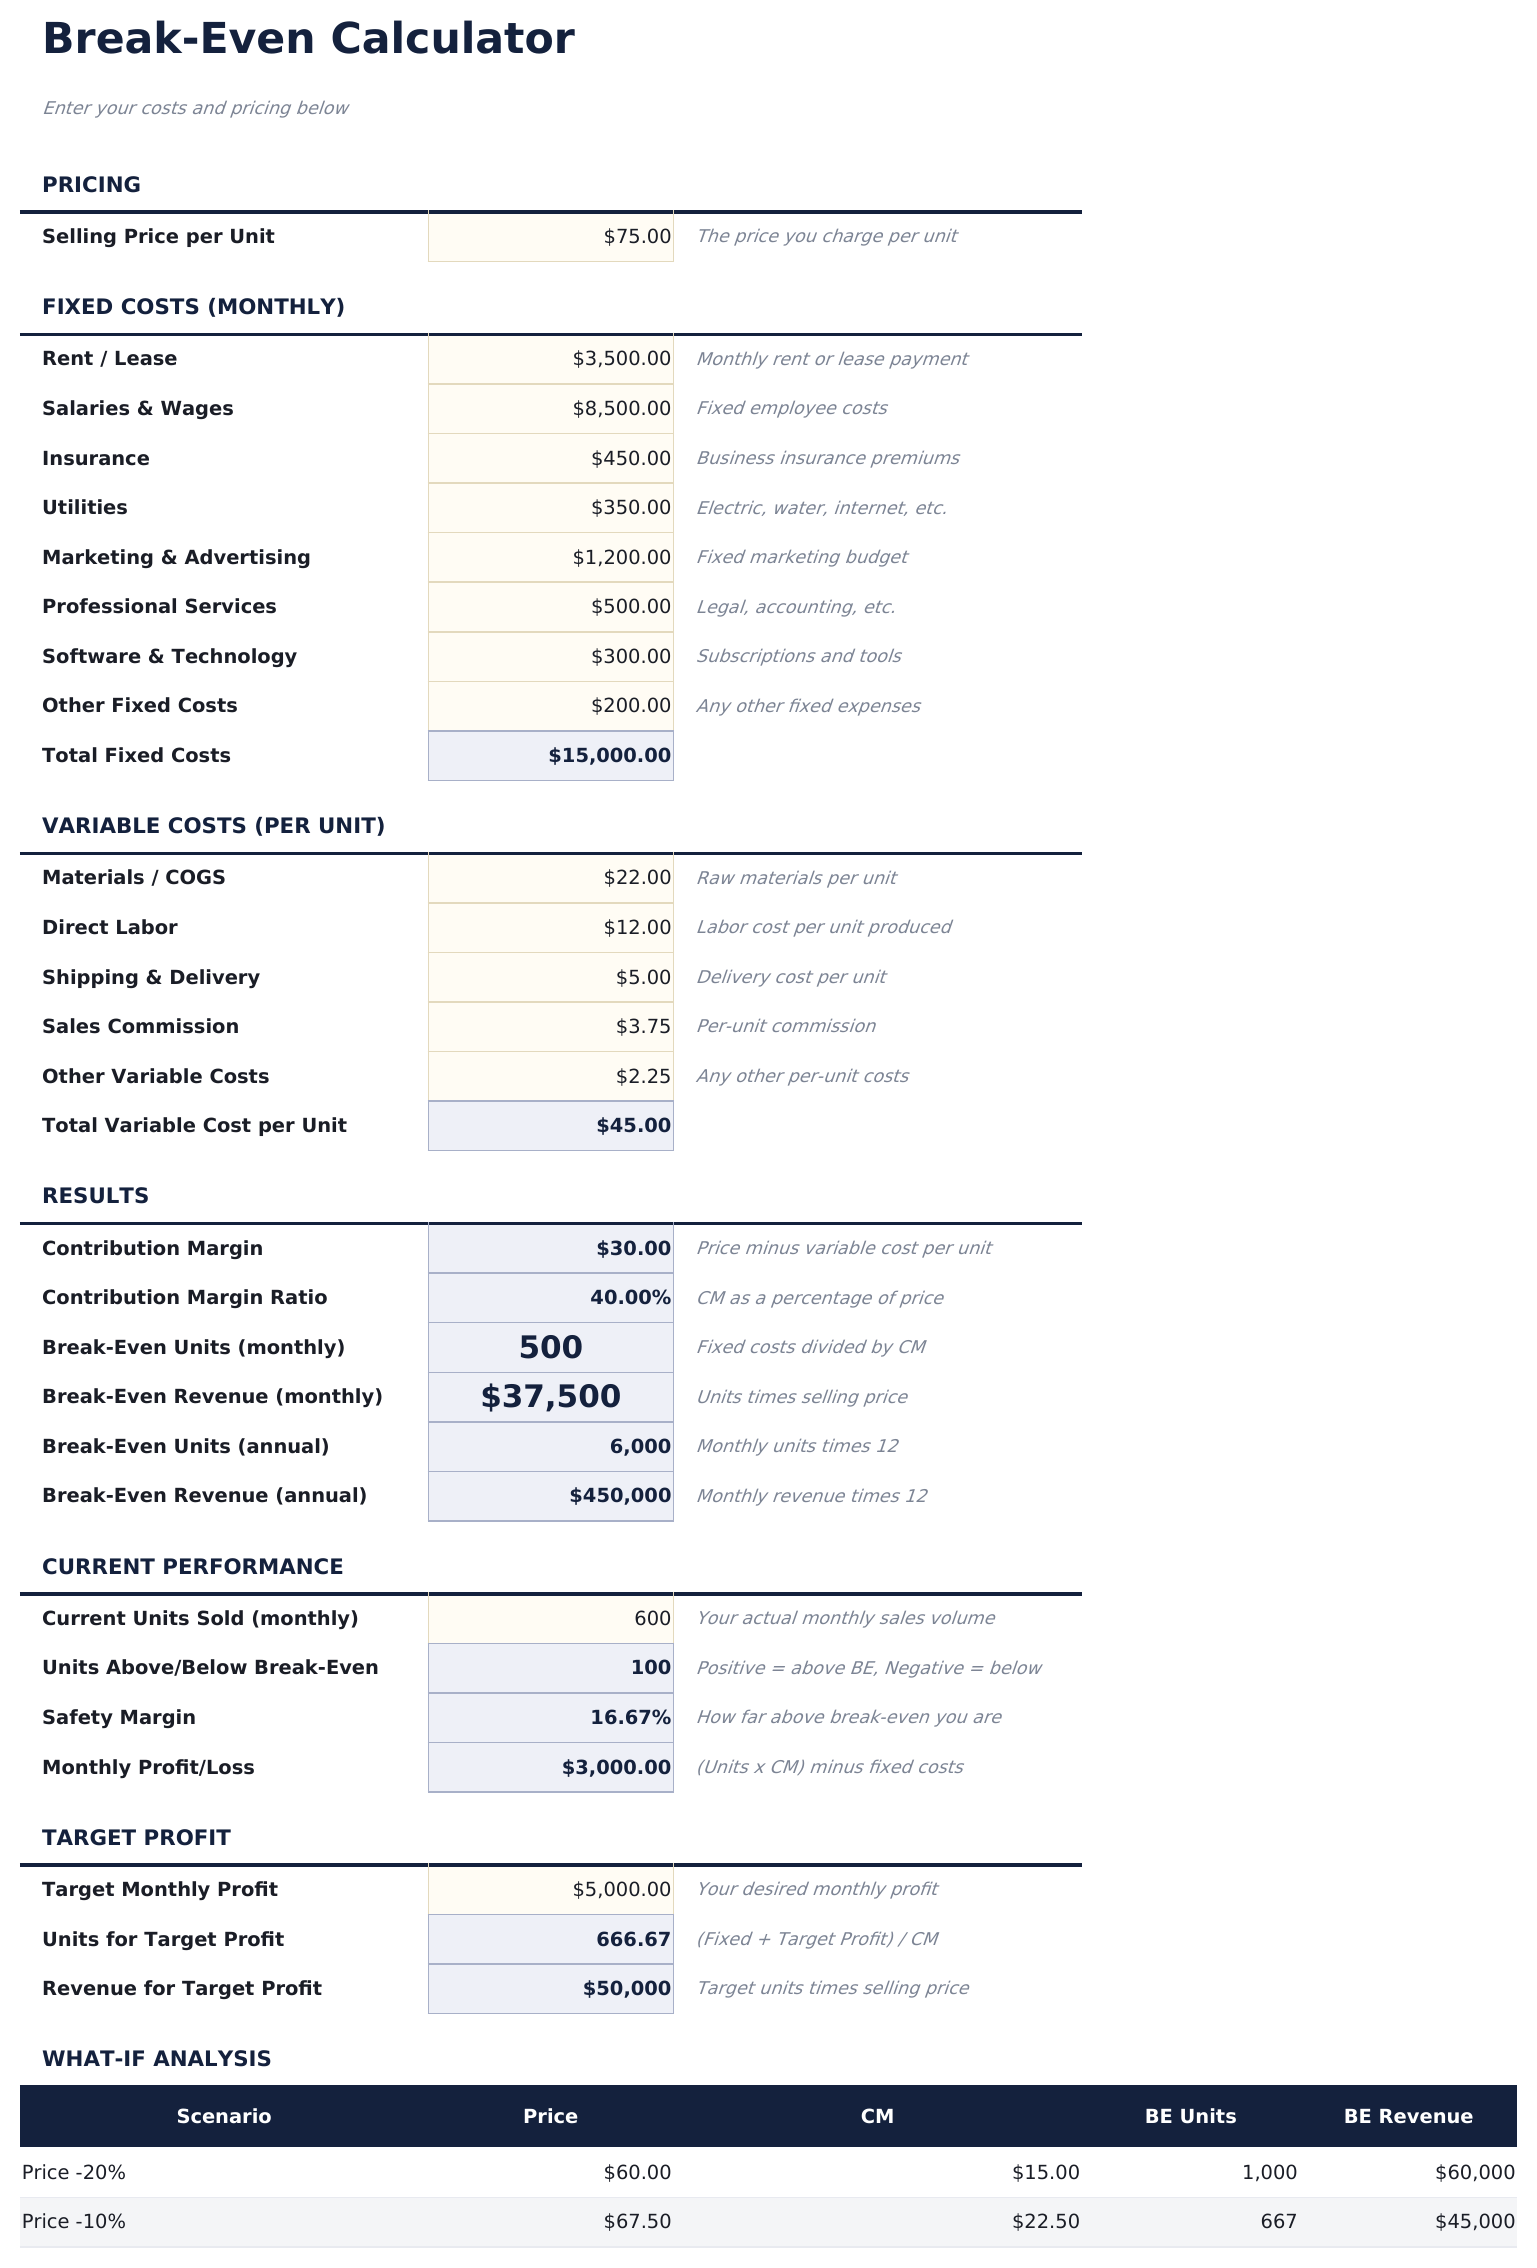
- Opstellingsblad met invoervelden voor totale vaste kosten, variabele kosten per eenheid en verkoopprijs per eenheid
- Break-even eenheids- en omzetberekeningen die automatisch bijwerken wanneer je kosten- of prijsinvoer aanpast
- Contributiemarge-analyse die de marge per eenheid toont en hoe elke verkoop bijdraagt aan het dekken van vaste kosten
- Gevoeligheidsanalyse voor prijswijzigingen met kleurgecodeerde invoercellen die het break-evenpunt bij verschillende prijsniveaus tonen
- Werkt in Microsoft Excel, Google Sheets en LibreOffice Calc zonder installatie
Voorbeeld
Bekijk wat er in dit sjabloon zit
Hoe gebruik je dit Break-evenanalyse sjabloon
Vaste kosten invoeren
Voer totale vaste kosten in - huur, salarissen, verzekeringen en andere kosten die niet veranderen met het verkoopvolume.
Variabele kosten invoeren
Voeg de variabele kosten per eenheid toe - materialen, arbeid en andere kosten die toenemen met elke verkochte eenheid.
Verkoopprijs instellen
Voer de verkoopprijs per eenheid in. De contributiemarge (prijs minus variabele kosten) wordt automatisch berekend.
Het break-evenpunt aflezen
Het dashboard toont het break-evenpunt in eenheden en bedrag - het exacte verkoopvolume dat nodig is om alle vaste en variabele kosten te dekken.
Customer Reviews
What Our Customers Say
"If I get half as good at handling my finances as you are at customer service, this'll be the best $26 I've spent lately."
"Great tool! Simplifies financial planning without the hassle of complex spreadsheets."
"I recently purchased your super convenient spreadsheet, it really helps me!"
"They're great and super intuitive. Thank you!"
Gebouwd door Claude AI. Verfijnd door ons.
We gebruiken Claude AI om elk sjabloon te ontwerpen, na uitgebreid onderzoek. Daarna neemt ons team het over. We verfijnen de indeling, testen elke formule grondig, lossen randgevallen op en polijsten het ontwerp totdat het iets is dat we zelf ook echt zouden gebruiken. De AI brengt ons 80% van de weg. De laatste 20% is puur menselijk oordeel.
Veelgestelde vragen
Wat is de contributiemarge?
De contributiemarge is de verkoopprijs minus de variabele kosten per eenheid. Het vertegenwoordigt hoeveel elke verkoop bijdraagt aan het dekken van vaste kosten.
Wat als ik meerdere producten verkoop?
Gebruik een gewogen gemiddelde verkoopprijs en variabele kosten over je productmix. Het break-evenpunt geldt voor het gemengde product.
Hoe gebruik ik de gevoeligheidsanalyse?
Wijzig de verkoopprijs om te zien hoe het break-evenpunt verschuift bij verschillende prijsniveaus. Lagere prijzen vereisen meer eenheden om quitte te spelen.
Houdt dit rekening met belastingen?
Nee. Break-evenanalyse dekt alleen kosten. Het break-evenpunt is waar de omzet gelijk is aan de totale kosten voor eventuele belastingoverwegingen.
Hoe open ik dit in Google Sheets?
Upload het .xlsx-bestand naar Google Drive en open het vervolgens met Google Sheets. Alle formules en opmaak blijven behouden.
Meer Essentials-sjablonen voor Bedrijfsfinancien
Hoogtepunten:
Op zoek naar premium spreadsheet-sjablonen?
Onze betaalde sjablonen bevatten geavanceerde dashboards met meerdere werkbladen, ingebouwde Excel-grafieken en doorlopende updates.
Krijg in plaats daarvan elk Ultimate sjabloon
Alle 58 Ultimate sjablonen in één aankoop voor $299 - $1,102 waarde, u houdt $803 over.