Análisis de Punto de Equilibrio Plantilla Essentials
Calcula el punto de equilibrio donde los ingresos cubren todos los costos. Ingresa costos fijos, costos variables y precios para ver el volumen de ventas requerido.
Qué incluye
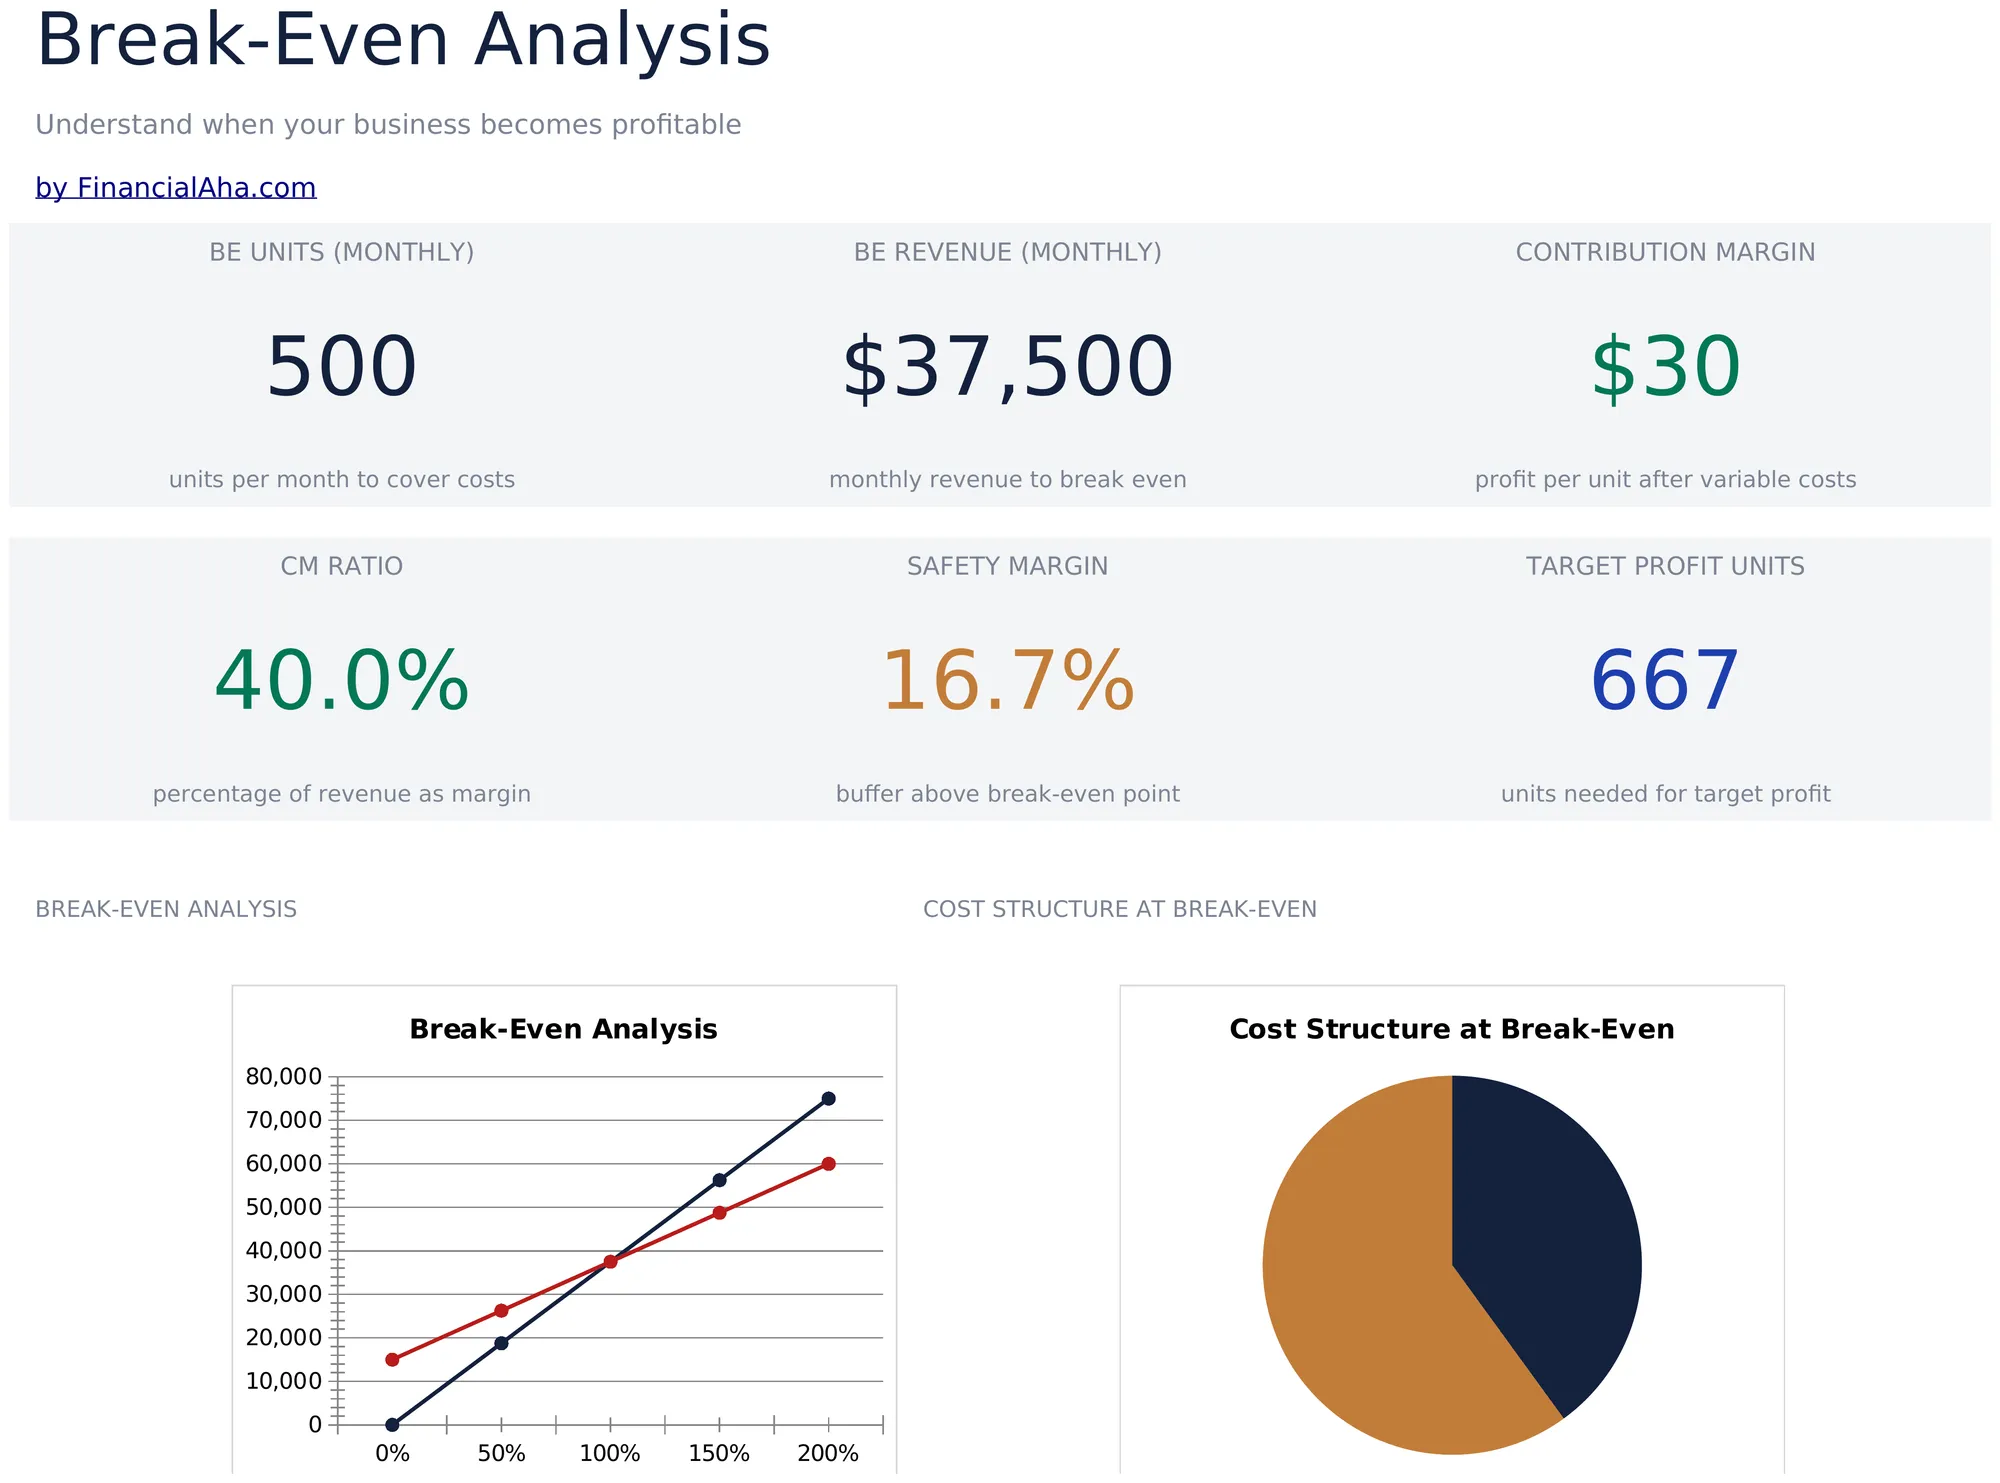
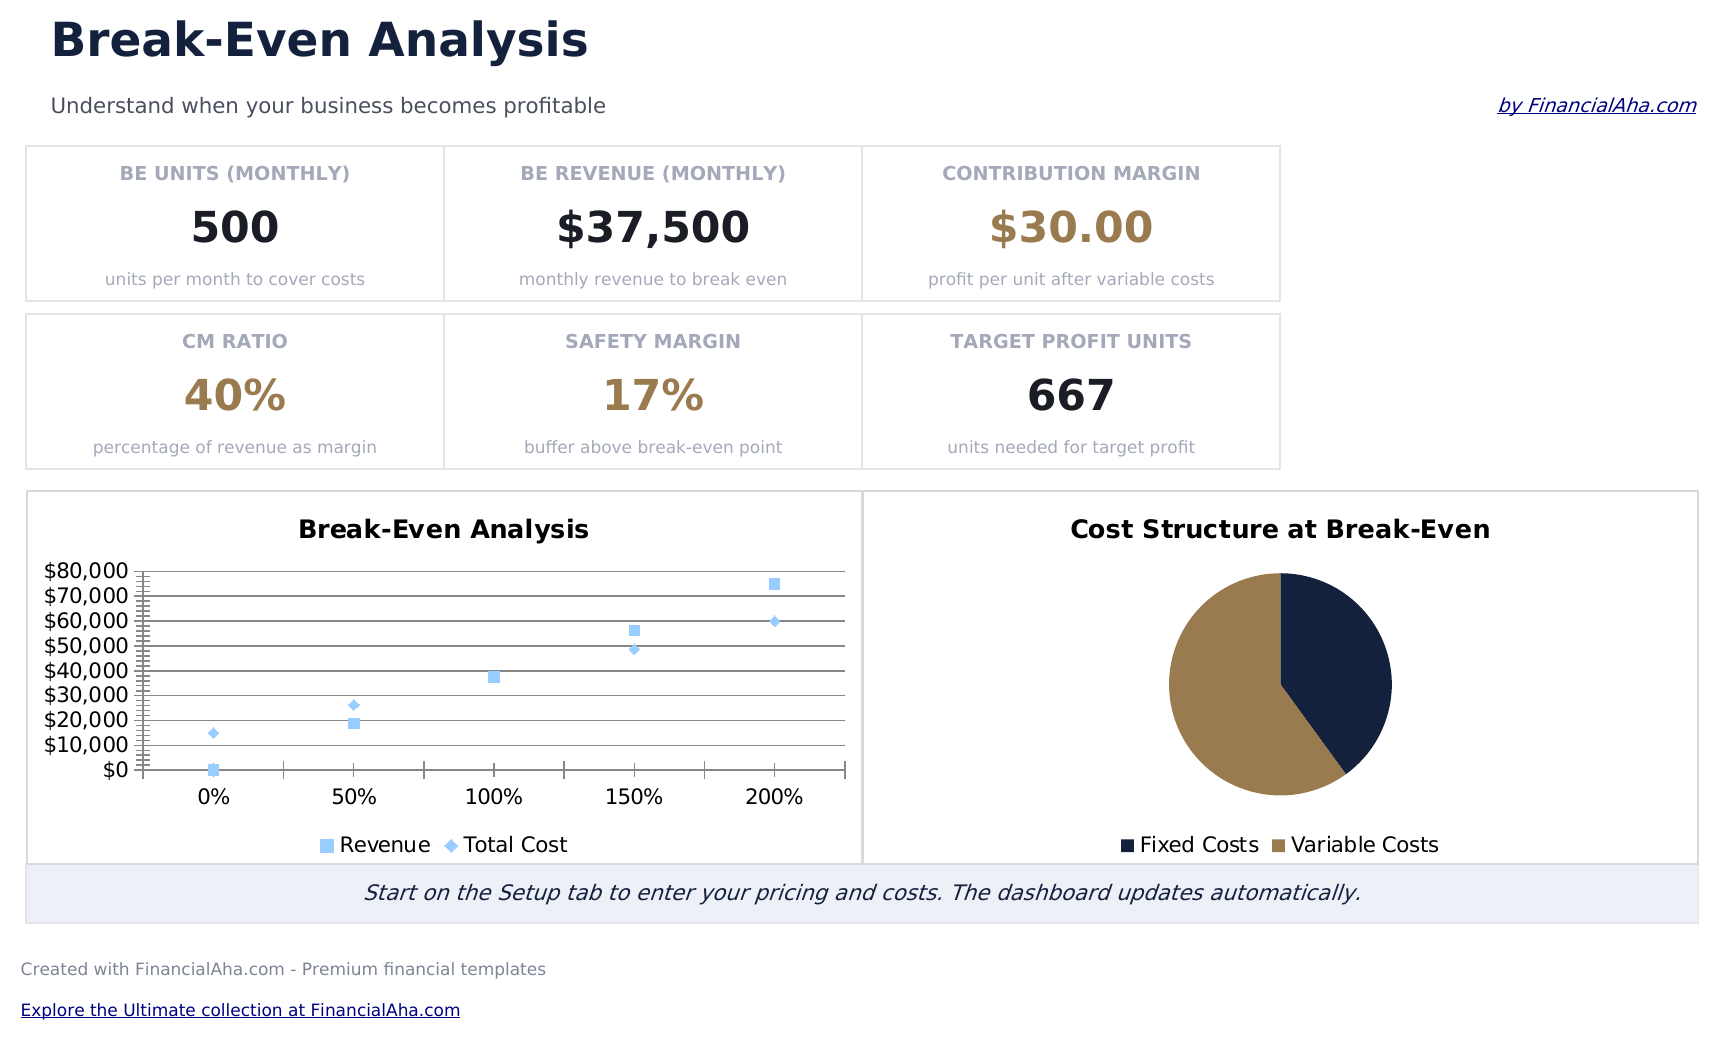
- Panel con visualización del punto de equilibrio mostrando el número exacto de unidades y monto en dólares necesario para cubrir todos los costos
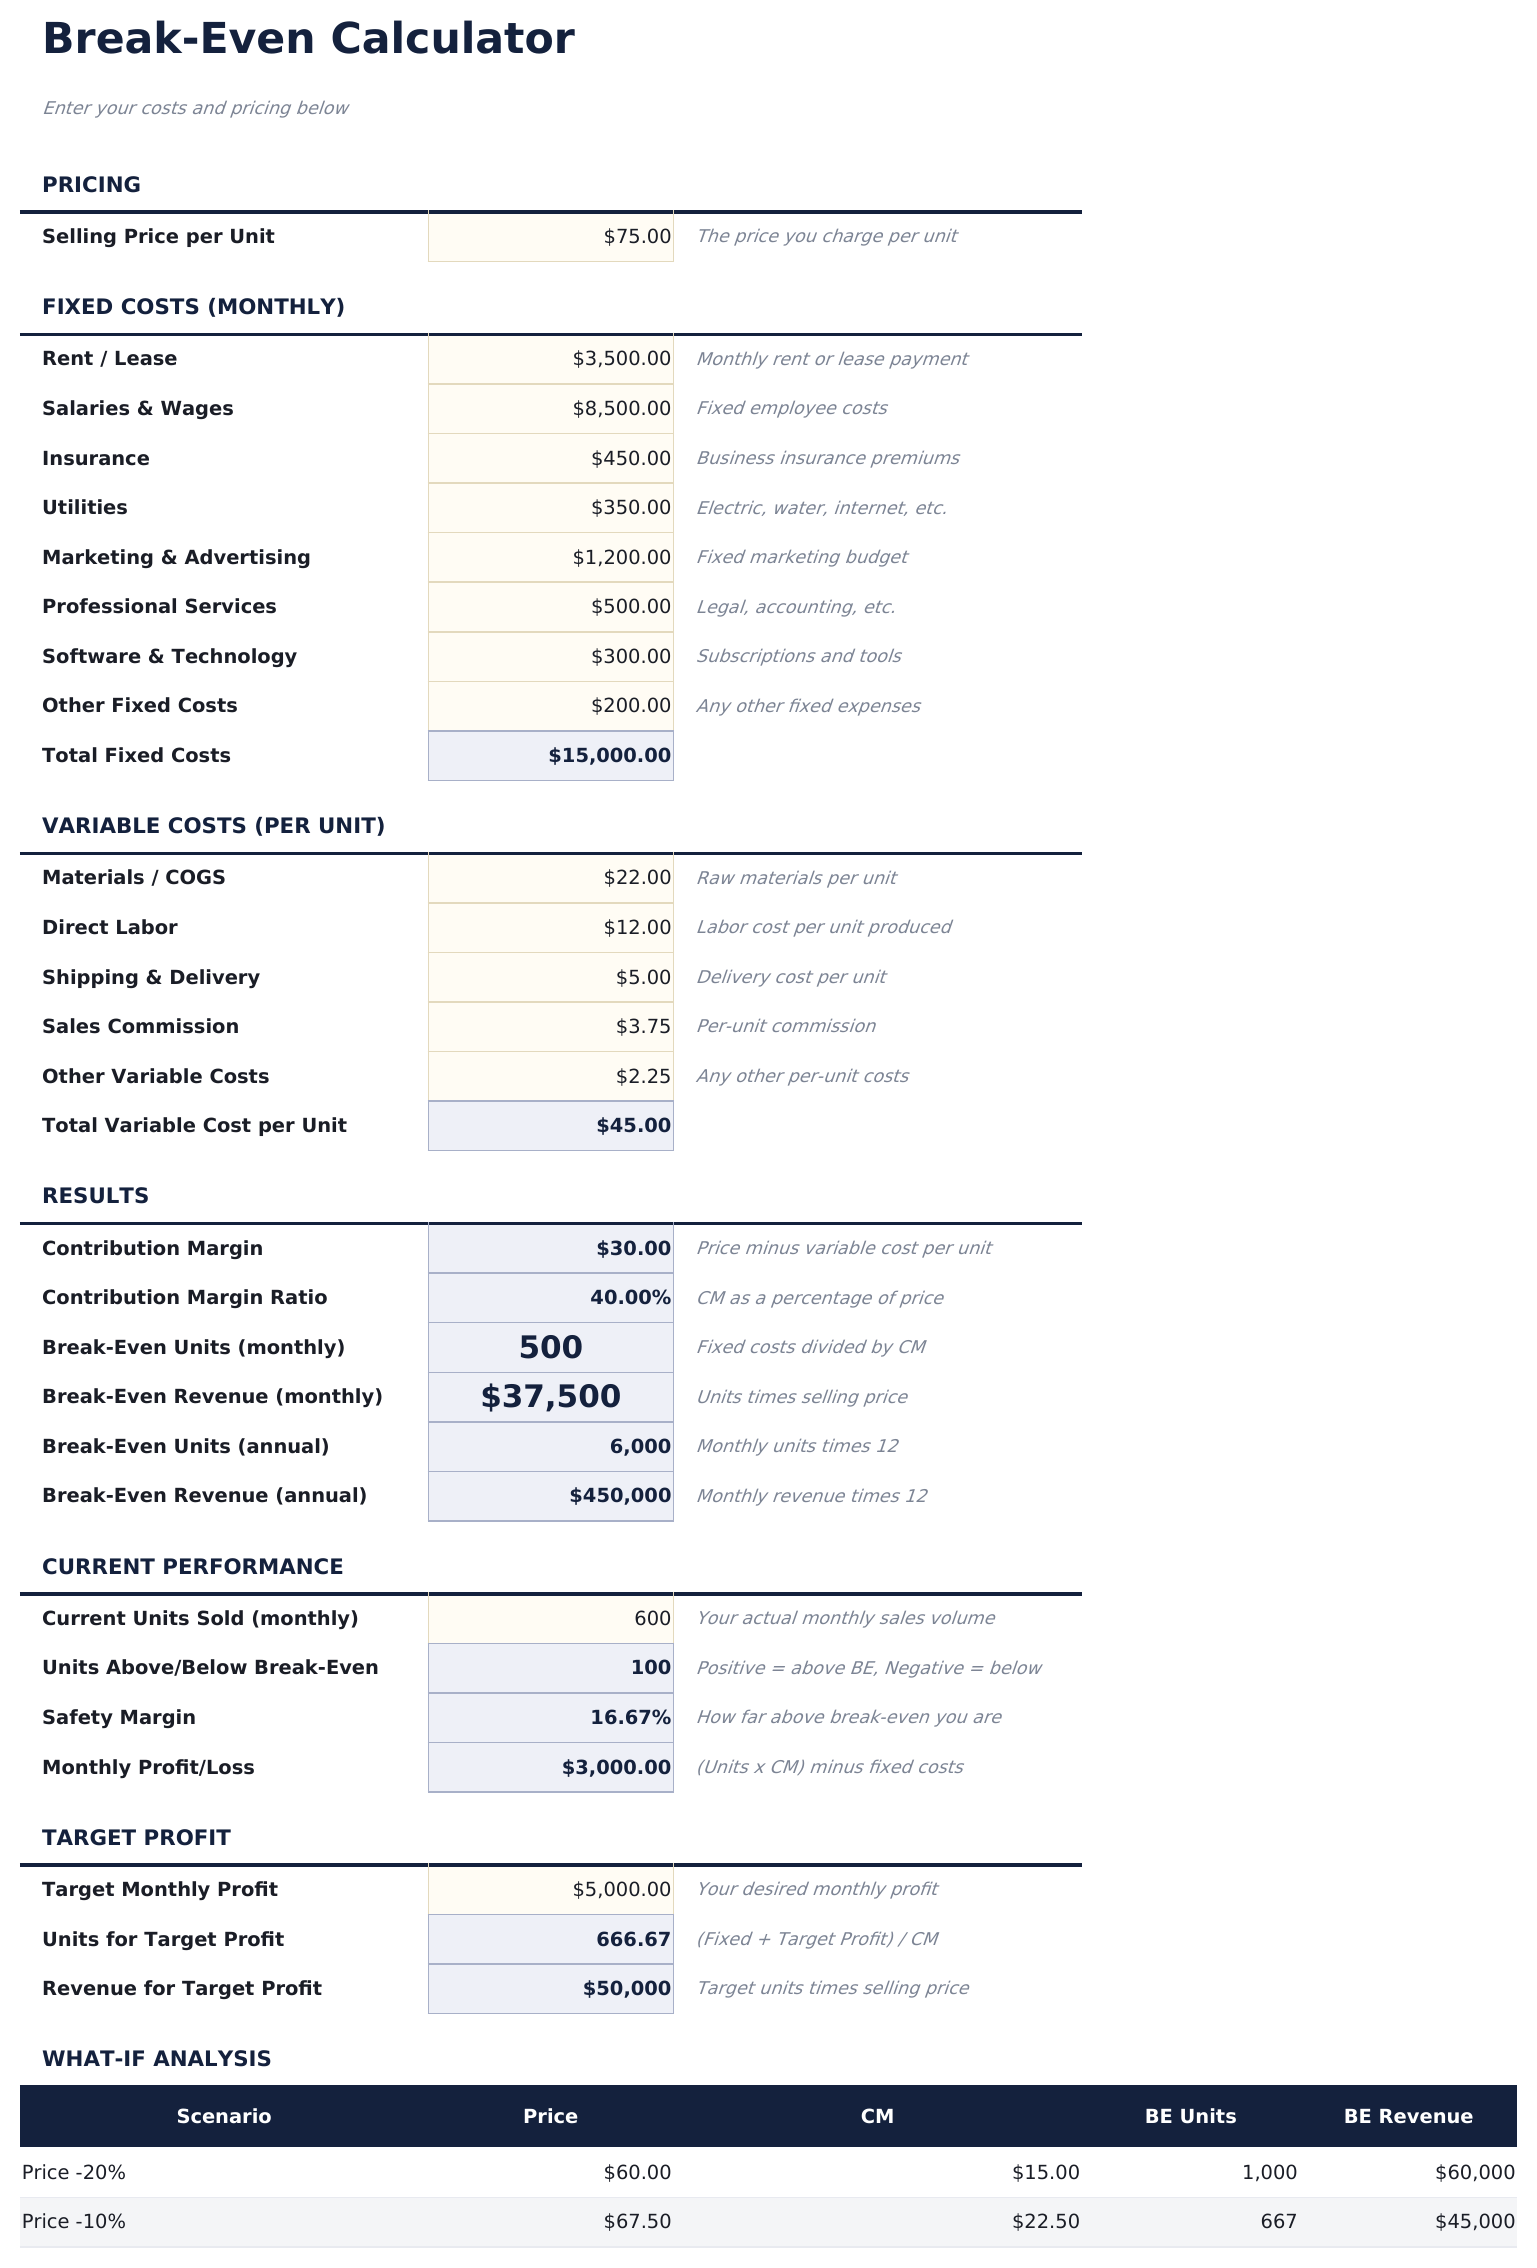
- Hoja de configuración con entradas para costos fijos totales, costo variable por unidad y precio de venta por unidad
- Cálculos de unidades e ingresos de equilibrio que se actualizan automáticamente cuando ajustas los costos o precios
- Análisis de margen de contribución mostrando el margen por unidad y cómo cada venta contribuye a cubrir los costos fijos
- Análisis de sensibilidad para cambios de precio con celdas de entrada con código de color mostrando el punto de equilibrio a diferentes niveles de precio
- Funciona en Microsoft Excel, Google Sheets y LibreOffice Calc sin configuración necesaria
Vista previa
Mira qué contiene esta plantilla
Cómo usar esta plantilla de Análisis de Punto de Equilibrio
Ingresa los costos fijos
Ingresa los costos fijos totales - renta, salarios, seguros y otros gastos que no cambian con el volumen de ventas.
Ingresa los costos variables
Agrega el costo variable por unidad - materiales, mano de obra y otros costos que aumentan con cada unidad vendida.
Establece el precio de venta
Ingresa el precio de venta por unidad. El margen de contribución (precio menos costo variable) se calcula automáticamente.
Lee el punto de equilibrio
El panel muestra el punto de equilibrio en unidades y dólares - el volumen de ventas exacto necesario para cubrir todos los costos fijos y variables.
Customer Reviews
What Our Customers Say
"If I get half as good at handling my finances as you are at customer service, this'll be the best $26 I've spent lately."
"Great tool! Simplifies financial planning without the hassle of complex spreadsheets."
"I recently purchased your super convenient spreadsheet, it really helps me!"
"They're great and super intuitive. Thank you!"
Creadas por Claude AI. Perfeccionadas por nosotros.
Usamos Claude AI para crear el borrador de cada plantilla, después de una investigación profunda. Luego nuestro equipo interviene. Refinamos el diseño, probamos cada fórmula a fondo, corregimos casos especiales y pulimos el diseño hasta que se siente como algo que realmente usaríamos nosotros mismos. La IA nos lleva al 80%. El último 20% es criterio humano.
Preguntas frecuentes
¿Qué es el margen de contribución?
El margen de contribución es el precio de venta menos el costo variable por unidad. Representa cuánto contribuye cada venta a cubrir los costos fijos.
¿Qué pasa si vendo múltiples productos?
Usa un precio de venta promedio ponderado y costo variable a través de tu mezcla de productos. El punto de equilibrio aplica al producto combinado.
¿Cómo uso el análisis de sensibilidad?
Cambia el precio de venta para ver cómo el punto de equilibrio se desplaza a diferentes niveles de precio. Precios más bajos requieren más unidades para alcanzar el equilibrio.
¿Tiene en cuenta los impuestos?
No. El análisis de punto de equilibrio cubre solo costos. El punto de equilibrio es donde los ingresos igualan los costos totales sin considerar impuestos.
¿Cómo abro esto en Google Sheets?
Sube el archivo .xlsx a Google Drive y luego ábrelo con Google Sheets. Todas las fórmulas y el formato se conservarán.
Más plantillas Essentials de Finanzas Empresariales
Destacados:
¿Buscas plantillas premium?
Nuestras plantillas de pago incluyen paneles avanzados con múltiples hojas, gráficos nativos de Excel y actualizaciones continuas.
Mejor obtenga todas las plantillas Ultimate
Las 58 plantillas Ultimate en una sola compra por $299 - valor de $1,102, usted se queda con $803.