Analisi del Punto di Pareggio Modello Essentials
Calcola il punto di pareggio in cui i ricavi coprono tutti i costi. Inserisci i costi fissi, i costi variabili e i prezzi per vedere il volume di vendite necessario.
Cosa include
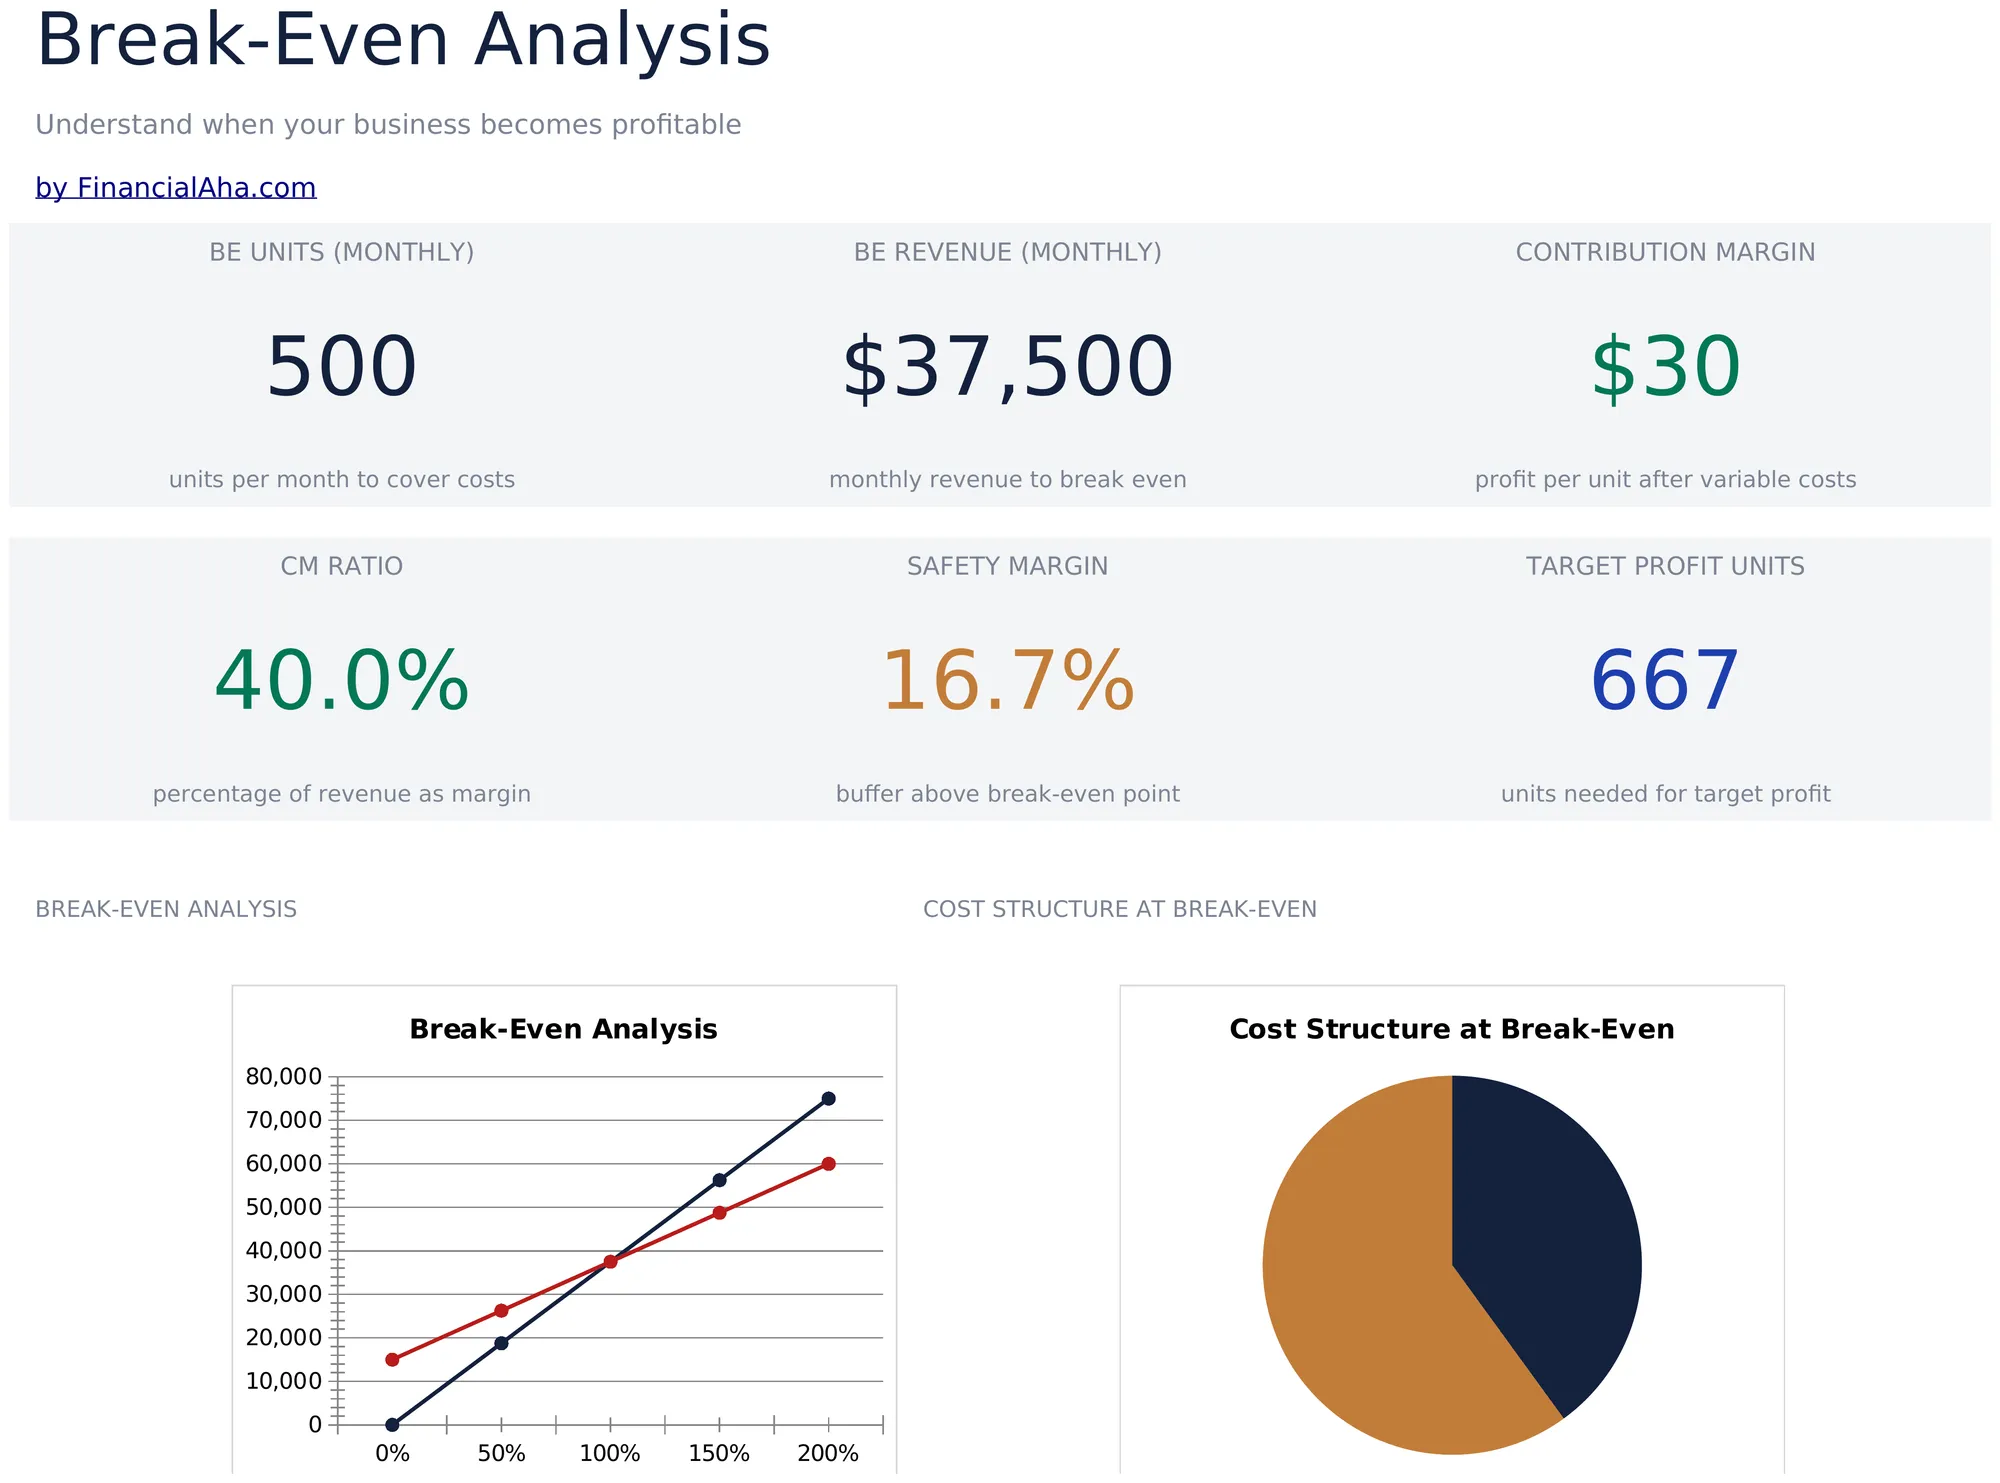
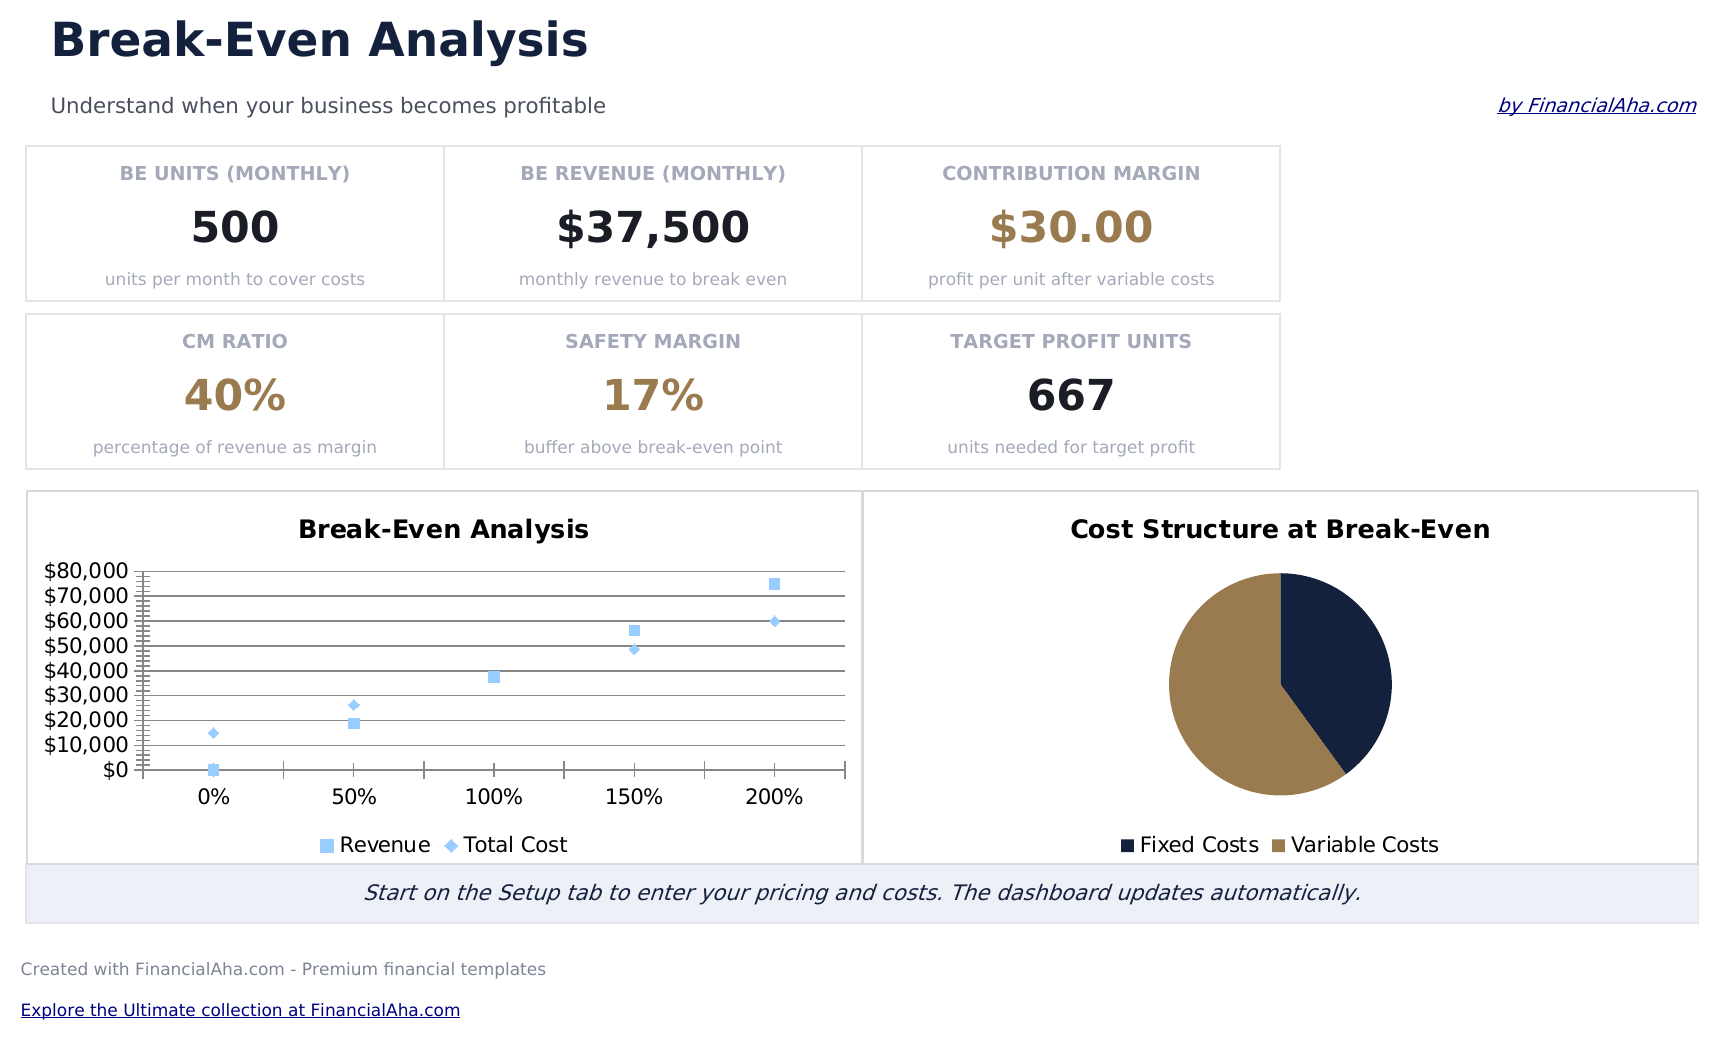
- Pannello di controllo con visualizzazione del punto di pareggio che mostra il numero esatto di unità e l'importo in $ necessario per coprire tutti i costi
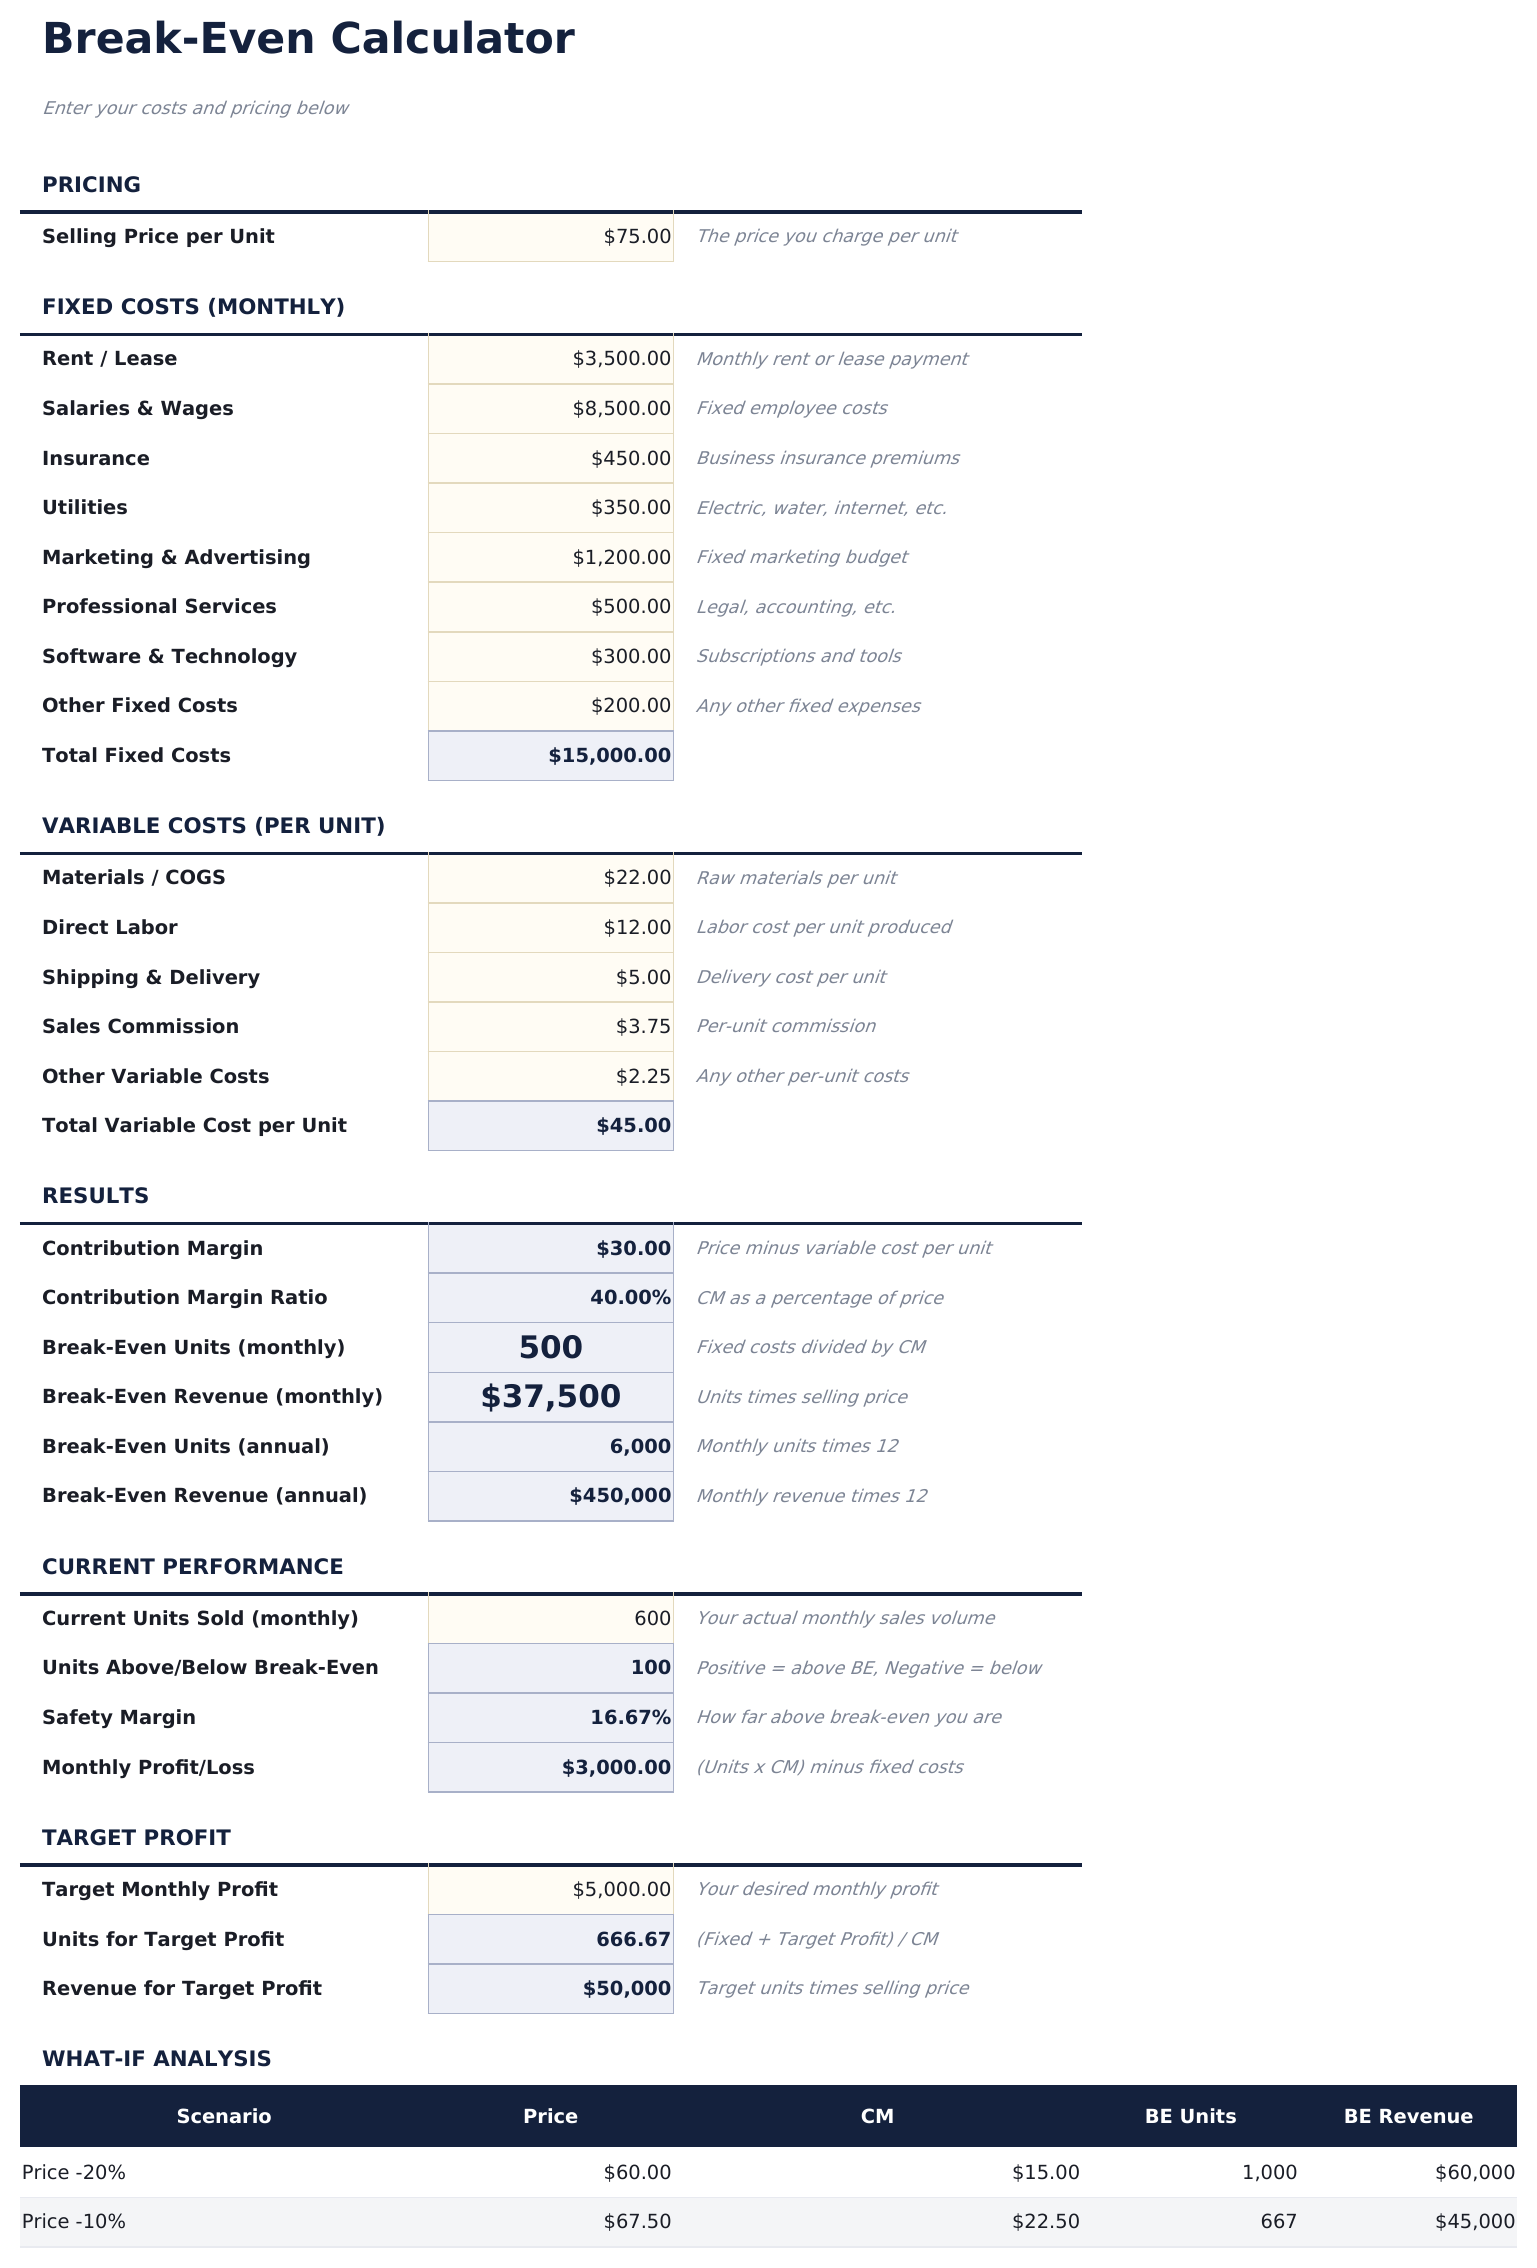
- Foglio di configurazione con input per i costi fissi totali, il costo variabile per unità e il prezzo di vendita per unità
- Calcoli del punto di pareggio in unità e ricavi che si aggiornano automaticamente ogni volta che si modificano i costi o i prezzi
- Analisi del margine di contribuzione che mostra il margine per unità e come ogni vendita contribuisce a coprire i costi fissi
- Analisi di sensitività per le variazioni di prezzo con celle di input con codice colore che mostrano il pareggio a diversi livelli di prezzo
- Funziona con Microsoft Excel, Google Sheets e LibreOffice Calc senza alcuna configurazione necessaria
Anteprima
Scopri cosa contiene questo modello
Come usare questo modello Analisi del Punto di Pareggio
Inserisci i costi fissi
Inserisci i costi fissi totali - affitto, stipendi, assicurazioni e altre spese che non variano con il volume delle vendite.
Inserisci i costi variabili
Aggiungi il costo variabile per unità - materiali, manodopera e altri costi che aumentano con ogni unità venduta.
Imposta il prezzo di vendita
Inserisci il prezzo di vendita per unità. Il margine di contribuzione (prezzo meno costo variabile) viene calcolato automaticamente.
Leggi il punto di pareggio
Il pannello di controllo mostra il punto di pareggio in unità e in $ - il volume di vendite esatto necessario per coprire tutti i costi fissi e variabili.
Customer Reviews
What Our Customers Say
"If I get half as good at handling my finances as you are at customer service, this'll be the best $26 I've spent lately."
"Great tool! Simplifies financial planning without the hassle of complex spreadsheets."
"I recently purchased your super convenient spreadsheet, it really helps me!"
"They're great and super intuitive. Thank you!"
Creati da Claude AI. Perfezionati da noi.
Utilizziamo Claude AI per creare ogni modello, dopo una ricerca approfondita. Poi interviene il nostro team. Miglioriamo il layout, testiamo ogni formula, correggiamo i casi limite e rifiniamo il design fino a ottenere qualcosa che useremmo noi stessi. L'AI ci porta all'80%. L'ultimo 20% è tutto giudizio umano.
Domande frequenti
Cos'è il margine di contribuzione?
Il margine di contribuzione è il prezzo di vendita meno il costo variabile per unità. Rappresenta quanto ogni vendita contribuisce a coprire i costi fissi.
E se vendo più prodotti?
Usa un prezzo di vendita medio ponderato e un costo variabile attraverso il tuo mix di prodotti. Il punto di pareggio si applica al prodotto combinato.
Come si usa l'analisi di sensitività?
Modifica l'input del prezzo di vendita per vedere come il punto di pareggio cambia a diversi livelli di prezzo. Prezzi più bassi richiedono più unità per raggiungere il pareggio.
Tiene conto delle tasse?
No. L'analisi del punto di pareggio riguarda solo i costi. Il punto di pareggio è dove i ricavi equivalgono ai costi totali prima di qualsiasi considerazione fiscale.
Come posso aprirlo in Google Sheets?
Carica il file .xlsx su Google Drive, poi aprilo con Google Sheets. Tutte le formule e la formattazione saranno conservate.
Altri modelli Essentials Finanza Aziendale
Punti Chiave:
Cerchi modelli di fogli di calcolo premium?
I nostri modelli a pagamento includono dashboard multi-foglio avanzate, grafici nativi Excel e aggiornamenti continui.
Privato e sicuro
I tuoi dati finanziari restano sul tuo dispositivo. Non li vediamo mai.
Scopri di piu →Ottieni invece ogni modello Ultimate
Tutti i 58 modelli Ultimate in un unico acquisto per $299 - valore di $1,102, risparmi $803.