盈亏平衡分析 Essentials 模板
计算收入覆盖所有成本的盈亏平衡点。输入固定成本、可变成本和定价,查看所需的销售量。
包含内容
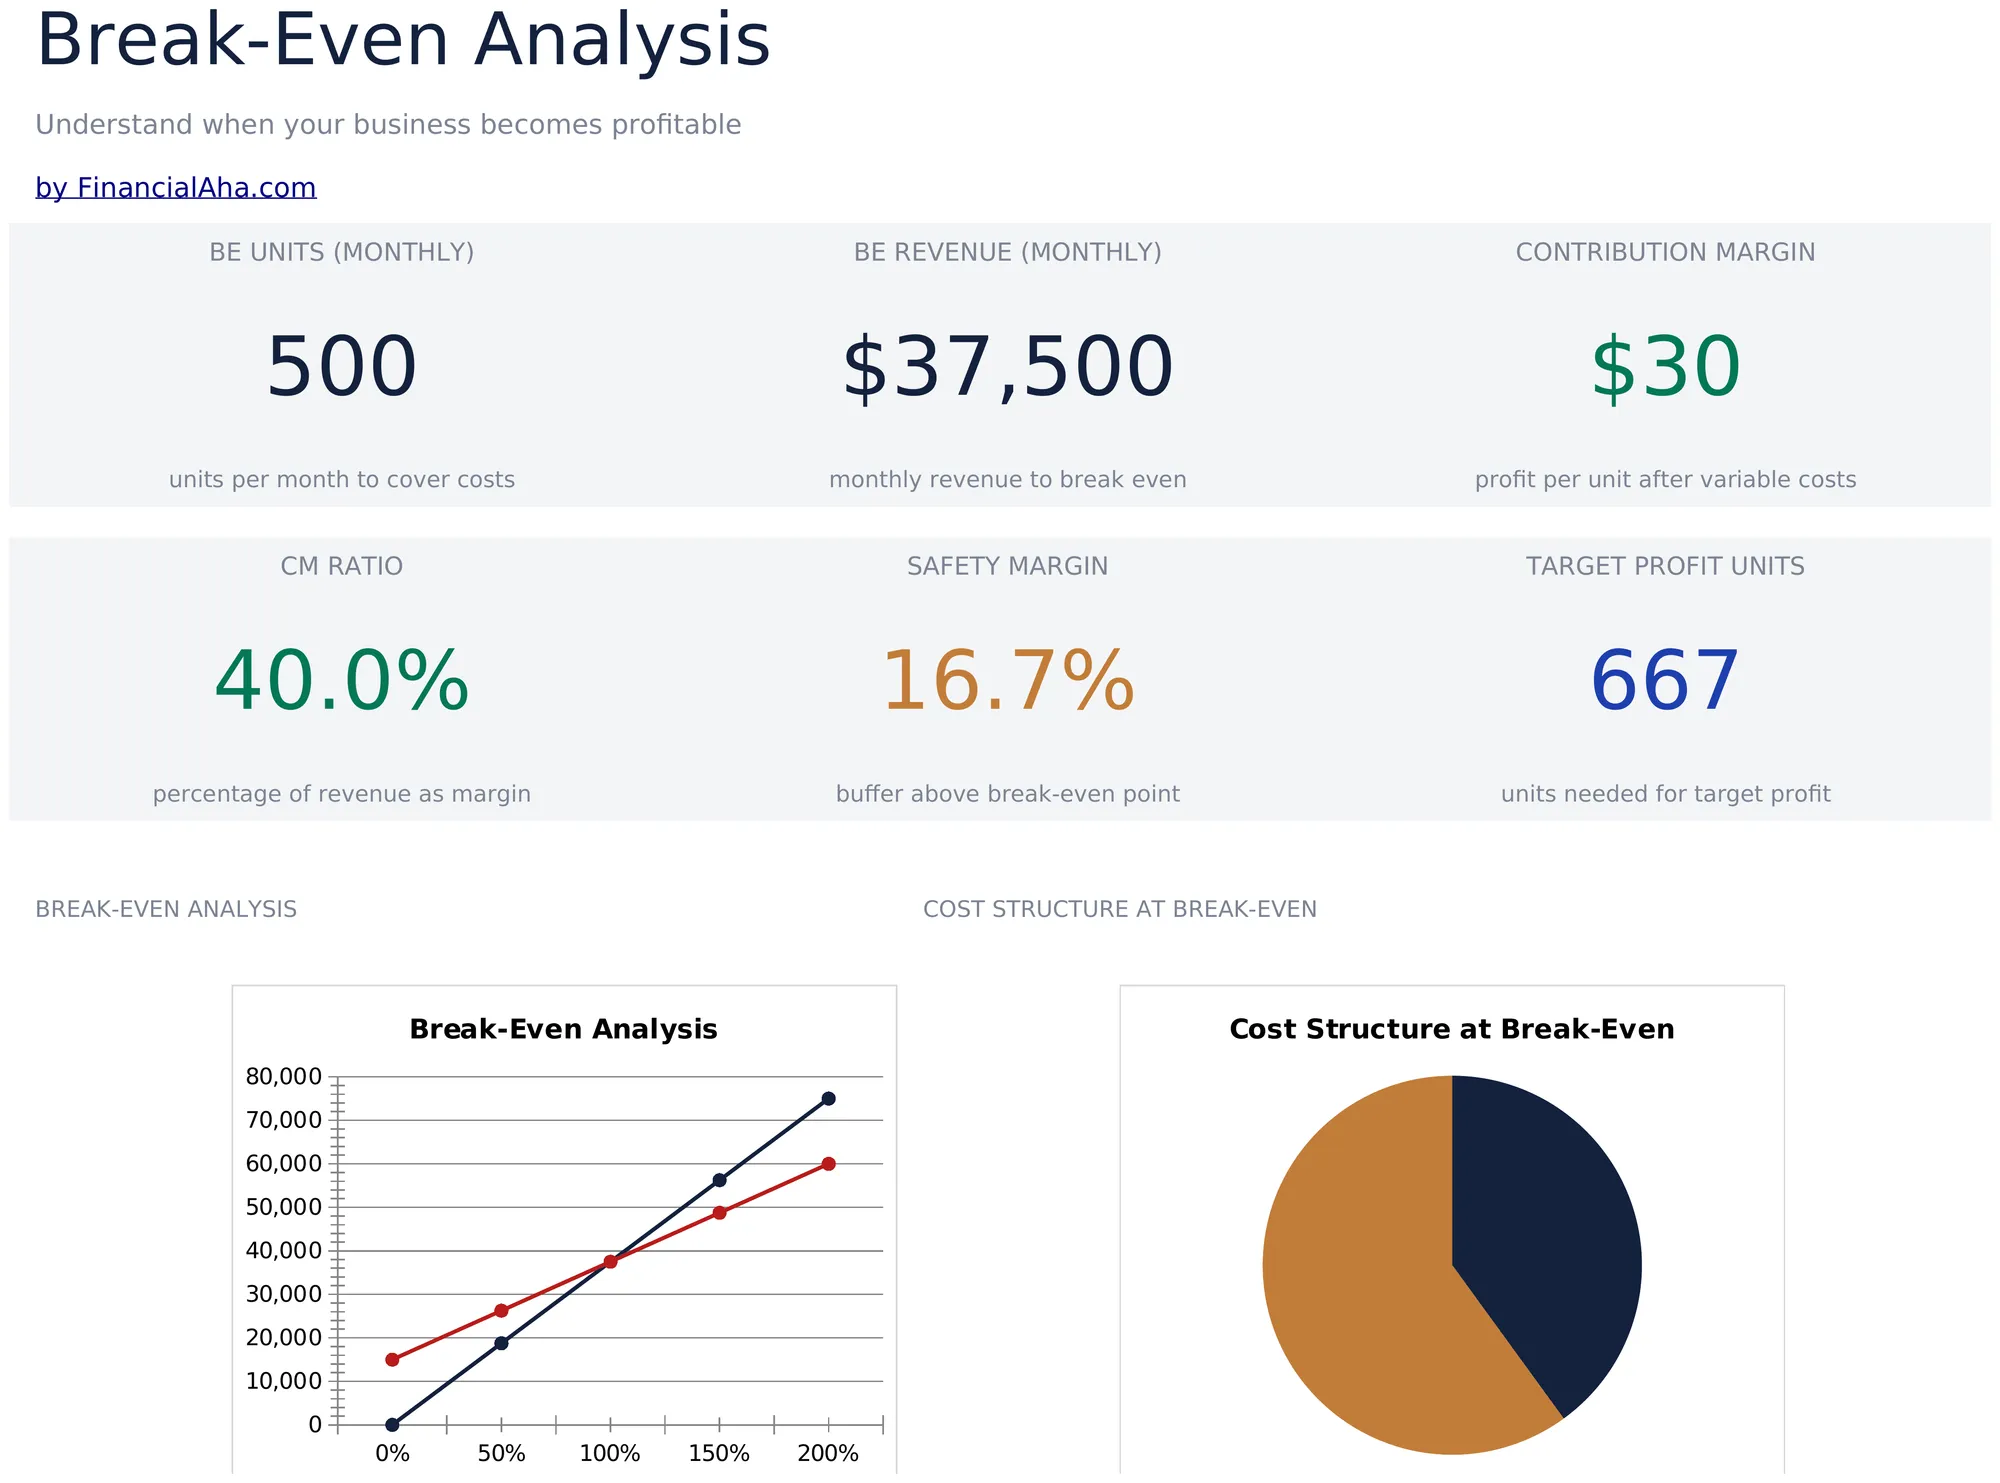
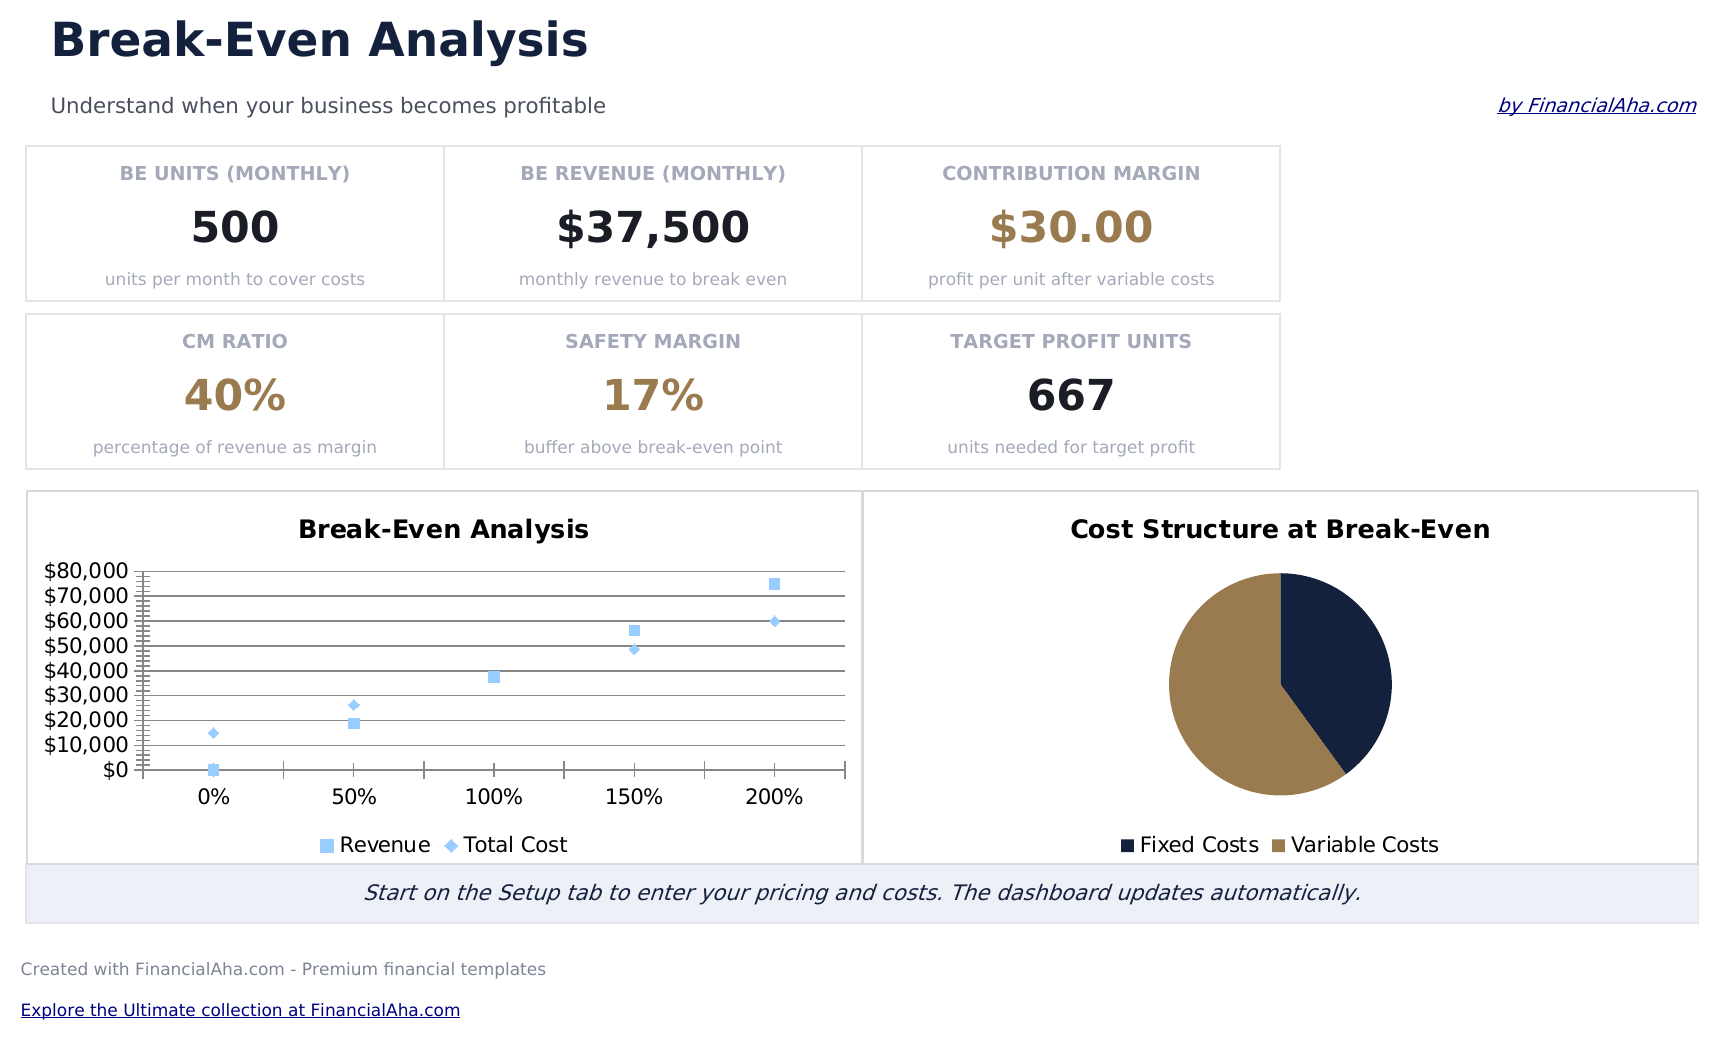
- 仪表板显示盈亏平衡点,包含覆盖所有成本所需的确切单位数量和金额
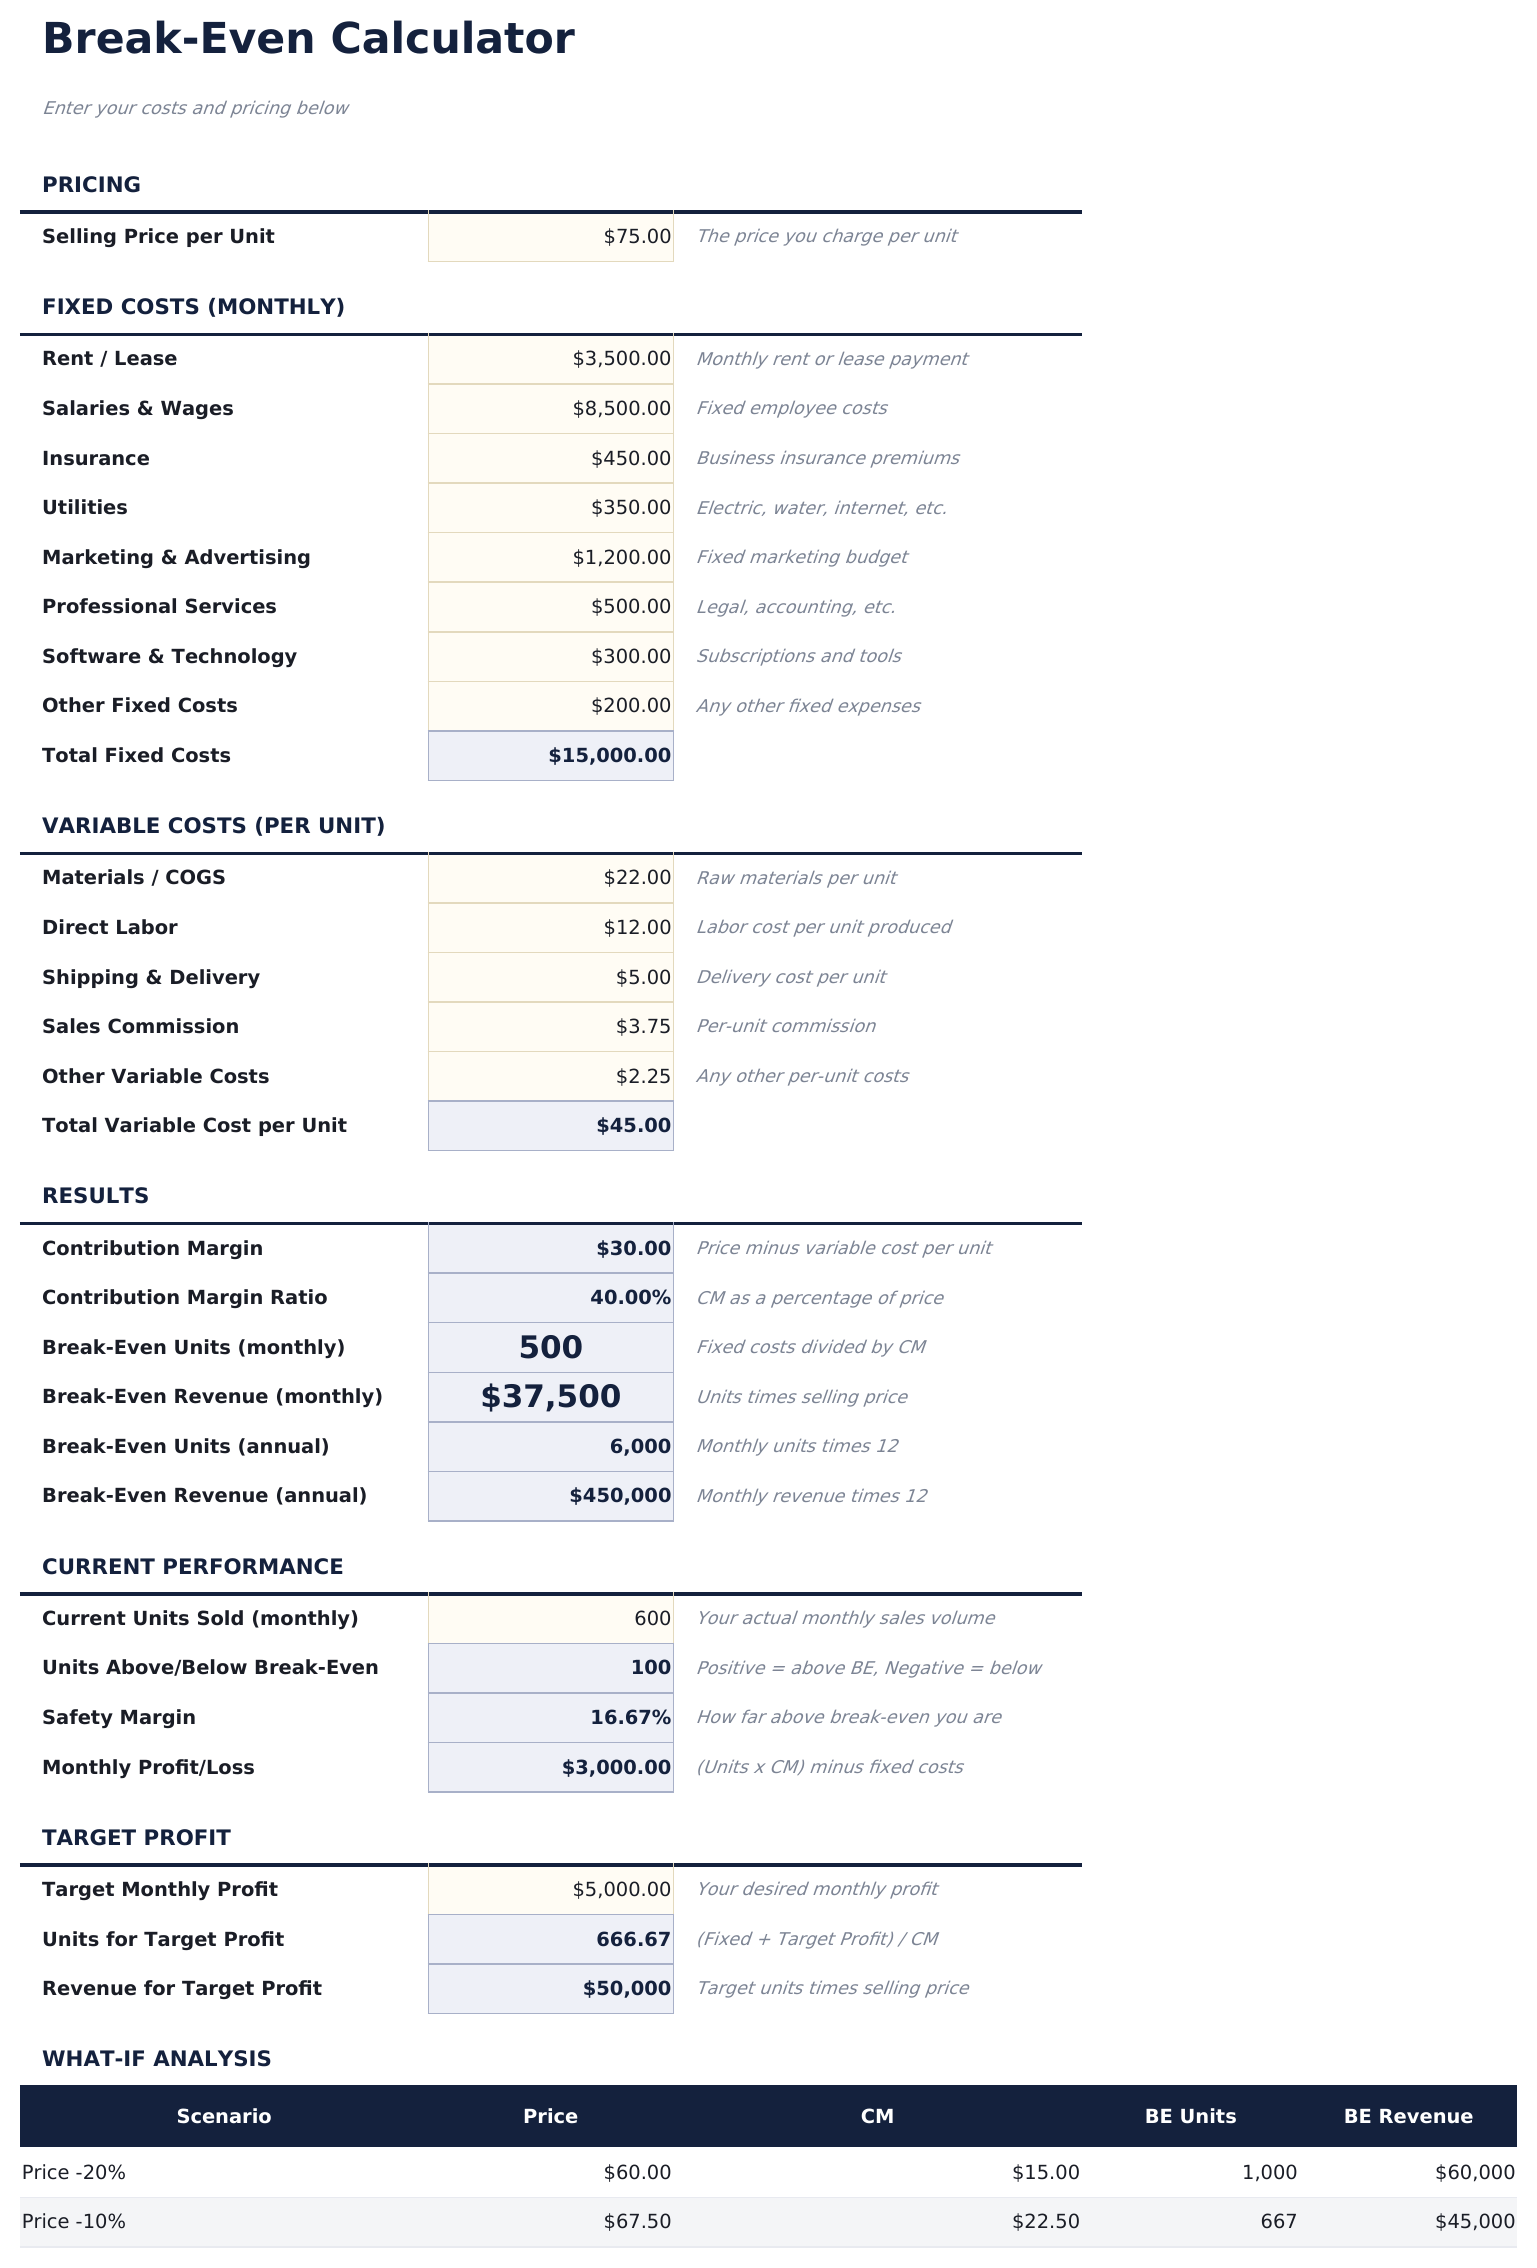
- 设置工作表包含总固定成本、单位可变成本和单位售价的输入
- 盈亏平衡单位和收入计算,在您调整成本或定价输入时自动更新
- 边际贡献分析,显示单位边际和每笔销售对覆盖固定成本的贡献
- 价格变动敏感性分析,彩色标记的输入单元格显示不同价格点的盈亏平衡
- 适用于 Microsoft Excel、Google Sheets 和 LibreOffice Calc,无需任何设置
预览
查看此模板的内容
如何使用这个盈亏平衡分析模板
输入固定成本
输入总固定成本 - 租金、薪资、保险和其他不随销售量变化的费用。
输入可变成本
添加单位可变成本 - 材料、人工和其他随每单位销售而增加的成本。
设置售价
输入单位售价。边际贡献(售价减可变成本)自动计算。
查看盈亏平衡点
仪表板以单位和金额显示盈亏平衡点 - 覆盖所有固定和可变成本所需的确切销售量。
Customer Reviews
What Our Customers Say
"If I get half as good at handling my finances as you are at customer service, this'll be the best $26 I've spent lately."
"Great tool! Simplifies financial planning without the hassle of complex spreadsheets."
"I recently purchased your super convenient spreadsheet, it really helps me!"
"They're great and super intuitive. Thank you!"
由 Claude AI 构建,经我们精心打磨。
我们使用 Claude AI 在深入研究后起草每个模板。然后由团队接手,优化布局、全面测试每个公式、修复边界情况,并打磨设计,直到达到我们自己愿意使用的标准。AI 完成了 80% 的工作,最后 20% 靠的是人工判断。
常见问题
什么是边际贡献?
边际贡献是售价减去单位可变成本。它代表每笔销售对覆盖固定成本的贡献额。
如果销售多种产品怎么办?
使用产品组合的加权平均售价和可变成本。盈亏平衡点适用于混合产品。
如何使用敏感性分析?
更改售价输入,查看不同价格水平下盈亏平衡点的变化。价格越低,达到盈亏平衡所需的单位越多。
这考虑税费吗?
不考虑。盈亏平衡分析仅涵盖成本。盈亏平衡点是收入等于总成本的位置,不考虑任何税务因素。
如何在 Google Sheets 中打开?
将 .xlsx 文件上传到 Google Drive,然后使用 Google Sheets 打开。所有公式和格式都会保留。
更多 企业财务 Essentials 模板
亮点:
不如获取每一个 Ultimate 模板
全部 58 个 Ultimate 模板一次购买即可获得,仅需 $299 - 价值 $1,102,您可节省 $803。