Análise de Ponto de Equilíbrio Modelo Essentials
Calcule o ponto de equilíbrio onde a receita cobre todos os custos. Digite custos fixos, custos variáveis e preço para ver o volume de vendas necessário.
O Que Está Incluído
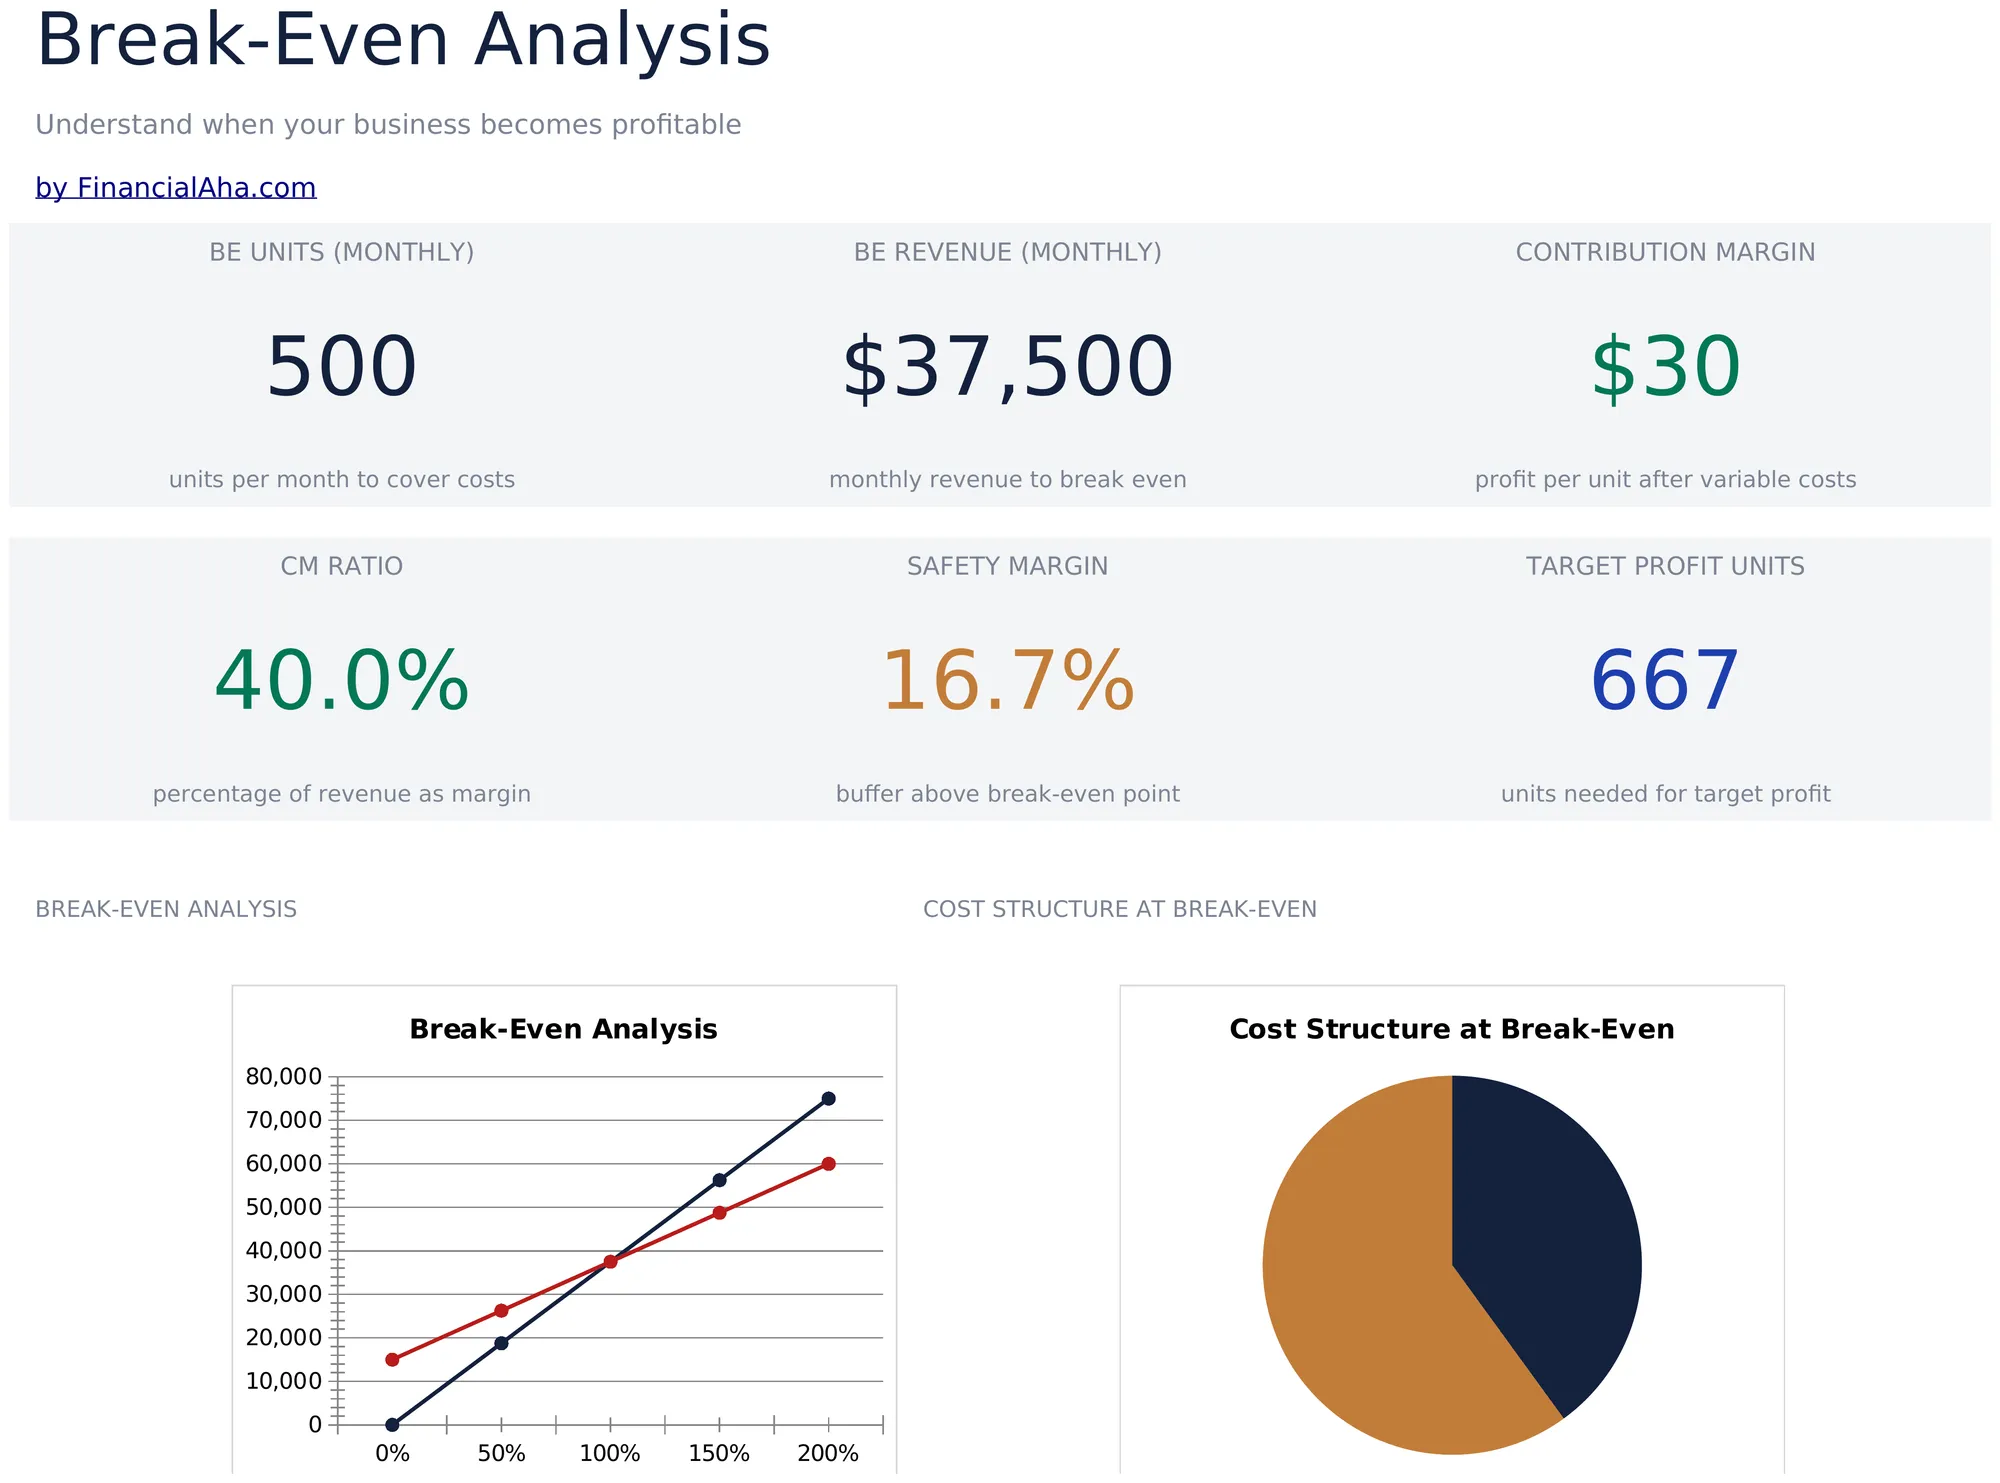
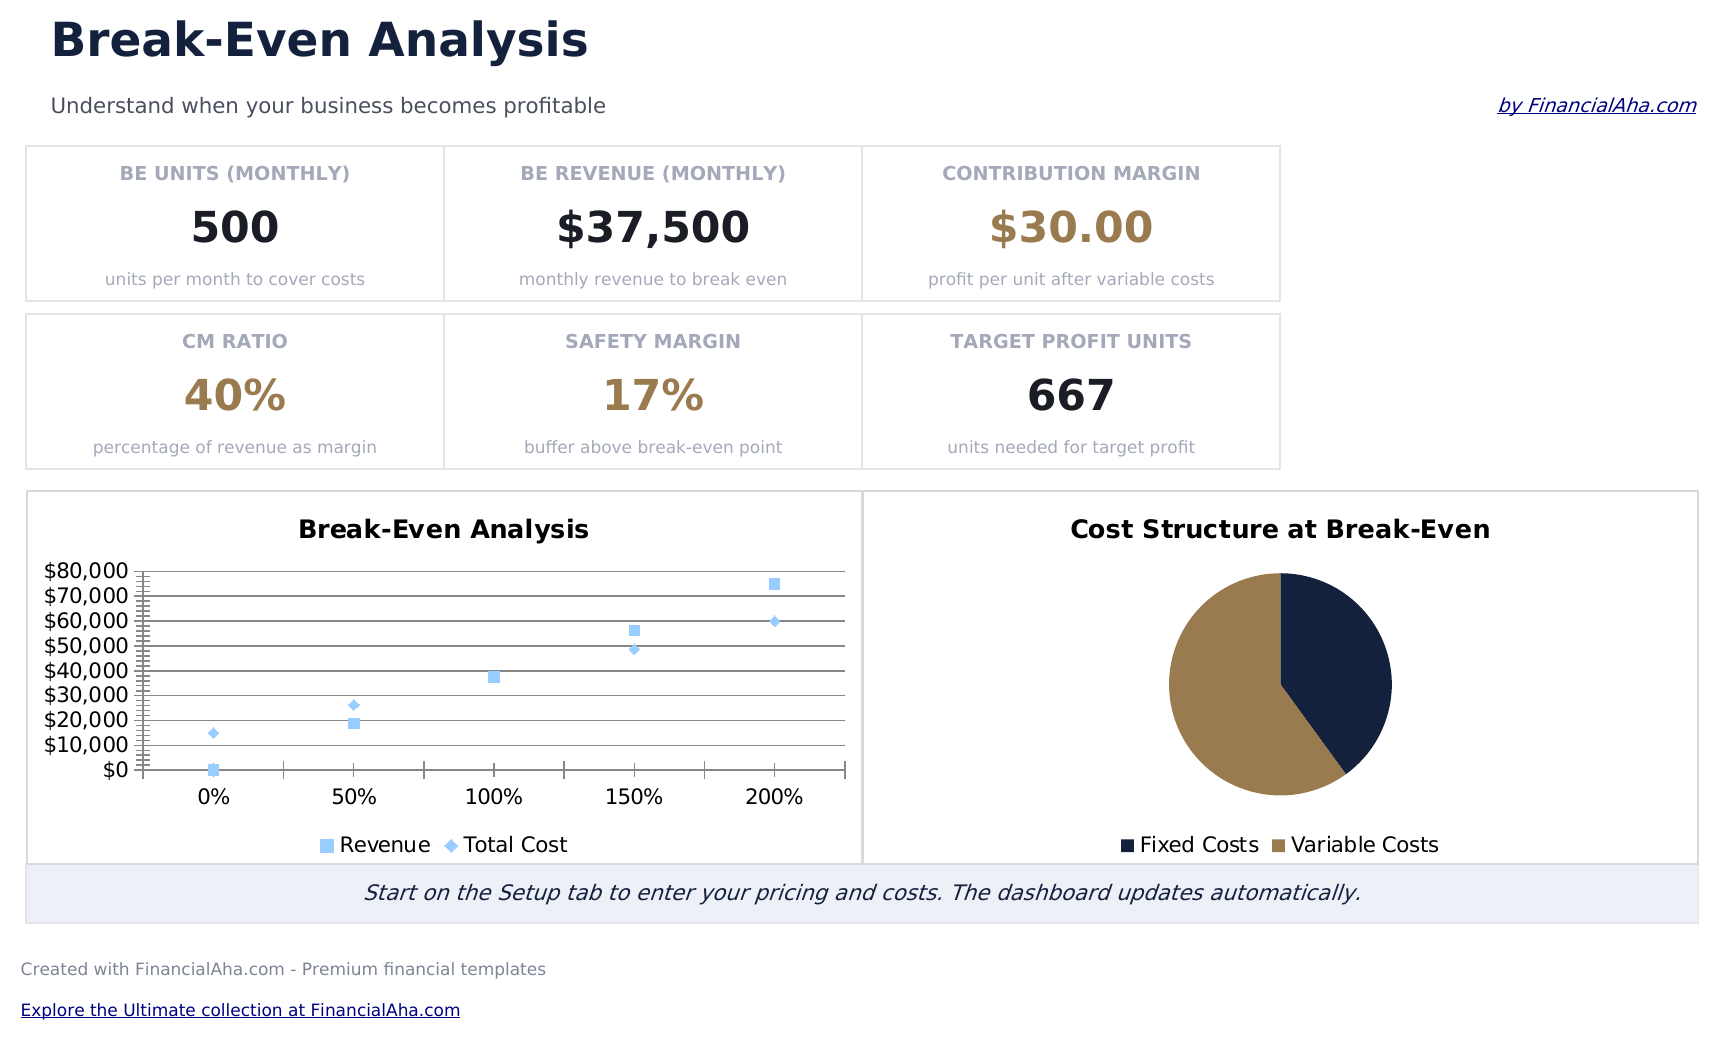
- Painel com exibição de ponto de equilíbrio mostrando o número exato de unidades e valor em dólares necessários para cobrir todos os custos
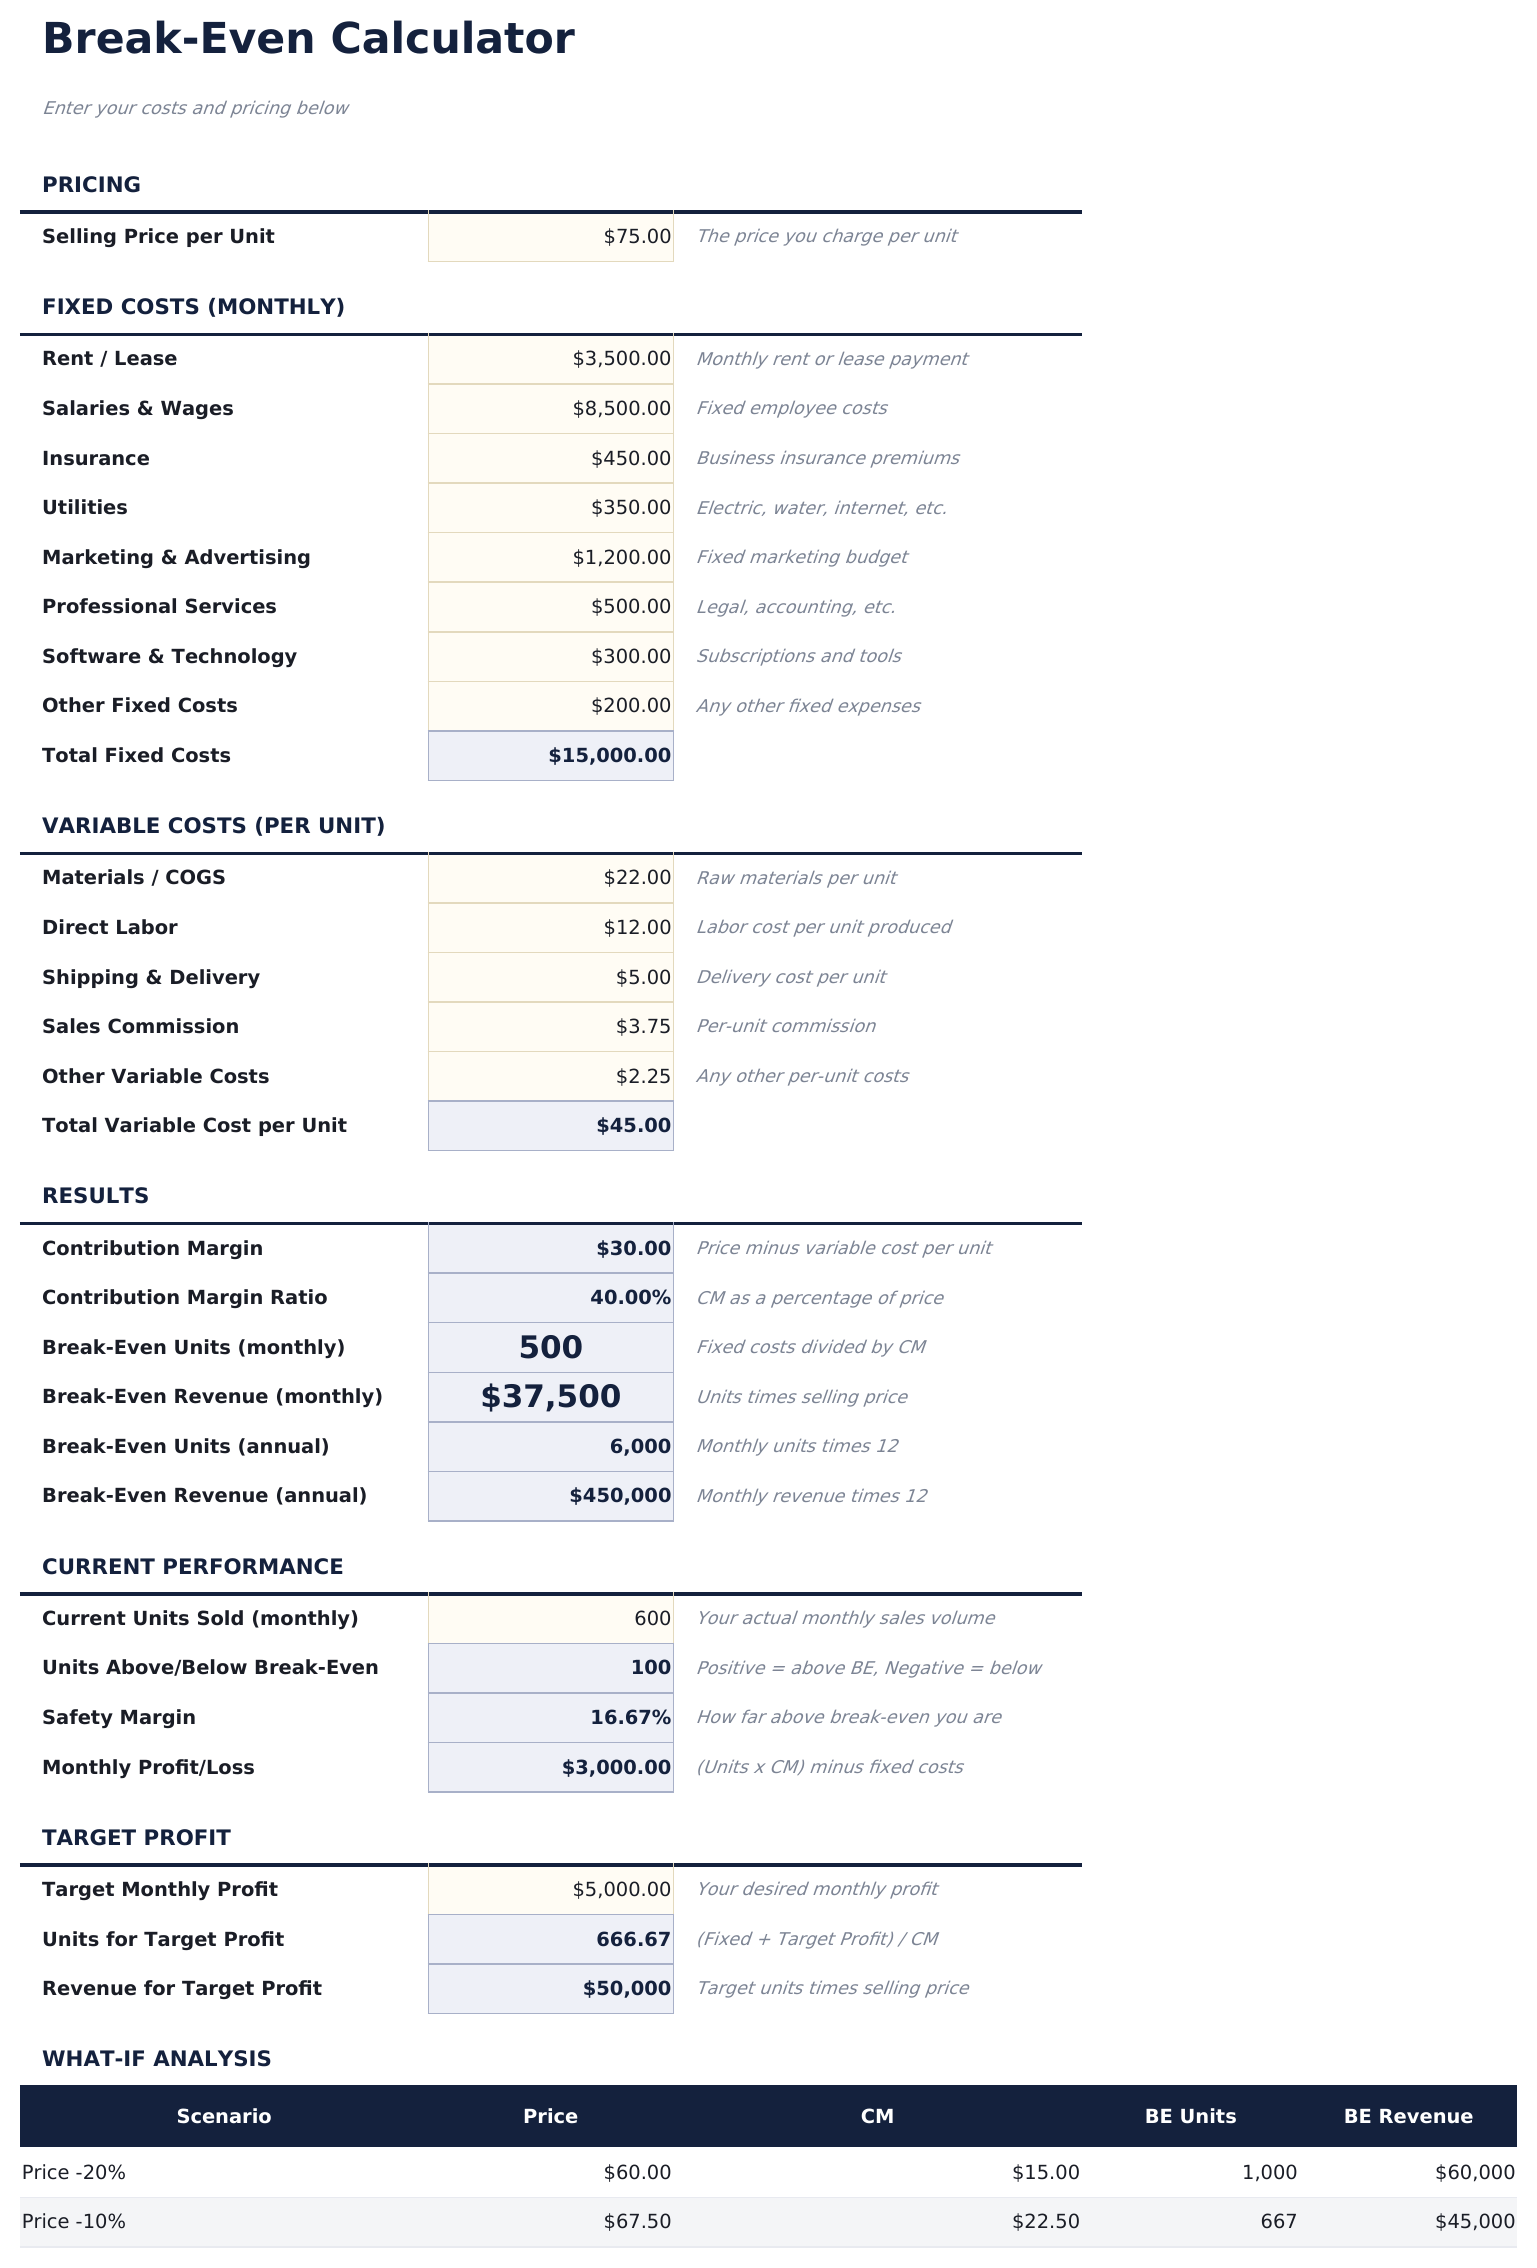
- Planilha de configuração com entradas para custos fixos totais, custo variável por unidade e preço de venda por unidade
- Cálculos de unidade de ponto de equilíbrio e receita que atualizam automaticamente sempre que você ajusta custos ou entradas de preço
- Análise de margem de contribuição mostrando a margem por unidade e como cada venda contribui para cobrir custos fixos
- Análise de sensibilidade para mudanças de preço com células de entrada codificadas por cor mostrando ponto de equilíbrio em diferentes pontos de preço
- Funciona no Microsoft Excel, Google Sheets e LibreOffice Calc sem configuração necessária
Pré-visualização
Veja o que tem dentro desta planilha
Como Usar Esta Planilha de Análise de Ponto de Equilíbrio
Digite custos fixos
Digite custos fixos totais - aluguel, salários, seguro e outras despesas que não mudam com o volume de vendas.
Digite custos variáveis
Adicione o custo variável por unidade - materiais, mão de obra e outros custos que aumentam com cada unidade vendida.
Defina o preço de venda
Digite o preço de venda por unidade. A margem de contribuição (preço menos custo variável) calcula automaticamente.
Leia o ponto de equilíbrio
O painel mostra o ponto de equilíbrio em unidades e dólares - o volume exato de vendas necessário para cobrir todos os custos fixos e variáveis.
Customer Reviews
What Our Customers Say
"If I get half as good at handling my finances as you are at customer service, this'll be the best $26 I've spent lately."
"Great tool! Simplifies financial planning without the hassle of complex spreadsheets."
"I recently purchased your super convenient spreadsheet, it really helps me!"
"They're great and super intuitive. Thank you!"
Criadas com Claude AI. Aperfeiçoadas por nós.
Usamos Claude AI para criar cada planilha, após uma pesquisa aprofundada. Depois, nossa equipe entra em ação. Refinamos o layout, testamos exaustivamente cada fórmula, corrigimos casos extremos e polimos o design até que pareça algo que nós mesmos usaríamos. A IA nos leva 80% do caminho. Os últimos 20% são puro julgamento humano.
Perguntas Frequentes
O que é a margem de contribuição?
Margem de contribuição é o preço de venda menos o custo variável por unidade. Representa quanto cada venda contribui para cobrir custos fixos.
E se eu vender vários produtos?
Use uma média ponderada de preço de venda e custo variável em sua linha de produtos. O ponto de equilíbrio se aplica ao produto combinado.
Como faço para usar a análise de sensibilidade?
Altere a entrada de preço de venda para ver como o ponto de equilíbrio muda em diferentes níveis de preço. Preços mais baixos exigem mais unidades para atingir o ponto de equilíbrio.
Isso leva em conta impostos?
Não. A análise de ponto de equilíbrio cobre apenas custos. O ponto de equilíbrio é onde a receita iguala os custos totais antes de qualquer consideração fiscal.
Como abrir no Google Sheets?
Envie o arquivo .xlsx para o Google Drive e abra com o Google Sheets. Todas as fórmulas e formatações serão preservadas.
Mais modelos Essentials de Finanças Empresariais
Destaques:
Procurando planilhas premium?
Nossas planilhas pagas incluem painéis avançados com várias abas, gráficos nativos do Excel e atualizações contínuas.
Leve todos os modelos Ultimate
Todos os 58 modelos Ultimate em uma única compra por $299 - valor de $1,102, você fica com $803.