
Most retirement targets come down to one formula: annual spending times 25, drawn from the 4% rule. Spending $40,000 a year points to about $1 million; $60,000 to $1.5 million. The real number depends on what you will actually spend, the age you stop working, and the return you assume, and a calculator works backward from your spending to show it.
Ask ten people how much they need to retire and you’ll get ten different answers - most of them guesses. “A million dollars” is the number that floats around, but it means very different things depending on where you live, how you spend, and when you want to stop working.
The real answer is personal. It starts with one question: how much will you spend each year? Everything else flows from that: the target number, the monthly savings, the timeline.
The Retirement Calculator works backward from your spending to show what’s needed. No signup required.
The Formula Behind Every Retirement Number
Most retirement math traces back to one simple framework:
Annual spending x 25 = Retirement target
This comes from the 4% rule, the idea that you can withdraw 4% of a portfolio in year one, adjust for inflation each year after, and have a high probability the money lasts 30 years. Multiply spending by 25 and you get the portfolio size that supports that withdrawal rate.
$40,000/year in spending = $1,000,000 target. $60,000/year = $1,500,000. $80,000/year = $2,000,000.
It’s a useful starting point. Not a guarantee, not a precise prediction, but a reasonable framework for figuring out the neighborhood you’re aiming for.
What Will You Actually Spend?
This is where the planning gets honest - or doesn’t. Two common traps:
Assuming spending stays the same. Some costs disappear in retirement: commuting, work clothes, payroll taxes, retirement contributions (obviously). But others show up or grow - healthcare being the big one, especially before Medicare eligibility begins at 65.
Assuming spending drops dramatically. The old “you’ll only need 70% of pre-retirement income” is a rough average that hides enormous variation. Someone with a paid-off house in a low-cost area might need 50%. Someone with travel plans and health concerns might need 90% or more.
The more useful exercise: look at current spending, remove work-related costs, add healthcare estimates, and see where you land. That number is more trustworthy than any rule of thumb.
Time Changes Everything
Here’s a concrete example of how starting age shapes the math:
Goal: $1,250,000 by age 65, starting with some existing savings, earning 7% average annual return (inflation-adjusted).
| Start Age | Existing Savings | Monthly Savings Needed |
|---|---|---|
| 25 | $10,000 | $425 |
| 30 | $30,000 | $475 |
| 35 | $50,000 | $620 |
| 40 | $80,000 | $900 |
| 45 | $120,000 | $1,350 |
| 50 | $200,000 | $2,100 |
The monthly requirement roughly doubles with every ten-year delay. At 25, compound growth does most of the work. At 50, it’s almost entirely brute-force saving. This isn’t meant to cause panic - it’s just the math of compounding. Wherever you are is the starting point.
A Worked Example
Person: Age 30, $50,000 already saved, earning $75,000/year, expects to spend $50,000/year in retirement.
Target: $1,250,000 (that’s $50,000 x 25).
What the existing $50,000 becomes on its own: At 7% for 35 years, roughly $534,000.
Remaining gap: $716,000.
Monthly savings needed: About $415, which is 6.6% of gross income. With an employer 401(k) match, the out-of-pocket cost drops further.
This person is in decent shape - but only because they started at 30 with money already in the account. Push the start to 40 with nothing saved and the monthly number jumps to about $1,800.
Where the 4% Rule Comes From (and Where It Breaks Down)
William Bengen published the original research in 1994, using US stock and bond market data from 1926 to 1992. He found that a 4% initial withdrawal, adjusted annually for inflation, survived every 30-year period in the dataset. The Trinity Study later validated this finding using rolling periods of market data.
Worth knowing about its edges:
It assumes a 30-year retirement. Retiring at 50 and living to 95 is 45 years. For longer retirements, some planners suggest 3-3.5%.
It assumes a fixed strategy. Real people adjust. Spending less during a market crash and more during a boom dramatically improves the odds - but the original research assumes rigid withdrawals.
US market returns have been unusually strong. Global stock market returns have historically been lower. If the next 30 years look more like global averages than US history, 4% might be too aggressive.
It works as a planning tool, not a prediction. Nobody actually withdraws exactly 4%, adjusted for inflation, for exactly 30 years. Life doesn’t work that way. But as a framework for estimating a savings target, it’s more useful than guessing.
The Variables Worth Adjusting
When running numbers through the calculator, these inputs have the most impact:
Expected return. The difference between 5% and 7% over 30 years is massive. Conservative projections use 5-6% (inflation-adjusted). Optimistic ones use 7-8%. Using both ends shows the range of outcomes.
Retirement age. Each year earlier means one more year of expenses and one fewer year of contributions and growth. That double effect is why early retirement requires substantially more savings per year.
Healthcare. There’s no separate field for it, so this cost sits inside the desired annual retirement income you enter. Before Medicare at 65, individual health insurance can run $500-$2,000+ per month. It’s often the largest single expense for early retirees and the one most often underestimated.
Inflation. Running calculations in real (inflation-adjusted) dollars gives an honest picture. Nominal numbers make the future look cheaper than it is.
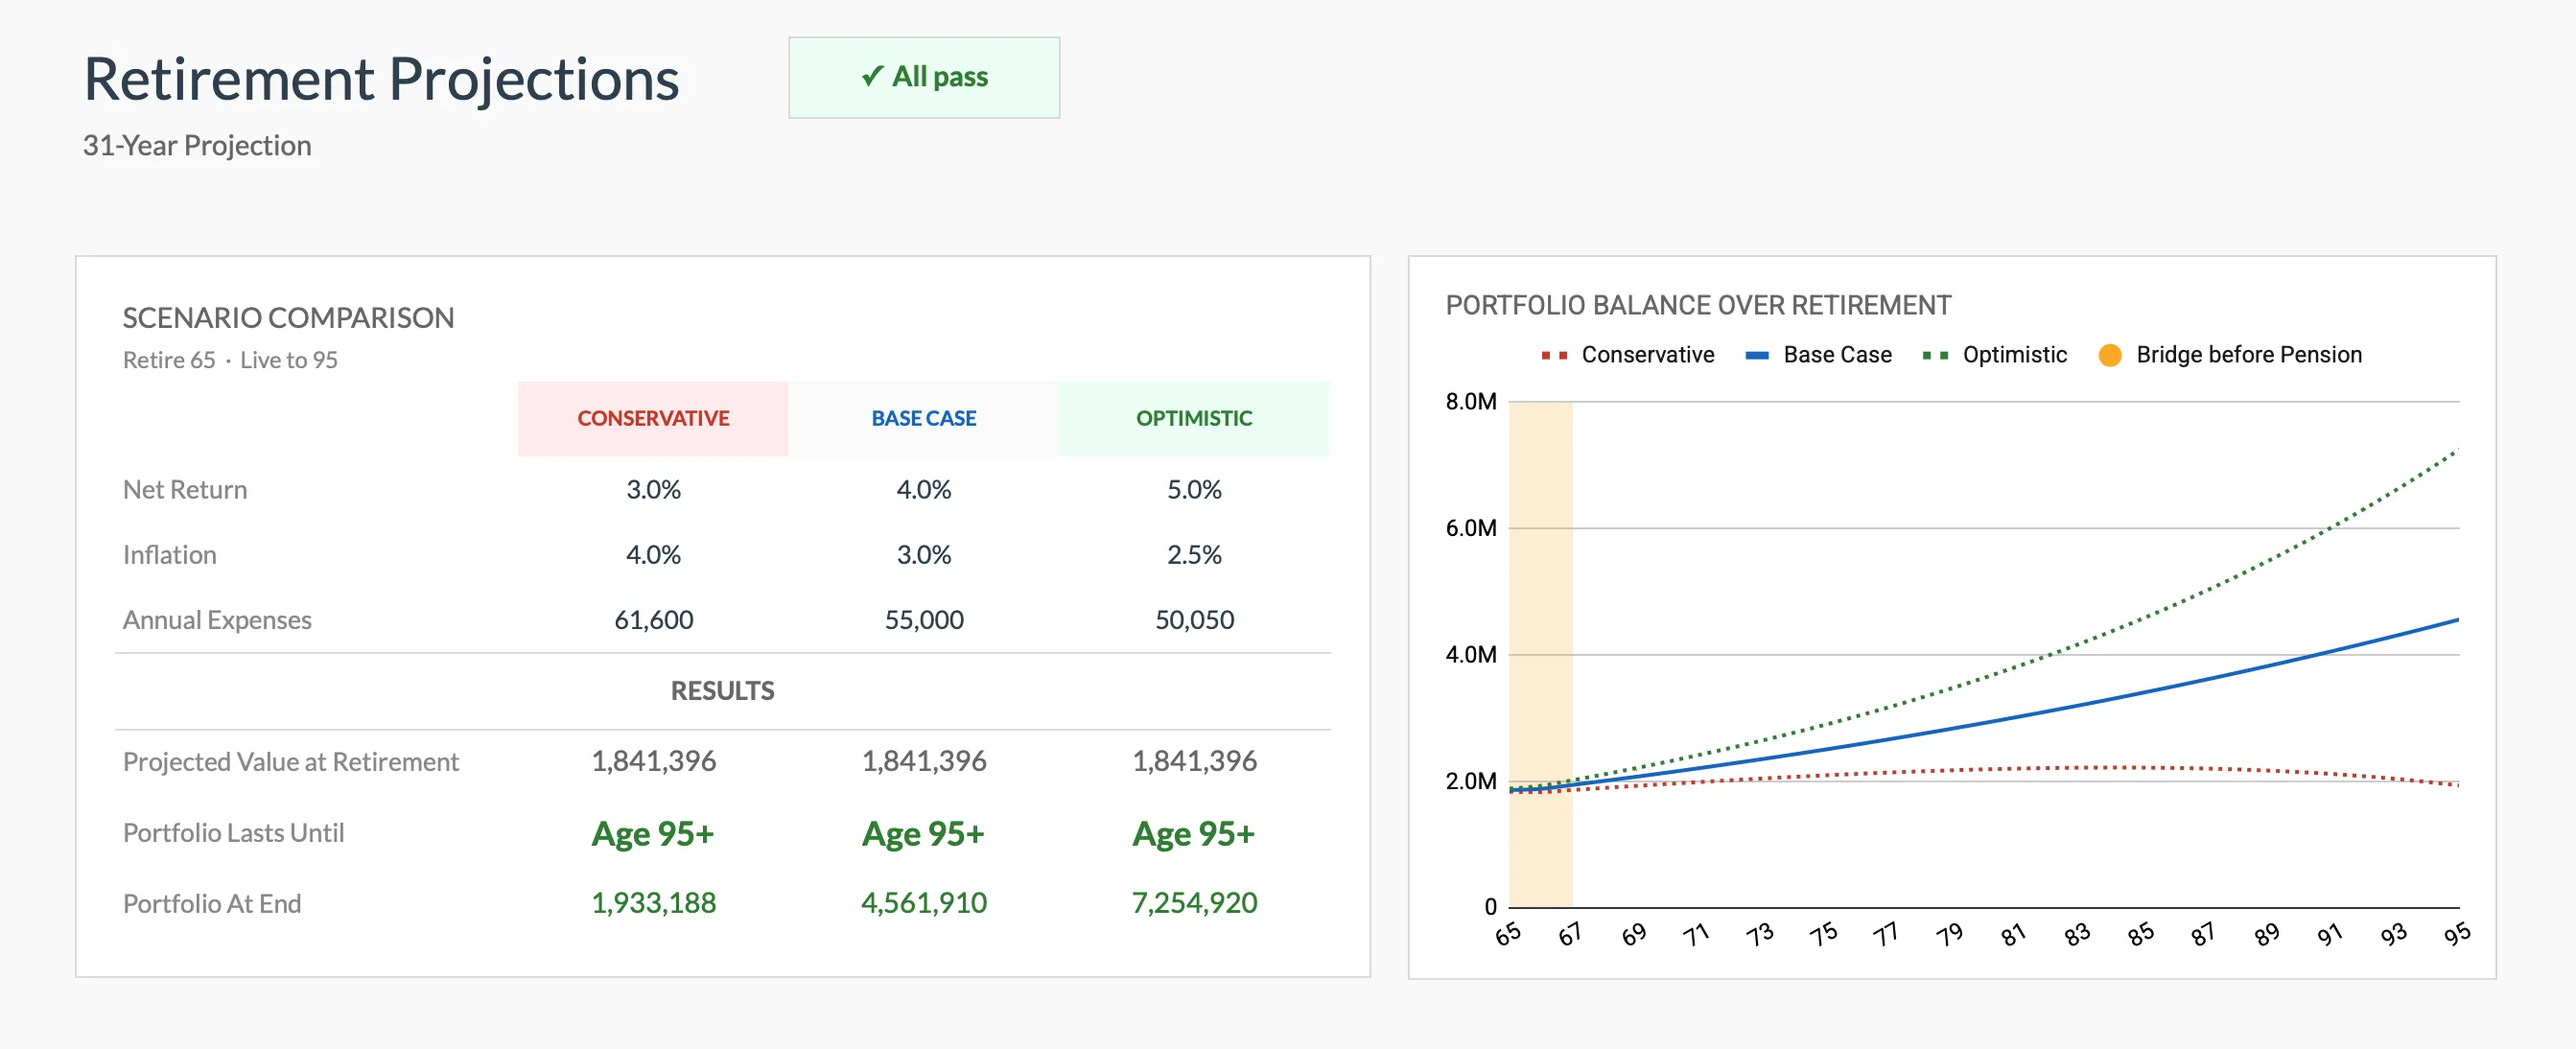
Running the same target through conservative, base, and optimistic assumptions is exactly what the Retirement Financial Planning Template does, so the range of outcomes sits side by side rather than as a single guess.
Checking In Over Time
A retirement calculation isn’t a one-time exercise. Running it once gives a target. Running it annually shows whether you’re converging on that target or drifting away from it.
If the gap is narrowing - on track. If it’s widening - time to revisit savings rate, timeline, or spending assumptions. Annual check-ins are enough. More frequent than that and you’re reacting to market noise instead of meaningful trends.
The Retirement Financial Planning Template recalculates the whole projection whenever the inputs change, and its milestone rows set the projected value at retirement against 10x, 25x, 30x and 33x annual expenses, so a yearly re-run shows where the number has moved.
Retirement Planning on FinancialAha
Calculators:
- Retirement Calculator - Basic retirement savings calculator
- FIRE Calculator - Financial independence number
- Coast FIRE Calculator - When compound growth covers the rest
- 401(k) Calculator - Contribution growth over a career
- Social Security Calculator - Benefit estimates by claiming age
Articles:
- FIRE Calculator: How to Calculate Your Financial Independence Number - The math behind FIRE
- Coast FIRE Calculator Explained: Formula and Three Worked Examples - Compound growth does the work
- 401(k) Calculator: How Contributions Grow - Worked examples
- When Can I Retire? Calculator Plus Rule of Thumb - A four-input estimate with worked examples at 30, 45, and 55
- Retirement Withdrawal Calculator Spreadsheet - The 4% rule as a year-by-year projection
- Social Security Calculator: Estimating Your Benefits - How claiming age changes the monthly benefit
- 7 Free Retirement Calculators Compared - Tested roundup
- Retirement Template vs Calculator - Which tool to use when
Templates:
- Retirement Financial Planning Template - Projections with your real numbers
Frequently asked questions
Is $1 million enough to retire?
It depends entirely on annual expenses. At a 4% withdrawal rate, $1 million supports about $40,000/year. That's comfortable for some, insufficient for others.
What age should I plan to retire?
That's a personal decision. The calculator helps you see what different retirement ages require financially. Earlier retirement means more years to fund and less time to save.
What about Social Security?
Social Security provides a base income that reduces how much your portfolio needs to cover. Factor in estimated benefits, but having a plan that works without them provides extra security.
What if I'm starting late?
Later starts mean higher required savings rates, but catch-up contributions help. The IRS lets people 50 and older add an extra $8,000 to a 401(k) in 2026 on top of the standard limit, and ages 60 to 63 can add more. Running the numbers shows what's needed.
Is the 4% figure a withdrawal rate or an investment return?
A withdrawal rate. It's the share of the starting portfolio you take out in year one, then adjust for inflation, not the return the portfolio earns. The 25x target and the 4% withdrawal are two sides of the same number: 4% is one twenty-fifth.
Does the 4% rule account for taxes?
No. The original research measured gross withdrawals from the portfolio, before any tax. Money in a traditional 401(k) or IRA is taxed as income when withdrawn, so the spendable amount is lower than the headline figure. Roth balances and taxable accounts are treated differently. Where the money sits changes what a given target actually funds.
Sources
- Determining Withdrawal Rates Using Historical Data (William Bengen, 1994) - Journal of Financial Planning / Financial Planning Association
- Retirement Savings: Choosing a Withdrawal Rate That Is Sustainable (Trinity Study, 1998) - AAII Journal
- Original Medicare (Part A and B) Eligibility and Enrollment - Centers for Medicare & Medicaid Services
- Retirement Topics - Catch-Up Contributions - Internal Revenue Service
About this article
The 4% rule and 25x target trace to William Bengen's 1994 Journal of Financial Planning study and the 1998 Trinity Study, both cited below. Medicare eligibility at 65 and 401(k) catch-up figures are checked against CMS and the IRS. Calculator inputs and outputs checked on 2026-09-10 against the shipped Retirement Calculator (current age, retirement age, current savings, monthly contribution, expected return, inflation, desired annual retirement income and expected Social Security; projected savings, real value, annual income gap). Template claims checked on 2026-09-10 against the shipped Retirement Financial Planning Projections Google Sheet (Summary, Inputs, Projections, Helpers, Instructions tabs). Last reviewed September 2026.