
Your FIRE number is annual expenses times 25, the flip side of the 4% withdrawal rule: spend $50,000 a year and you need roughly $1.25 million invested. Savings rate, not income, sets the timeline, and the lean, fat, coast, and barista variations shift the target up or down.
The FIRE number is the single most important calculation in early retirement planning, the figure at the center of the whole financial independence idea. It answers one question: how much do you need invested so that your portfolio covers your expenses without running out?
The FIRE Calculator runs this math instantly. No signup required.
The Core Formula
Two rules drive every FIRE calculation:
- The 4% rule - withdraw 4% of your portfolio in year one, then adjust that dollar amount for inflation each year after
- The 25x rule - multiply annual expenses by 25 to get the target portfolio size
These are two sides of the same coin. If you withdraw 4% of a portfolio, you need 25 times your annual withdrawal (1 / 0.04 = 25). The 4% rate comes from financial planner William Bengen’s 1994 study in the Journal of Financial Planning, later reinforced by the 1998 Trinity Study on sustainable withdrawal rates.
| Annual Expenses | FIRE Number (25x) | Monthly Withdrawal |
|---|---|---|
| $30,000 | $750,000 | $2,500 |
| $50,000 | $1,250,000 | $4,167 |
| $70,000 | $1,750,000 | $5,833 |
| $100,000 | $2,500,000 | $8,333 |
Every $10,000 in annual spending adds $250,000 to the target. That relationship is worth keeping in mind when evaluating recurring expenses.
A Worked Example
Person: Age 32, earns $90,000, spends $45,000/year, has $120,000 invested, saves $2,500/month.
- FIRE number: $45,000 x 25 = $1,125,000
- Gap: $1,125,000 - $120,000 = $1,005,000
- At 7% real returns with $2,500/month contributions: roughly 15 years
- Projected FIRE age: 47
Change the spending to $55,000/year and the target jumps to $1,375,000, about 2 more years at the same $2,500 monthly contribution. Spending is the variable that moves the needle most.
Five FIRE Variations
Not everyone aims for the same finish line. The community has developed several variations:
| Type | Annual Spending | Typical Target | Who It Fits |
|---|---|---|---|
| Lean FIRE | Under $40,000 | Under $1M | Minimalists, low-cost areas |
| Regular FIRE | $40,000 - $80,000 | $1M - $2M | Middle-of-the-road lifestyle |
| Fat FIRE | $100,000+ | $2.5M+ | No significant lifestyle cuts |
| Coast FIRE | Varies | Varies by age | Stop saving, let growth do the work |
| Barista FIRE | Varies | Partial target | Work part-time to cover the gap |
Coast FIRE means you have enough invested that compound growth alone reaches your retirement target by a traditional retirement age. The Coast FIRE Calculator can estimate this number for your situation.
Barista FIRE means your portfolio covers most expenses, but you work part-time (enough for health insurance and spending money) rather than saving aggressively.
Why Savings Rate Matters More Than Income
A person earning $200,000 and spending $180,000 has a harder path to FIRE than someone earning $80,000 and spending $40,000. The second person needs a smaller portfolio and saves a larger percentage of income.
| Savings Rate | Approximate Years to FIRE |
|---|---|
| 20% | ~37 years |
| 30% | ~28 years |
| 40% | ~22 years |
| 50% | ~17 years |
| 60% | ~12 years |
| 70% | ~8.5 years |
These assume starting from zero with 5% real returns, driven by compound growth on every dollar you invest. Your actual timeline depends on existing savings, return assumptions, and spending consistency.
The Edges Worth Knowing
The 4% rule was built for 30-year retirements. Bengen’s original work and the Trinity Study modeled portfolios lasting about 30 years. A FIRE retirement that starts at 40 might need to last 50 years or more, and a withdrawal rate that survives 30 years does not automatically survive 50. This is why some planners lean toward 3.25% to 3.5% for very long horizons, which raises the target multiple from 25x closer to 29x or 31x. Running the same numbers at a lower rate shows how much cushion that buys.
Healthcare before 65. Individual health insurance can cost $500 to $1,500 a month before Medicare eligibility. This is often the largest underestimated expense in FIRE planning.
Sequence of returns risk. A market crash in the first few years of retirement is far more damaging than the same crash ten years in, because early withdrawals lock in losses the portfolio never recovers from. Some people hold two to three years of expenses in cash as a buffer against exactly this.
Taxes still apply. Withdrawals from traditional 401(k) and IRA accounts are taxed as income. A Roth conversion ladder or careful tax-bracket management can reduce this, but ignoring taxes overstates how far a portfolio stretches.
Spending changes over time. Most retirees spend more in their 60s (travel, hobbies), less in their 70s, and more again in their 80s (healthcare). A flat spending assumption is a simplification.
Run Your Numbers
The FIRE Calculator works from annual income, annual expenses, current savings, expected return, inflation, and the withdrawal rate you set. Enter your figures below to see your savings rate, FIRE number, years to FIRE, and projected FIRE date:
The Retirement Calculator adds detail for traditional retirement scenarios, and it is worth comparing a few FIRE tools before settling on one. If the goal is a traditional retirement date rather than an early one, the when can I retire walkthrough runs the four-input version of the same estimate.
For a year-by-year projection, the free Financial Freedom Calculator template takes monthly savings, monthly expenses, current savings, yearly return, inflation, and current age, then lists each year’s expenses, return, savings, and year-end balance until it reaches a financial freedom year and age. It is a Google Sheet you copy and keep.
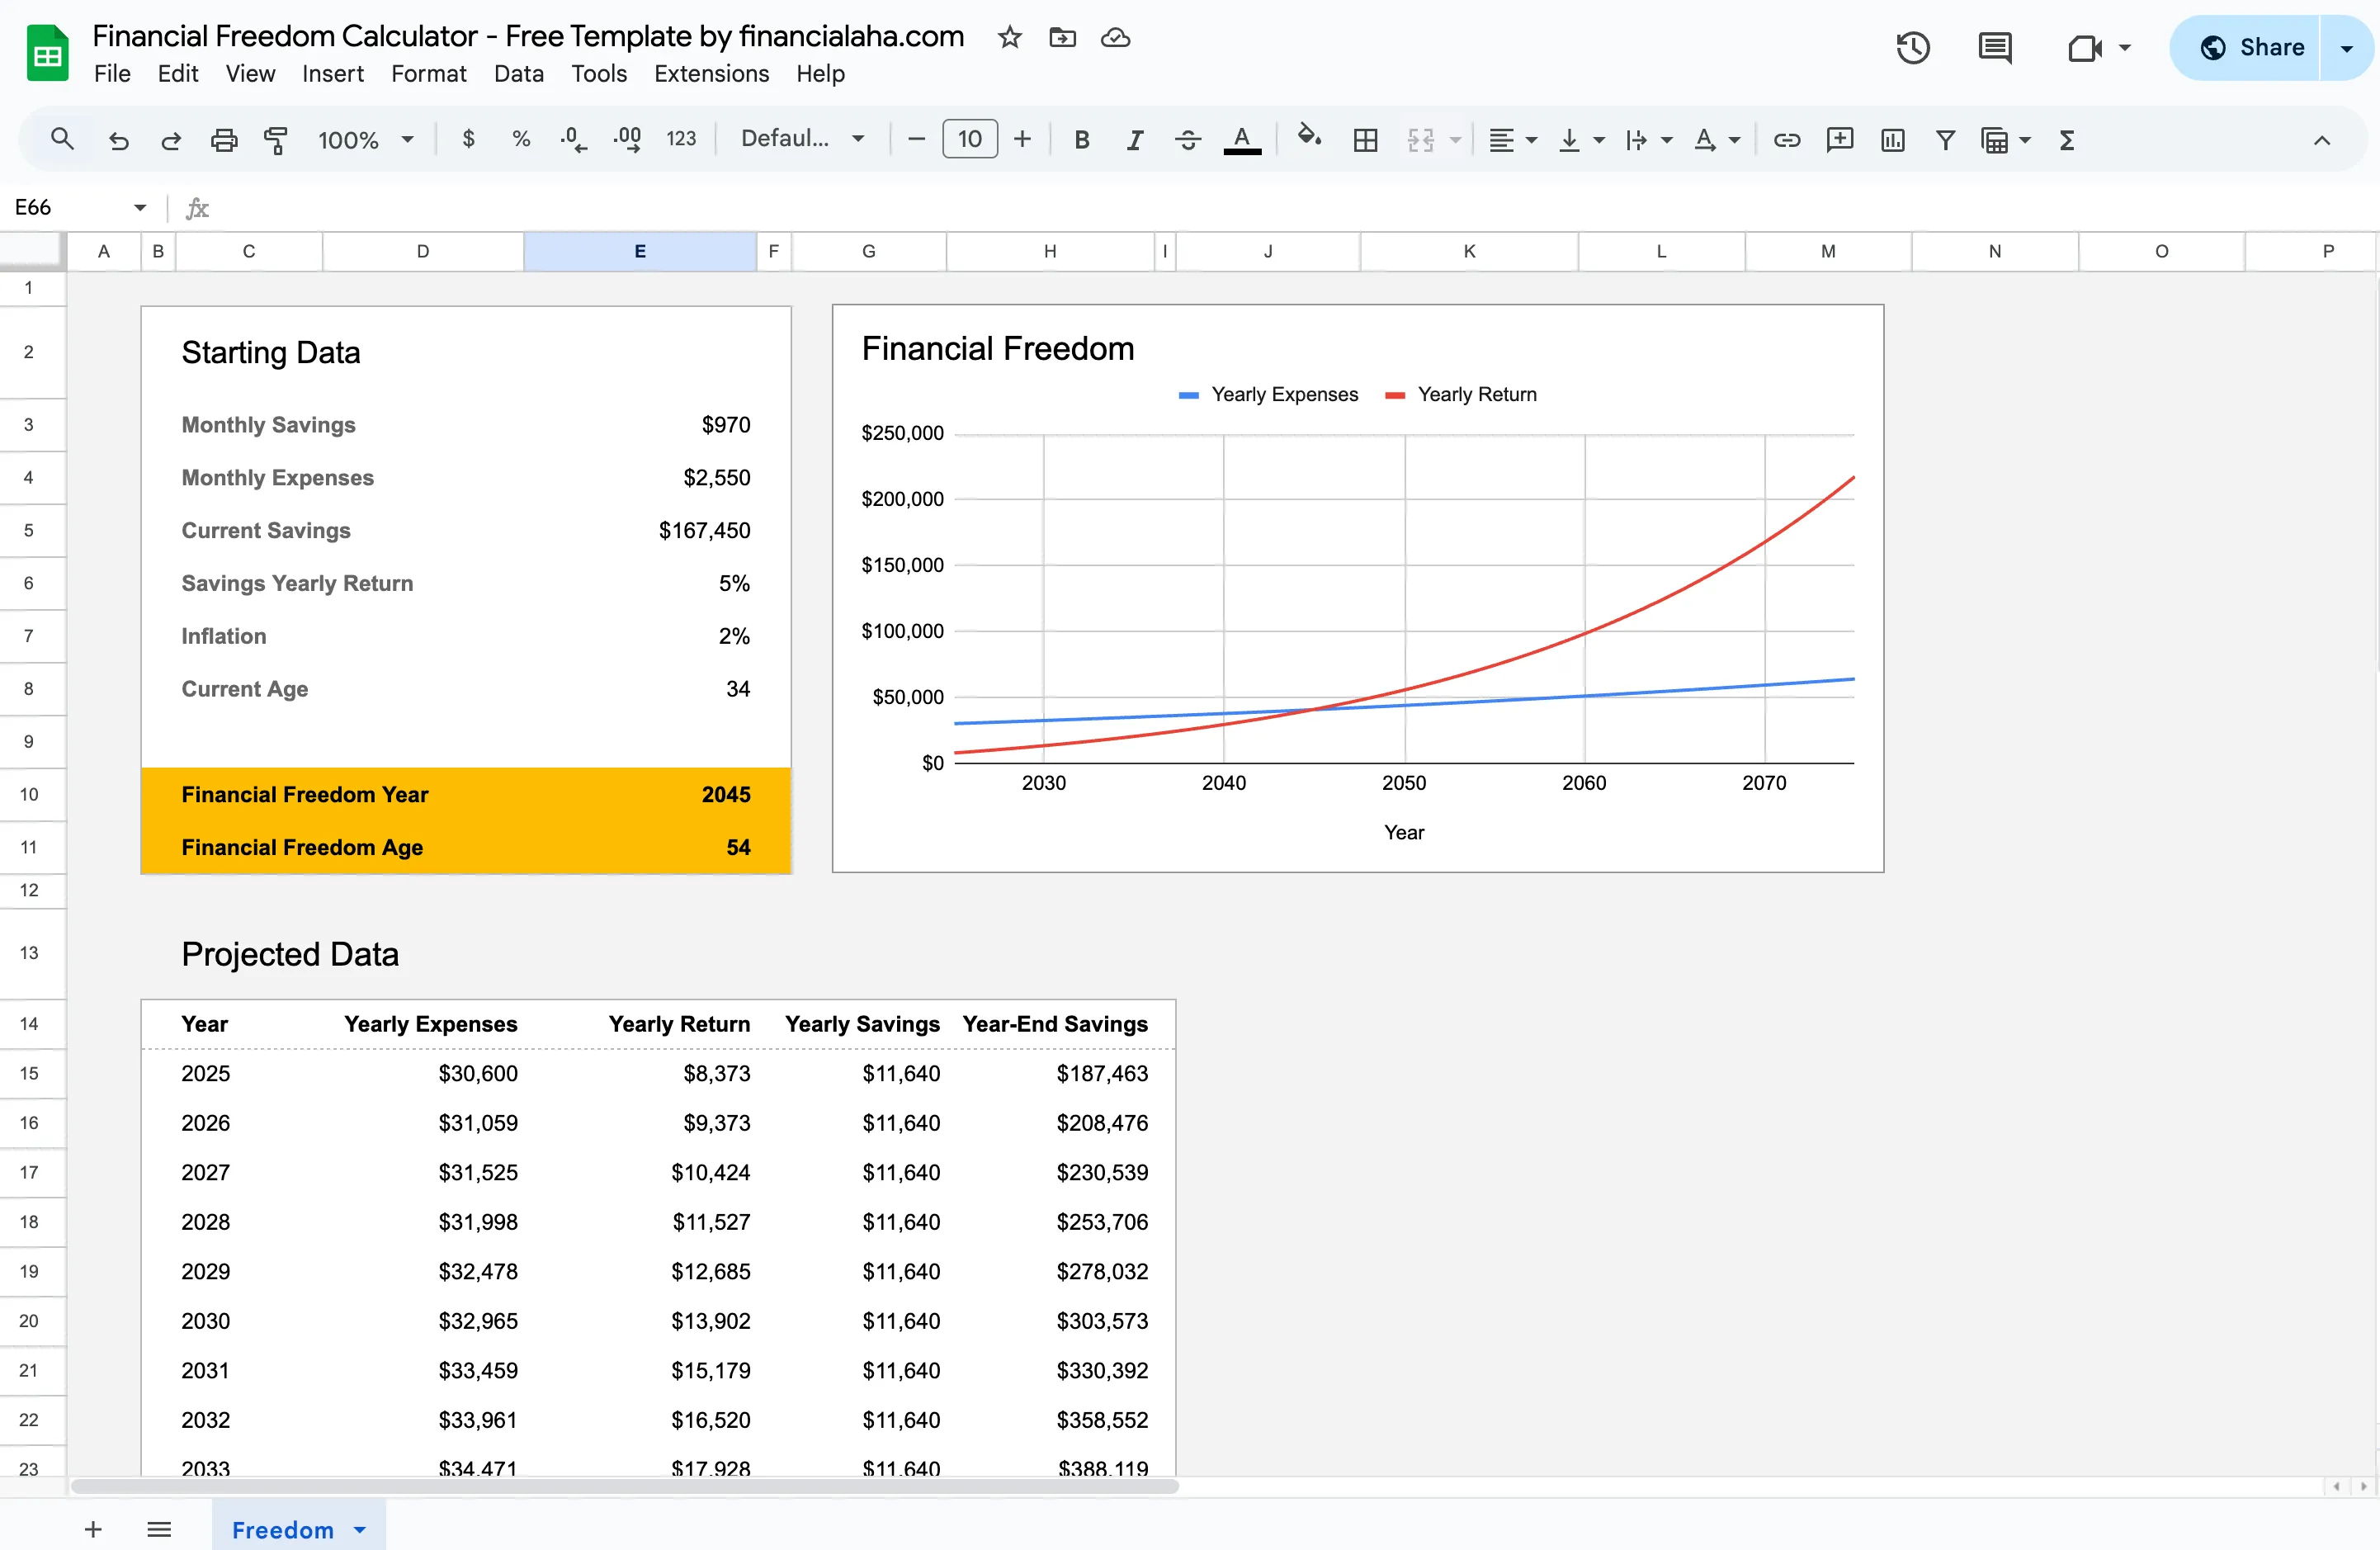
The free Financial Freedom Calculator template projects your financial-independence year and age from monthly savings, expenses, return, and inflation inputs.
Related
Frequently asked questions
What is a FIRE number?
Your FIRE number is the portfolio size needed to cover living expenses indefinitely through investment withdrawals. The standard formula is annual expenses multiplied by 25.
Is the 4% rule safe for early retirees?
The original research covered 30-year retirements. For 40-50 year retirements common in FIRE, some planners use 3.25-3.5% withdrawal rates. Running multiple scenarios is useful.
How long does it take to reach FIRE?
It depends almost entirely on savings rate. At a 50% savings rate, the math works out to roughly 17 years. At 25%, closer to 32 years. Income level matters less than the percentage saved.
Does my FIRE number include Social Security?
The basic calculation doesn't. Some people reduce their target by expected Social Security benefits. Others treat it as a safety margin and plan without it.
Can I reach FIRE on an average income?
Lower income makes it harder but not impossible. Lean FIRE targets are more realistic for average earners. Geography and lifestyle choices have an outsized impact on the math.
Should the FIRE number use pre-tax or after-tax spending?
The 25x formula works from what you actually spend in a year, so it is built on after-tax living costs. The withdrawals that cover that spending can themselves be taxable, which is why some people add a margin on top of the base number rather than assuming the full portfolio is spendable.
What real rate of return should the calculation assume?
Many FIRE estimates use a real, inflation-adjusted return somewhere between 5% and 7%. A lower assumption stretches the timeline but leaves more cushion if markets underperform. Running the numbers at more than one rate shows how sensitive the target date is to that single input.
Sources
- Determining Withdrawal Rates Using Historical Data (William Bengen, October 1994) - Journal of Financial Planning / Financial Planning Association
- Retirement Savings: Choosing a Withdrawal Rate That Is Sustainable (Trinity Study, February 1998) - AAII Journal
About this article
FIRE numbers and monthly-withdrawal figures are the arithmetic of the 4% rule: annual expenses divided by 0.04, equal to annual expenses times 25. Savings-rate timelines assume a start from zero at a 5% real annual return; the worked example uses a 7% real return. The 4% rate and the 30-year horizon behind it trace to William Bengen's October 1994 Journal of Financial Planning paper and the February 1998 Trinity Study, both cited below. Calculator inputs and outputs checked on 2026-09-10 against the shipped FIRE Calculator (annual income, annual expenses, current savings, expected return, inflation and withdrawal rate; savings rate, FIRE number, years to FIRE and projected FIRE date). Template claims checked on 2026-09-10 against the shipped Financial Freedom Calculator Google Sheet (single Freedom tab: starting data inputs, financial freedom year and age, year-by-year projected data table). Last reviewed September 2026.