
A free retirement calculator turns a handful of inputs into a 30-second estimate of your savings at retirement. A retirement planning template picks up where that stops: it runs every retirement year through to your life expectancy across conservative, base case, and optimistic scenarios, stress-tests the plan with twelve what-if cards, and recalculates as you update your own figures. The calculator is the fast first check; the template is the tool once the questions get specific.
A retirement calculator gives you a number. You enter a few inputs, click a button, and get an estimate of what your retirement savings might look like. That number is useful the way a weather forecast is useful: directionally helpful, limited in detail, and wrong in specifics.
A planning template gives you a system. It tracks real numbers over time, models different futures side by side, and evolves as your life changes. The calculator tells you where you might end up. The template helps you navigate the journey.
The Retirement Calculator handles the quick estimate. The Retirement Financial Planning Template handles the ongoing planning.
What the Calculator Does Well
The Retirement Calculator runs in the browser with no setup. Enter your current age and retirement age, current savings, monthly contribution, expected return, inflation, the annual retirement income you want, and expected monthly Social Security. It returns your projected savings at retirement, what that balance is worth in today’s dollars, any annual income gap, and a chart of the balance building year by year. The whole process takes about 30 seconds.
If you want to understand what each input does to the projection, the retirement calculator guide breaks the math down.
This is genuinely valuable in certain moments. For someone who has never thought about retirement numbers at all, a 30-second estimate is infinitely more useful than the detailed plan they never start. For a quick gut check, a sense of whether you are roughly in the right ballpark, the calculator does its job.
It is also useful for casual exploration. What if retirement was at 60 instead of 65? What if contributions went up by $500 a month? Each “what if” takes a few seconds to test. Not deeply, not precisely, but enough to get a feel for how different choices shift the outcome.
Where the Calculator Hits Its Limits
The calculator uses one growth rate, one contribution level, one inflation assumption. Life uses none of those things consistently. Income changes. Savings rates fluctuate. Market returns arrive unevenly. The calculator cannot model a career change at 45, an inheritance at 52, or a health expense at 61.
It also cannot compare scenarios side by side. Testing “retire at 62” and “retire at 67” means running the calculator twice and mentally holding both results. Three scenarios? Run it three times. It is doable but clunky, and the comparison is lost the moment you close the tab.
Most importantly, the calculator captures one moment. It does not track progress over time. Running the same calculator in January and December of the same year tells you nothing about whether you moved closer to the goal or further away - unless you remembered to write down the January number.
What the Template Adds
The Retirement Financial Planning Template works differently because it lives in a spreadsheet you own and update.
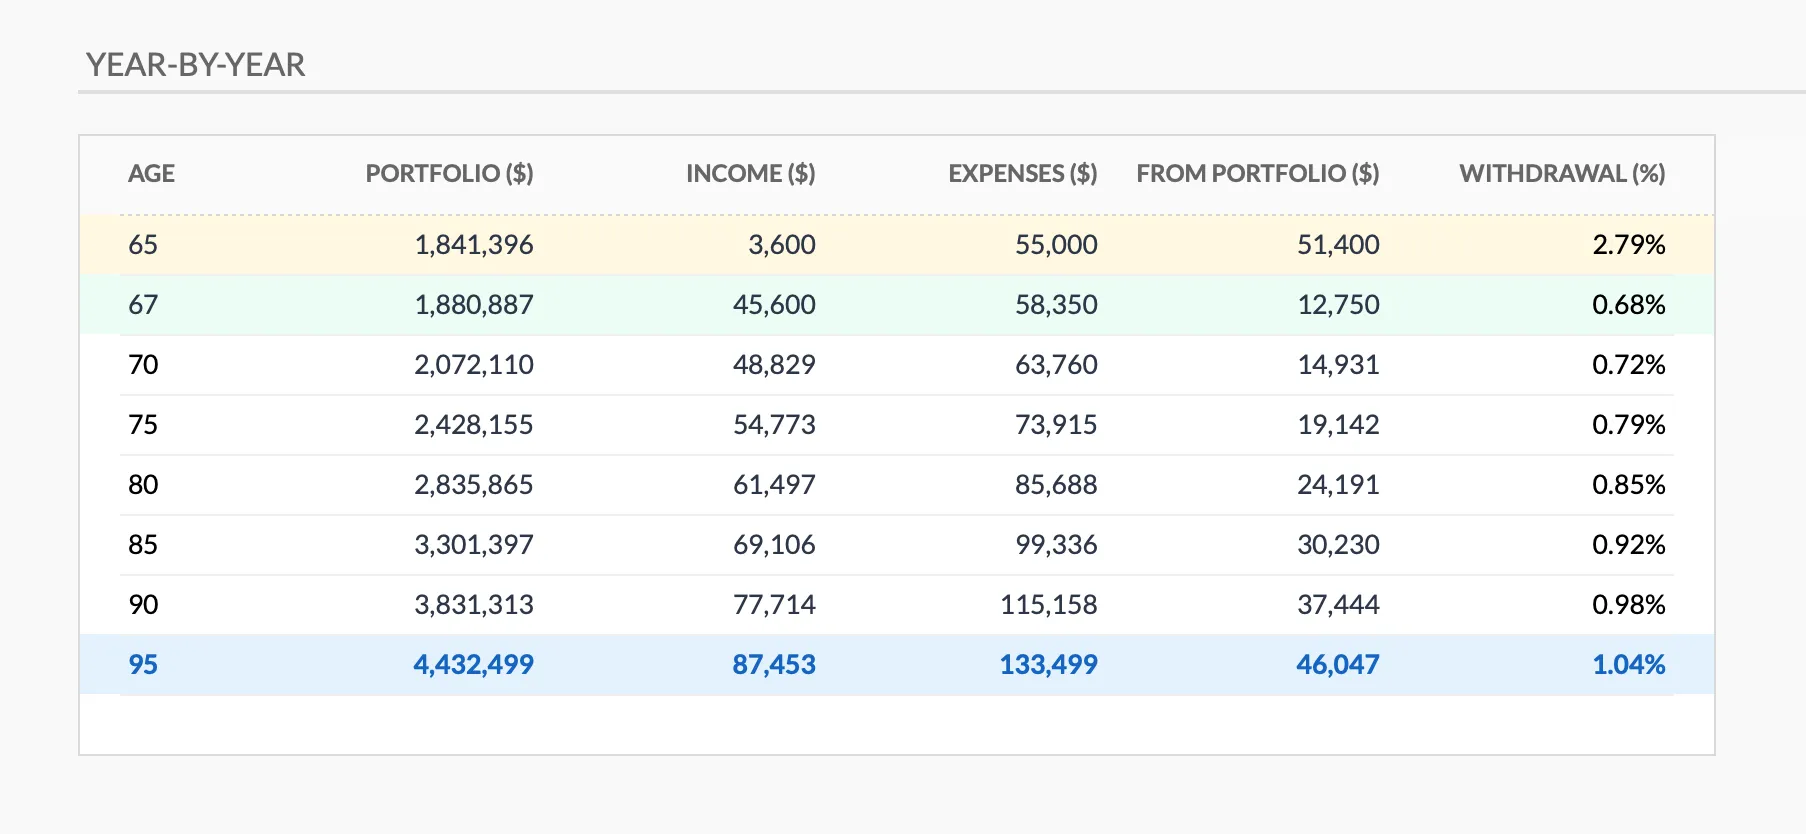 The Retirement Financial Planning and Projections template (Premium tier) models each year of retirement, not just one final number.
Year-by-year modeling. The calculator’s chart stops on the day you retire. The template starts there and runs every year through to your life expectancy. Each row shows your age, the portfolio balance, income, expenses, the amount drawn from the portfolio, and the withdrawal rate that draw represents. The withdrawal rate is an output rather than something you set, and the Summary flags whether the highest one stays under 4 percent. The Summary also marks the bridge period, the years between retiring and the age your state pension starts, when the portfolio is carrying almost all of the spending.
Scenarios that sit next to each other. The template runs three projections side by side, conservative, base case, and optimistic, each with its own return, inflation, and expense assumptions, so a good market and a bad one appear in the same view. On top of that, twelve what-if cards test one change at a time: delaying a year, retiring now, stopping the saving, adding 500 a month of savings, adding 500 a month of other income, expenses running 10 percent higher or 10 percent lower, no pension at all, a 50 percent pension cut, a 20 percent market crash, the inflation buffer the plan carries, and the minimum return it needs to work. A separate tile names the earliest age the base case supports, which turns “I wonder if I could retire early” into a figure you can look at.
Evolving with real data. Savings go in as a single figure, the total across all your retirement accounts, plus the amount you add each year. Update those after a strong market year and every projection recalculates, including the earliest retirement age. After a career change, changing the annual savings figure shows what it does to the trajectory. The numbers in the file are your own, not defaults you accepted once and forgot.
Spending drives the withdrawal. The calculator works from a balance towards the income it can support. The template works from the other end. You enter total annual expenses for the first year of retirement, the template raises them by your inflation rate every year after that, subtracts pension and other income, and whatever is left is the amount drawn from the portfolio. Spending goes in as one annual figure rather than phase by phase, so a different lifestyle gets tested through the what-if cards for expenses running 10 percent higher or lower.
When Each Tool Fits
The calculator is enough when retirement is a distant concept and you want a first data point. When someone asks “am I even close to being on track?” a quick estimate answers that. Starting with the calculator and doing nothing else is still better than doing nothing at all.
The template makes more sense when retirement is getting real, roughly within 15 to 20 years, and the questions are getting specific. How much does one more year of work add? What happens if the pension is cut in half, or never arrives? Does the plan survive a 20 percent market crash? What withdrawal rate does the spending imply at 75, or at 90? These questions need a tool that carries the numbers year by year.
A practical approach is using both. The calculator for quick checks and idle curiosity. The template for the actual plan. They are not competing tools; they serve different moments in the same process.
The Accountability Difference
There is something worth mentioning that has nothing to do with features. A calculator gives you a number and then you close the tab. The relationship with that number lasts about as long as the browser session.
A template you update quarterly is different. The file is yours, so the projection you are changing is the one you looked at last quarter. Seeing the earliest retirement age move closer after two years of steady saving provides a kind of reinforcement that a one-time calculator cannot. Conversely, seeing the numbers move the wrong direction after a spending-heavy year provides a wake-up call that is harder to ignore when it is your own data in your own spreadsheet.
The template creates accountability in a way the calculator does not. Not accountability to anyone else, but to the plan you set for yourself and the history you are building.
Getting Started
If retirement planning has not started, the Retirement Calculator is the fastest way to get a first number. It is free, needs no account, and returns a result in about 30 seconds.
If that first number raises more questions than answers, the Retirement Financial Planning Template provides the framework to explore them properly. It is a one-time purchase with free updates, built for Google Sheets, and it sits in the same retirement library that 1,000+ customers across 65+ countries already use. For a fuller walkthrough of what the template covers, see the retirement planning spreadsheet guide, and the latest round of template improvements for what changed most recently.
Related
- Retirement Financial Planning Template - Year-by-year retirement projections and scenarios
- Retirement Planning Bundle - Retirement planning toolkit
- Retirement Calculator - Free quick estimate
- Google Sheets vs Excel for retirement planning - Which spreadsheet app fits the projection
- Best FIRE calculators and spreadsheets - Tools for planning early retirement
Frequently asked questions
Is the free calculator accurate enough for planning?
For a rough estimate, yes. The expected return and the inflation rate are both yours to set, so the number reflects your own assumptions rather than fixed ones. What it runs is a single scenario that ends on your retirement date. For questions about how long the money lasts after that, a tool that models the drawdown year by year tends to be more useful.
How often do I need to update the retirement template?
Quarterly updates keep projections current without being burdensome. Major life changes, such as a new job, an inheritance, or a market shift, are worth updating right away.
What if I'm decades from retirement?
That's actually when the template tends to add the most value. Small changes in what you put away each year compound over 20 to 30 years, and the what-if cards put figures on that: one shows what saving 500 a month more does to the timeline, another shows the age the portfolio runs out if the saving stops now.
Is the retirement calculator free, and what does the template cost?
The calculator is free and needs no account. The Retirement Financial Planning & Projections template is a one-time purchase with free updates, so there is no subscription to keep it running.
Does the template work in Excel or only Google Sheets?
It is built for Google Sheets. You open your own copy, and every projection recalculates as you update it. There is no Excel version at this time.
Can the template model a market crash or one spouse retiring first?
A market drop, yes: one of the twelve what-if cards runs a 20 percent crash, alongside cards for no pension, a 50 percent pension cut, and expenses coming in 10 percent higher. Two people retiring at different times is not modelled separately. Savings go in as one combined balance and pension as one monthly total, so a second person's income and timing are folded into those figures.
About this article
Template sheets, inputs and outputs checked on 2026-09-10 against the shipped Retirement Financial Planning & Projections Google Sheet (Summary, Inputs, Projections, Helpers, Instructions tabs) and its twelve what-if cards. Calculator inputs, outputs and chart verified on 2026-09-10 against the Retirement Calculator component that powers the live page. Last reviewed September 2026.