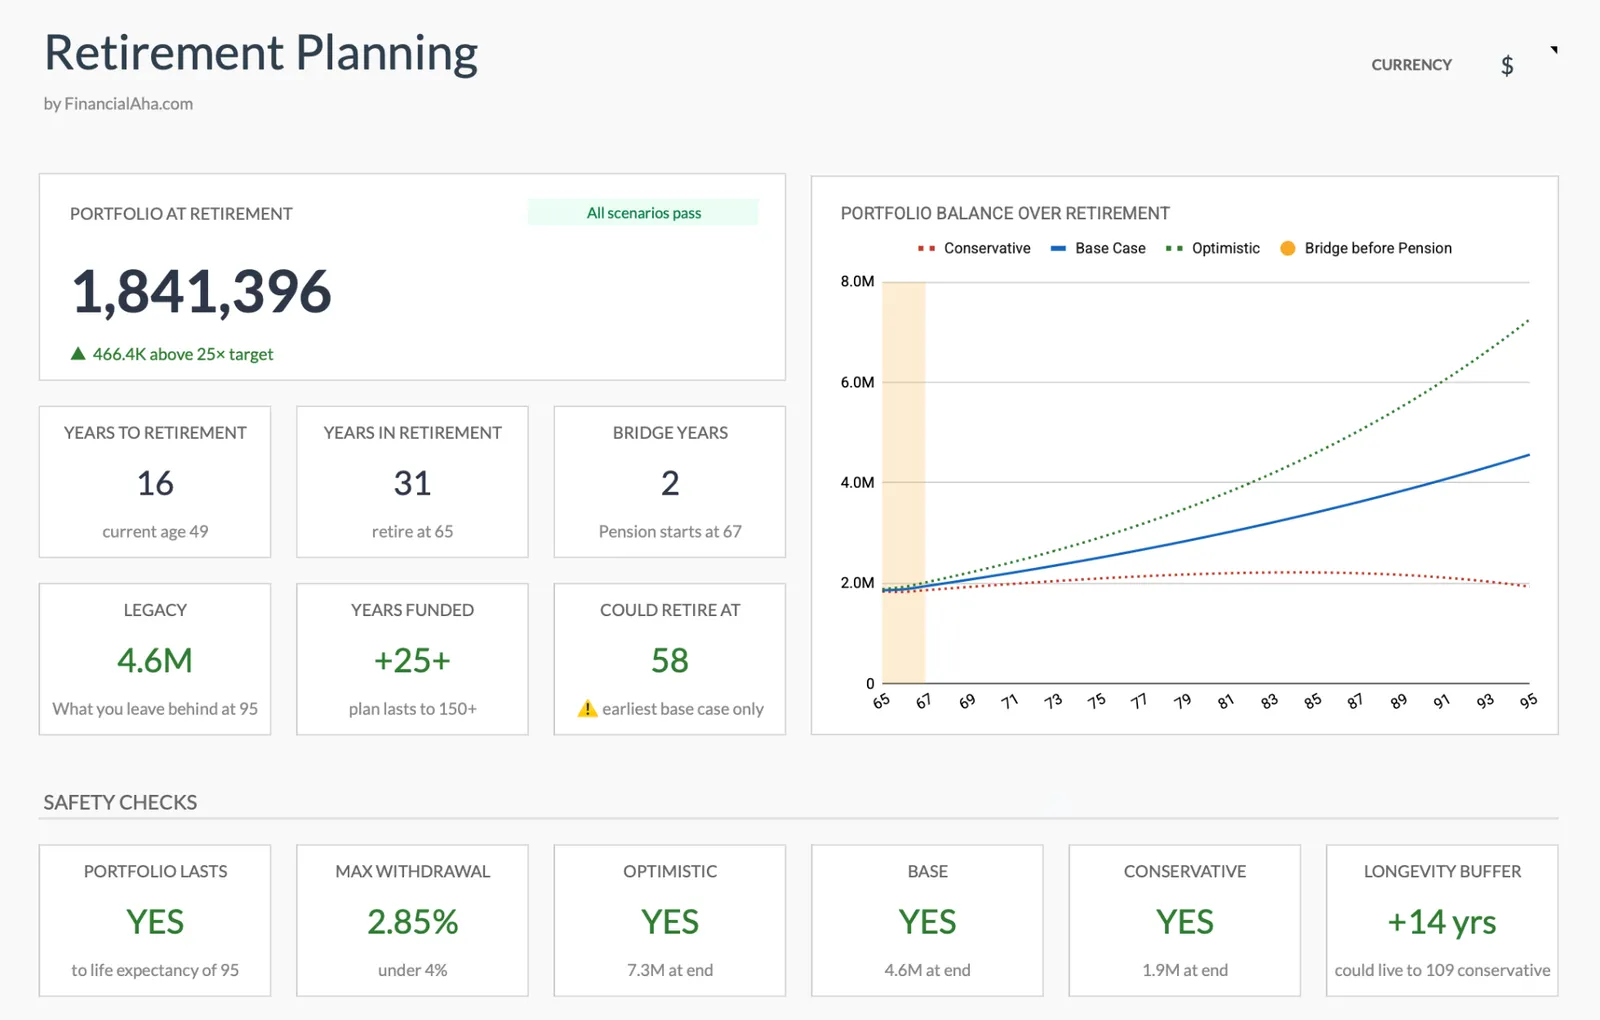
We've added scenario comparisons, what-if analysis, and a clearer picture of your retirement timeline to our retirement planning spreadsheet for Google Sheets.
We just pushed a big update to the Retirement Planning Spreadsheet for Google Sheets.
New in this update: Scenario projections (conservative, base, optimistic), what-if analysis with 12 cards, a year-by-year table at key ages, automatic safety checks, and milestone tracking. See the full template →
The core problem we kept hitting: retirement planning isn’t about one number. It’s about ranges. What if markets do well? What if they don’t? What if you retire a year early? A single projection doesn’t capture any of that.
So we fixed it.
What changed in this retirement calculator
The spreadsheet now shows three scenarios side by side - conservative, base case, and optimistic. Markets don’t follow a straight line, and your retirement plan shouldn’t pretend they do.
We also added what-if analysis. Twelve cards that stress-test your plan: working one more year, retiring now, saving an extra $500 a month, a 20 percent market crash. You can see what each change actually does to your numbers.
There’s a new year-by-year table. It lists portfolio value, income, expenses, the amount drawn from the portfolio and the withdrawal rate at key ages: the year you retire, the year your pension starts, then every five years to life expectancy. Helpful for seeing how things shift as you age.
Safety checks now flag problems automatically. Withdrawal rate creeping too high? Portfolio projected to run out before life expectancy? The template catches it.
And we added milestone tracking against the common benchmarks of 10x, 25x, 30x and 33x annual expenses. Good for knowing where you stand.
Why this is one of the best retirement planning spreadsheets
Most retirement calculators give you one number. Plug in your savings, expected returns, and retirement age - get a result. Done.
But that’s not how retirement works. Returns vary. Expenses change. Life happens.
We focused on making uncertainty visible instead of hiding it. When you can see the range (good, expected, rough), decisions get easier. Do I need to save more? Can I actually retire at 60? What happens if there’s a crash?
Those questions have answers now. Not perfect ones, but real numbers you can adjust.
Works in Google Sheets
The retirement planning spreadsheet runs entirely in Google Sheets. Your data stays in your account - we never see it. One purchase, use it forever.
Pricing
One-time purchase, lifetime access, updates included. See current pricing →
Related
- Retirement Planning Spreadsheet - Full product page with preview
- Financial Planning Template - Broader financial overview
- Coast FIRE Calculator - Early retirement planning concepts
- Retirement Planning Bundle - Retirement projections, net worth tracker and annual tax planner
Frequently asked questions
What's the difference between scenarios and what-if analysis?
Scenarios show three projections side by side - conservative, base, and optimistic returns. What-if analysis tests specific changes like retiring earlier, saving more, or facing a market crash.
Does this tell me when I can retire?
It shows projections based on your inputs - current savings, annual savings, expected returns, pension income, and planned expenses. The three scenarios give a range rather than a single answer.
Can I use this alongside my financial advisor's tools?
Yes. Many people use this for personal planning between advisory meetings. The organized data and scenario views can also make advisory conversations more productive.