Best Value Complete Financial Planning Bundle
✓ Financial Planning✓ Net Worth Tracker✓ Monthly Budgeting✓ Travel Budget Planner✓ Annual Budgeting Planner✓ Monthly Expense Tracker✓ Annual Tax Planner✓ Retirement Planning
View Bundle →

Instant digital delivery · Terms & Conditions apply

Ultimate Template - Excel & Google Sheets

Ultimate Investment Portfolio Tracker Spreadsheet Template for Google Sheets & Excel

Fifty holdings, each with a sector as well as a ticker and a name, and each one's share of the whole portfolio. The Ultimate Investment Portfolio Tracker spreadsheet template records dividend per share, annual income and yield per position, shows each holding's share of total dividend income, and reports sector performance across the year in money and percentage terms. Six sheets. Google Sheets and Excel, one file. No macros, no VBA.

See Preview

Instant digital delivery · Terms & Conditions apply

Investment Portfolio Tracker Spreadsheet Template - Ultimate version for Google Sheets and Excel

What's Included

  • A sector as well as a ticker and name on every position
  • Each holding's share of the whole portfolio
  • Dividend per share, annual income and yield per position
  • Each holding's share of total dividend income
  • Sector performance across the year, in money and percentage terms
  • Target allocation per sector against current value, with the gap
  • Portfolio dividend income and yield on the dashboard
  • Percentage return on every position
  • A chart on the dashboard
  • Works in Microsoft Excel and Google Sheets with no macros required

The FinancialAha Ultimate Investment Portfolio Tracker Spreadsheet Template for Google Sheets and Excel is a five-sheet workbook, a row per position, with a How to Use guide on a sixth tab. It ships as an Ultimate Investment Portfolio Tracker Excel template and an Ultimate Investment Portfolio Tracker Google Sheets template in one file. This Ultimate Investment Portfolio Tracker spreadsheet template groups holdings by sector, tracks dividend income and yield, and sets the allocation you intended against the one you actually have. Prices are still entered by you. No macros, no VBA.

Inside the workbook

What's inside the FinancialAha Ultimate Investment Portfolio Tracker spreadsheet template

The FinancialAha Ultimate Investment Portfolio Tracker Spreadsheet Template runs on five working sheets - three take entries from you, two report back - plus the guide. It works in both Microsoft Excel and Google Sheets and here is what the Ultimate Investment Portfolio Tracker spreadsheet holds.

  1. 01 of 05

    Dashboard

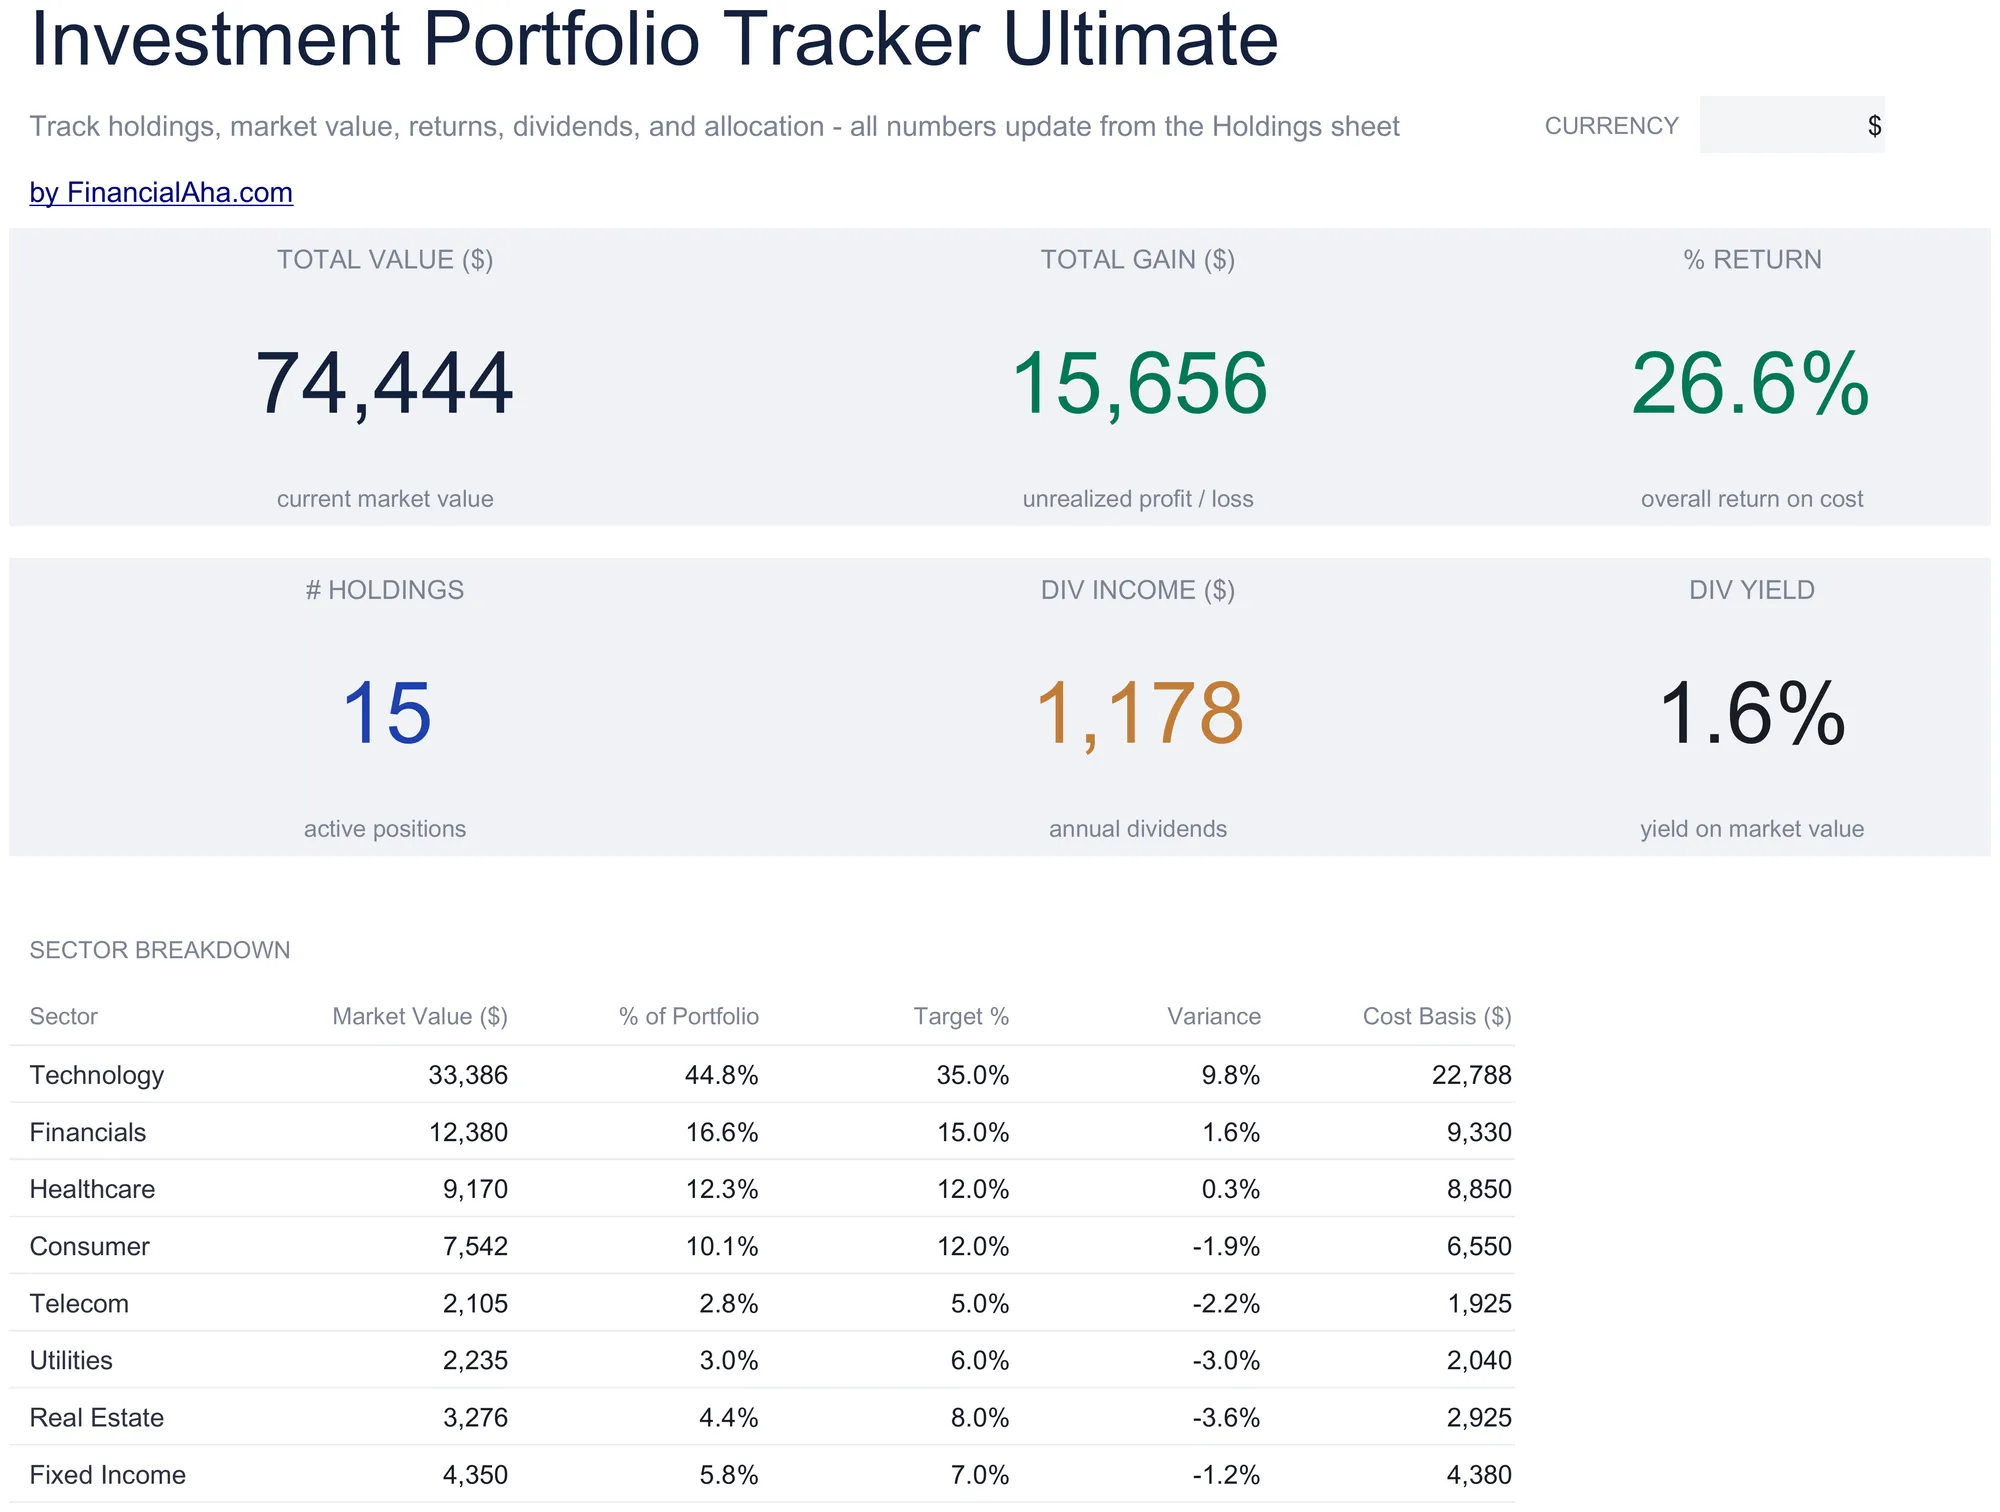
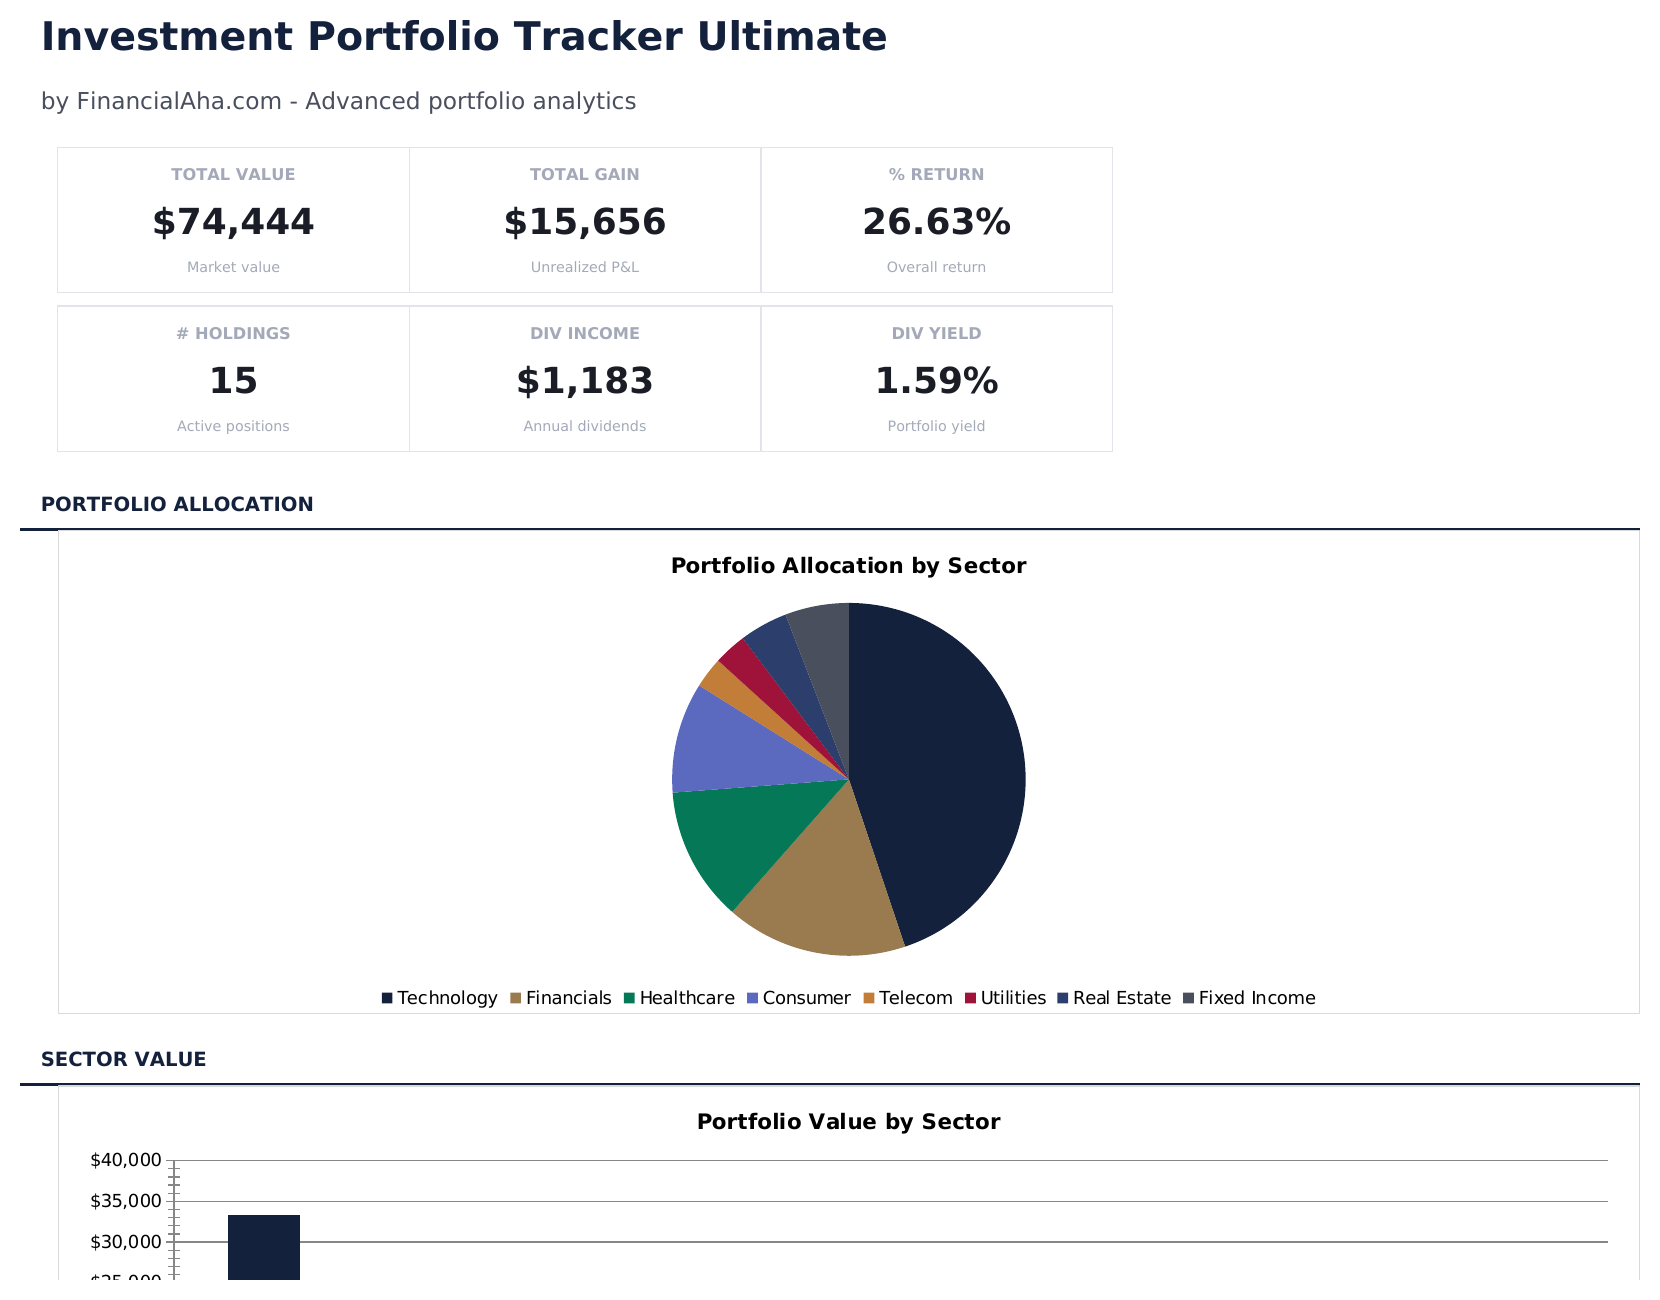
    The portfolio in six figures: total value, total gain, the overall return measured against what the holdings cost, how many positions are filled in, the dividend income they produce in a year, and the yield that represents. Beneath sits every sector with its value, its share of the portfolio, the share you were aiming for, the gap between them, and what that sector cost to build. Income shown apart from gain is the useful separation - a portfolio can be flat in value and still be paying, and those are different facts about the same holdings.

  2. 02 of 05

    Holdings

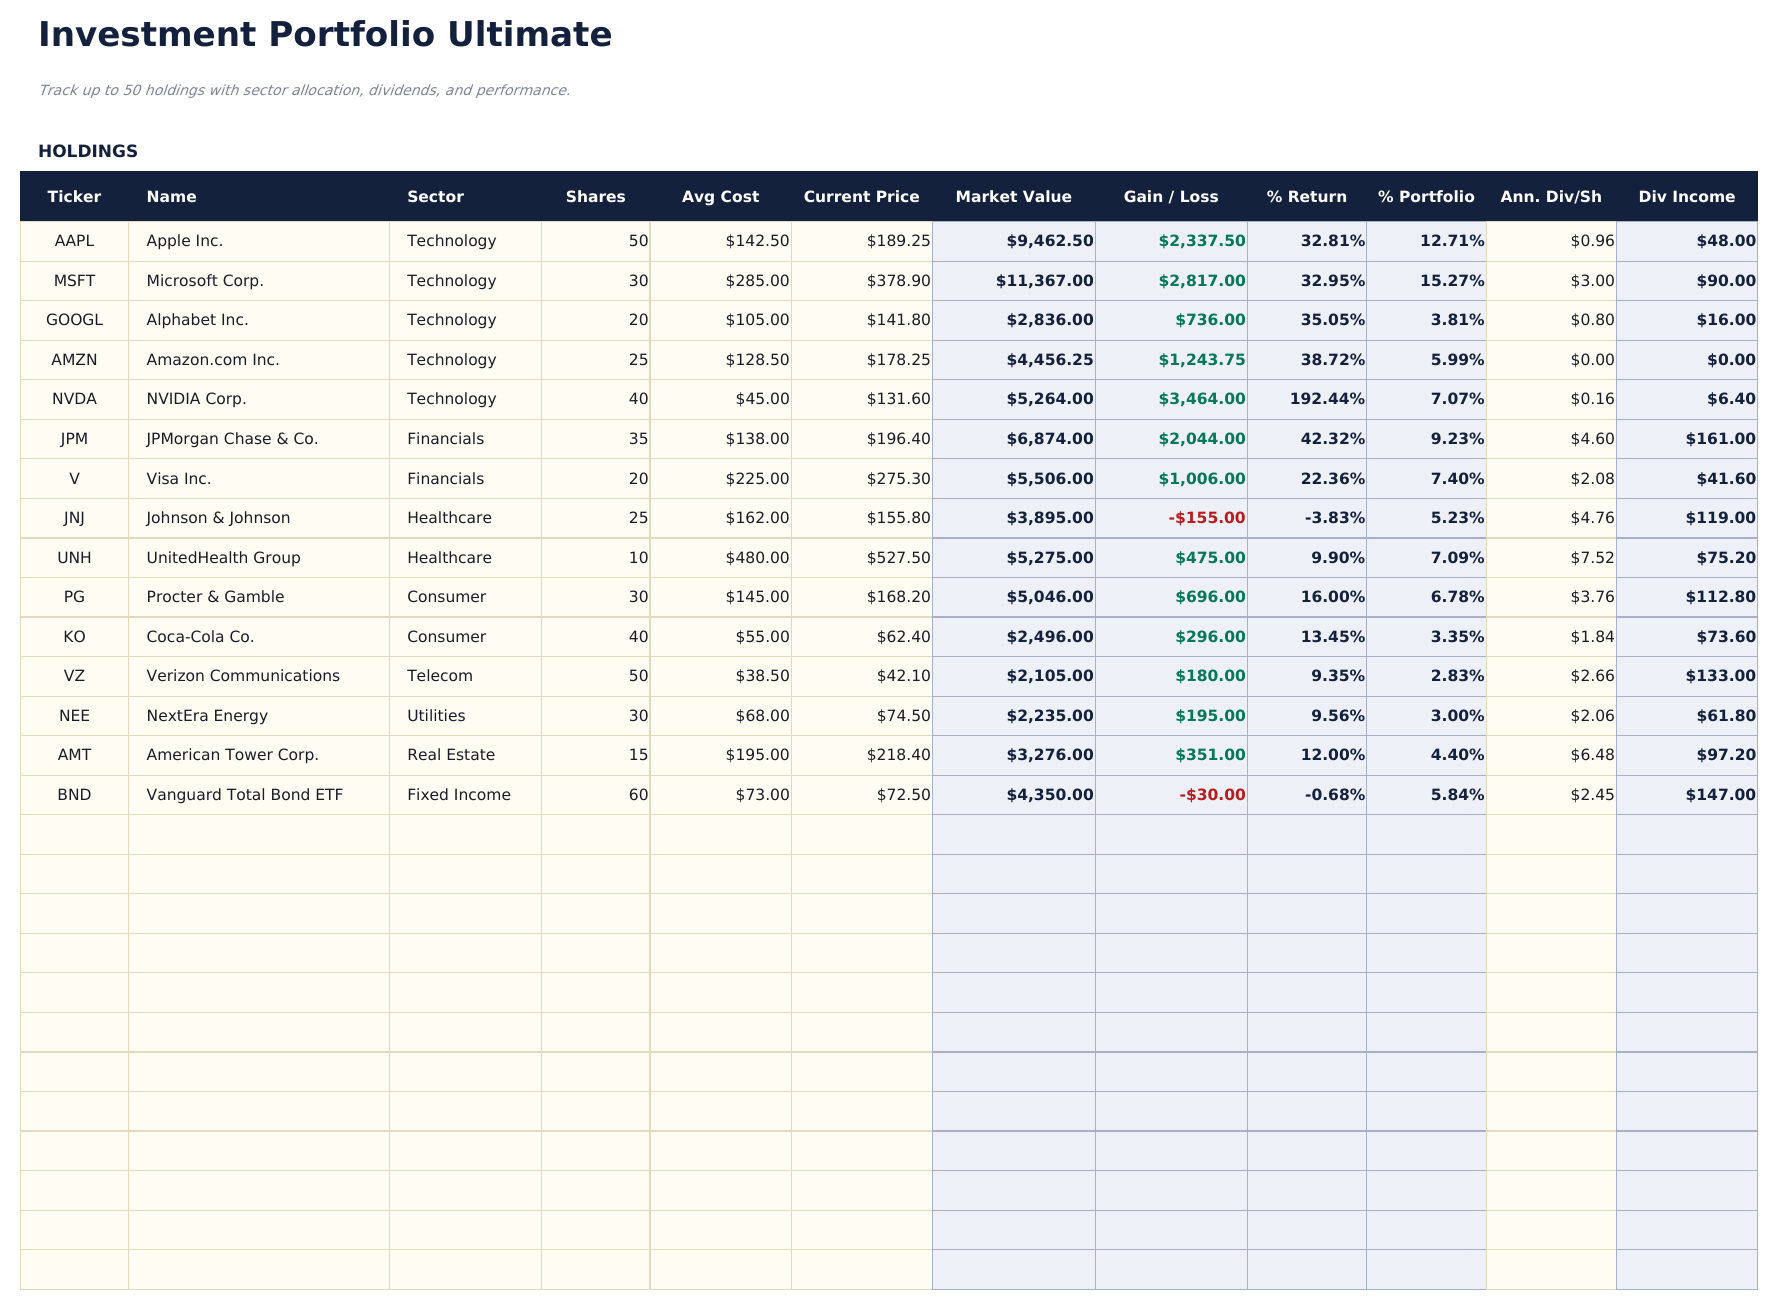
    A row per position, each with a ticker, a name, a sector, the shares and cost, the price you enter, and then value, gain, percentage return, share of the portfolio and the dividend each position pays annually. The share-of-portfolio column is what turns a list into a portfolio: a holding can be up strongly and still be too small to matter, and only that column shows it.

  3. 03 of 05

    Performance

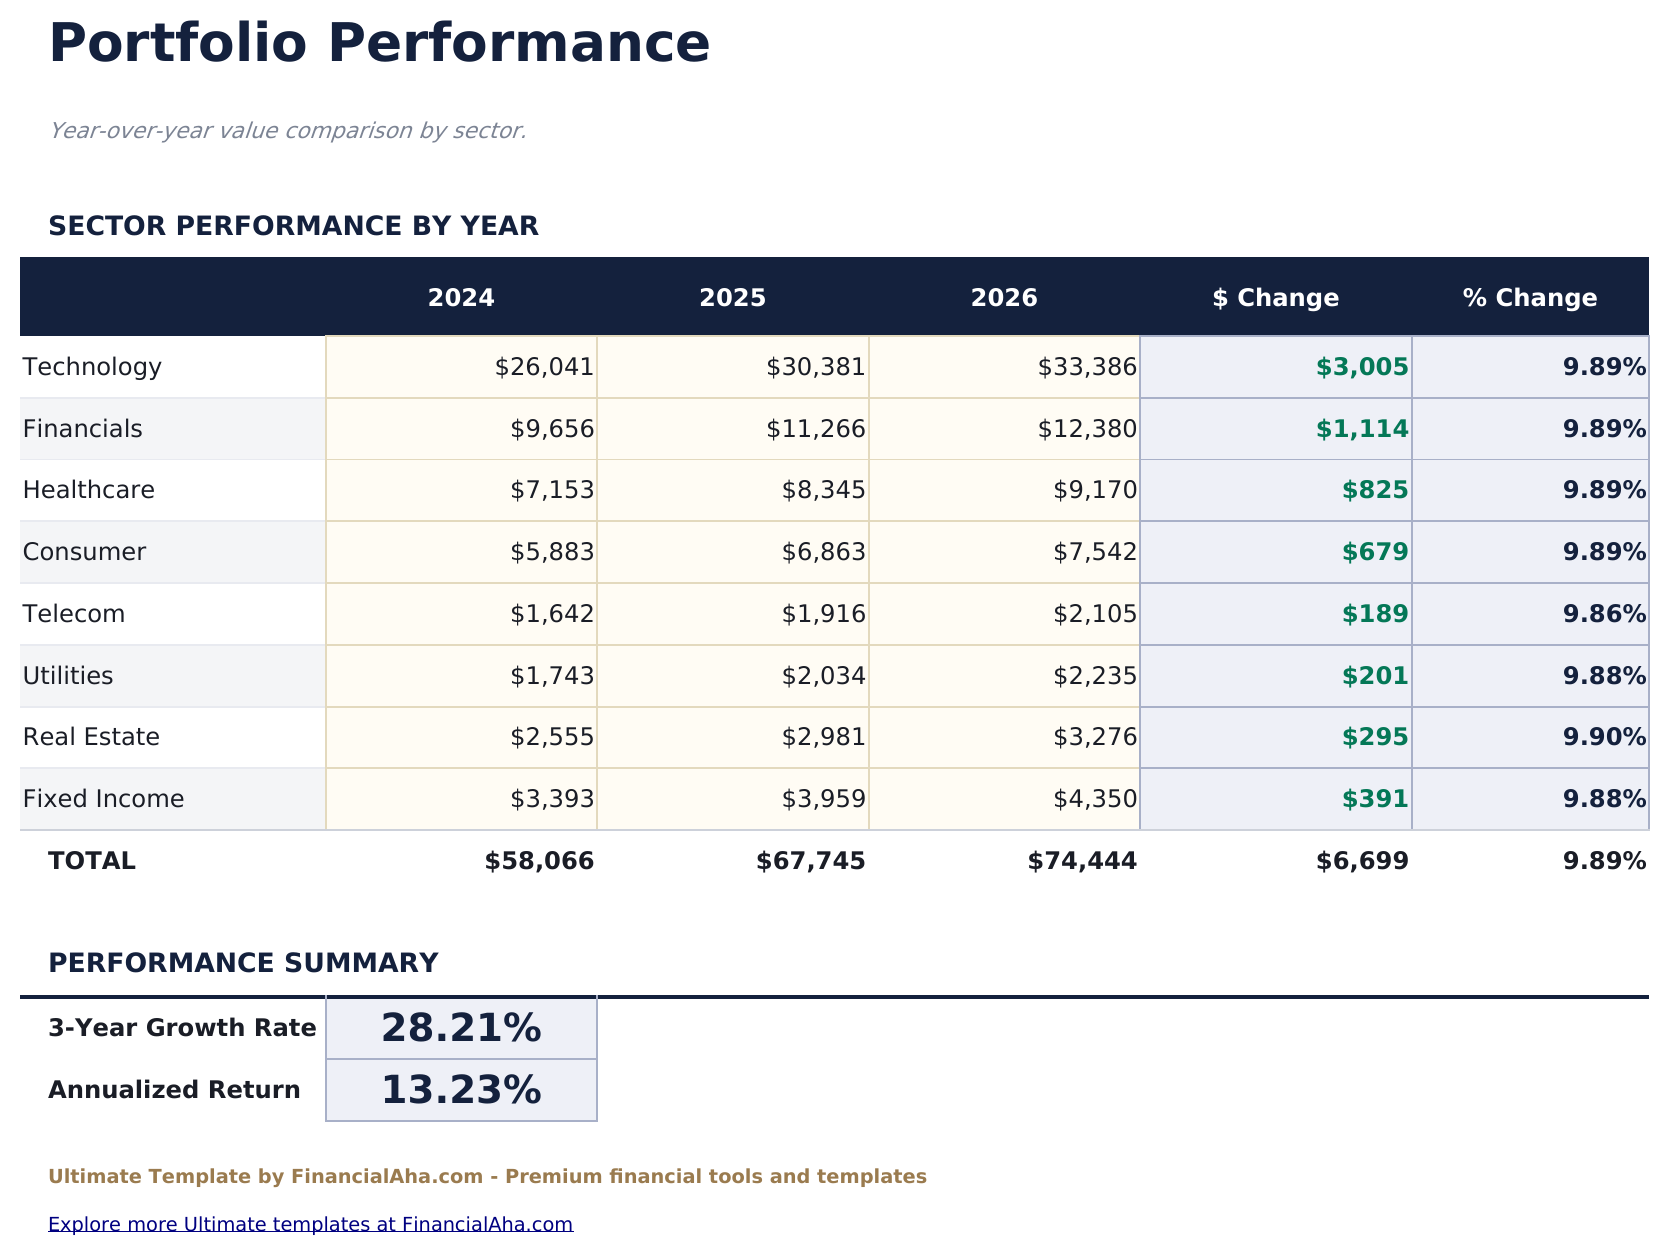
    Three years of value by sector laid side by side, with the change from the year before in money and as a percentage, and a summary underneath carrying the growth across the whole span and the annualized rate behind it. The two prior years are yours to fill in; the current year reads straight from Holdings, because the workbook holds one set of prices rather than a history of them. Grouping by sector rather than by holding is what makes the movement legible - individual positions in the same sector tend to move together, and reading them one by one hides the pattern they share.

  4. 04 of 05

    Dividends

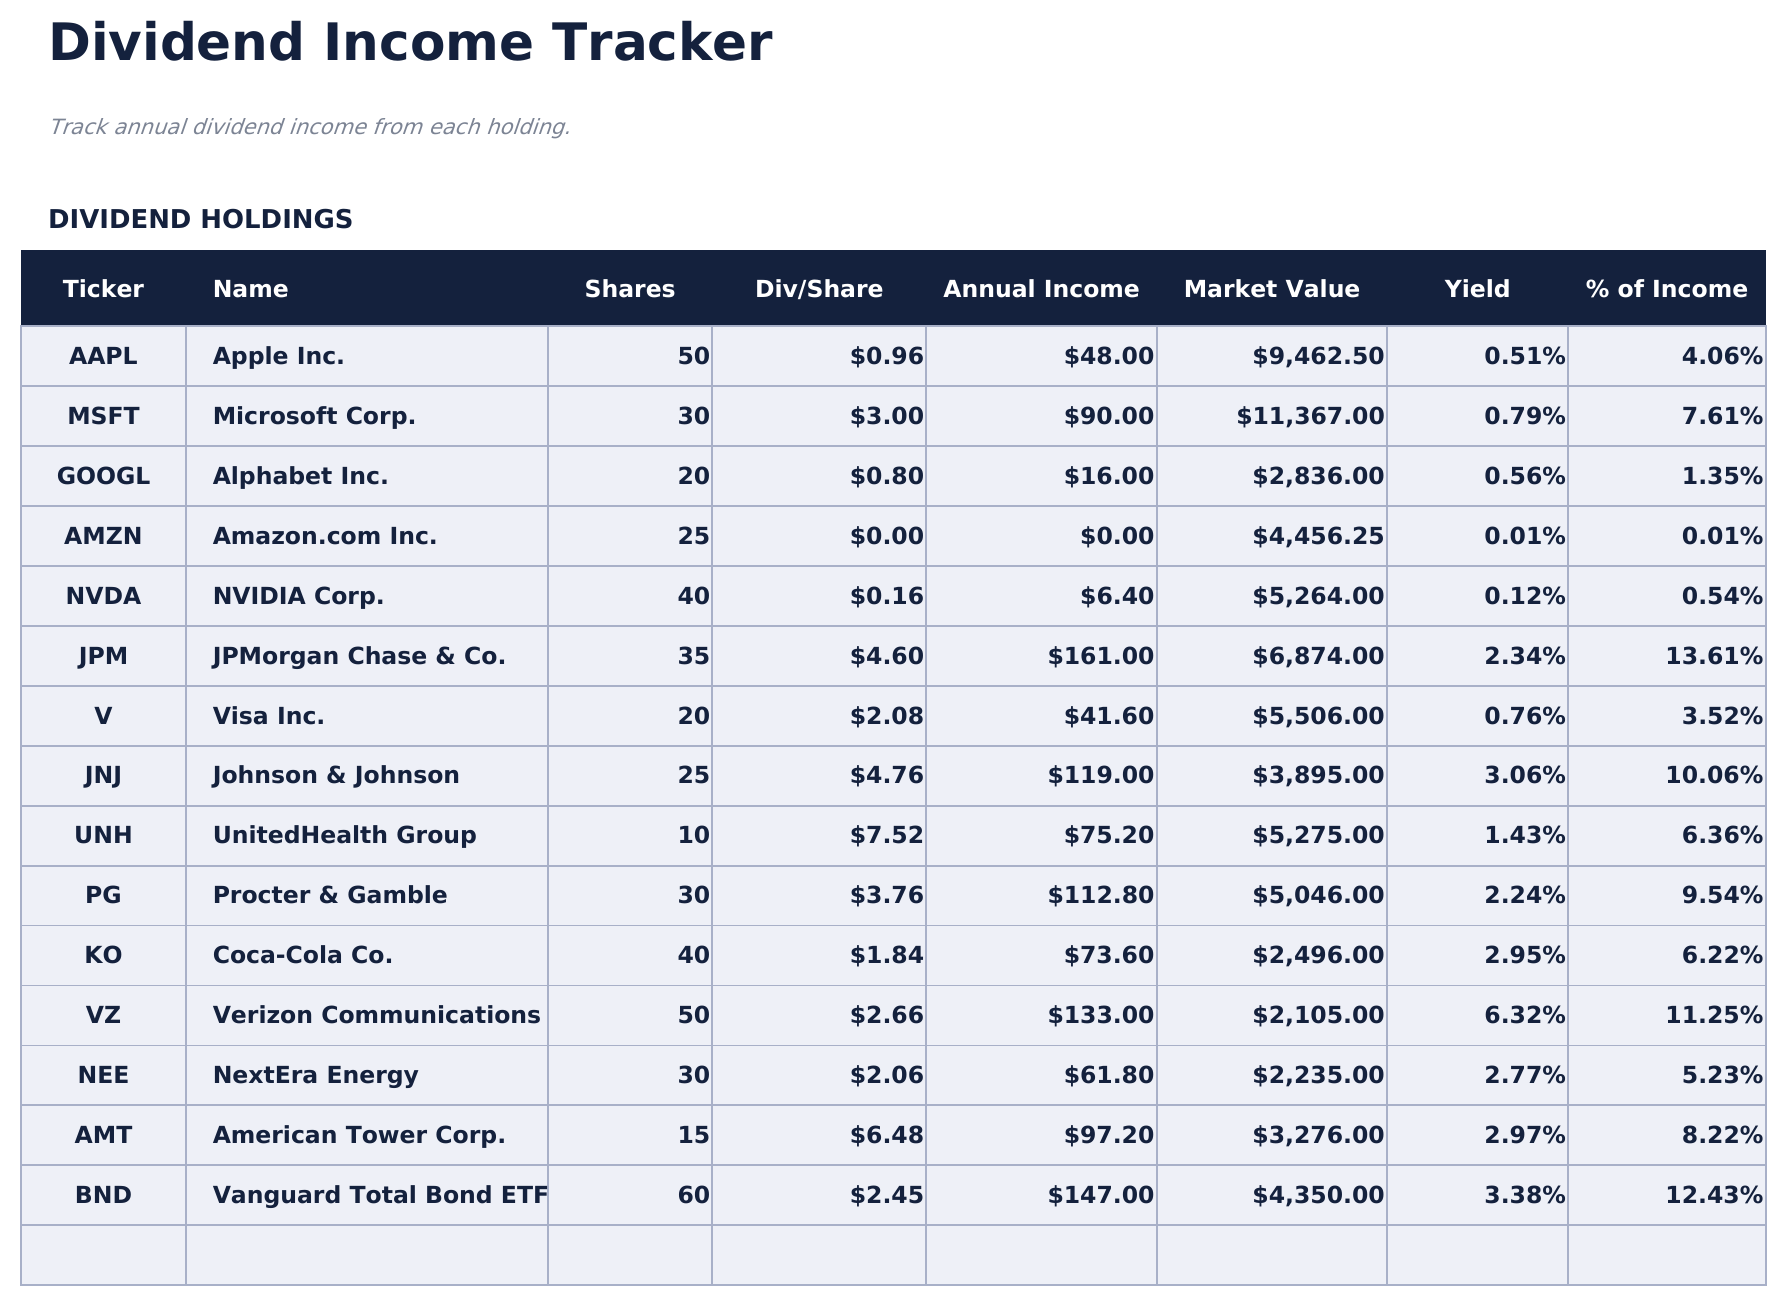
    Every income-paying holding with its dividend per share, the annual income that produces, its yield against the current value, and its share of the total income. That last column is the one worth watching, because income concentrated in a small number of holdings behaves very differently from income spread across many.

  5. 05 of 05

    Allocation

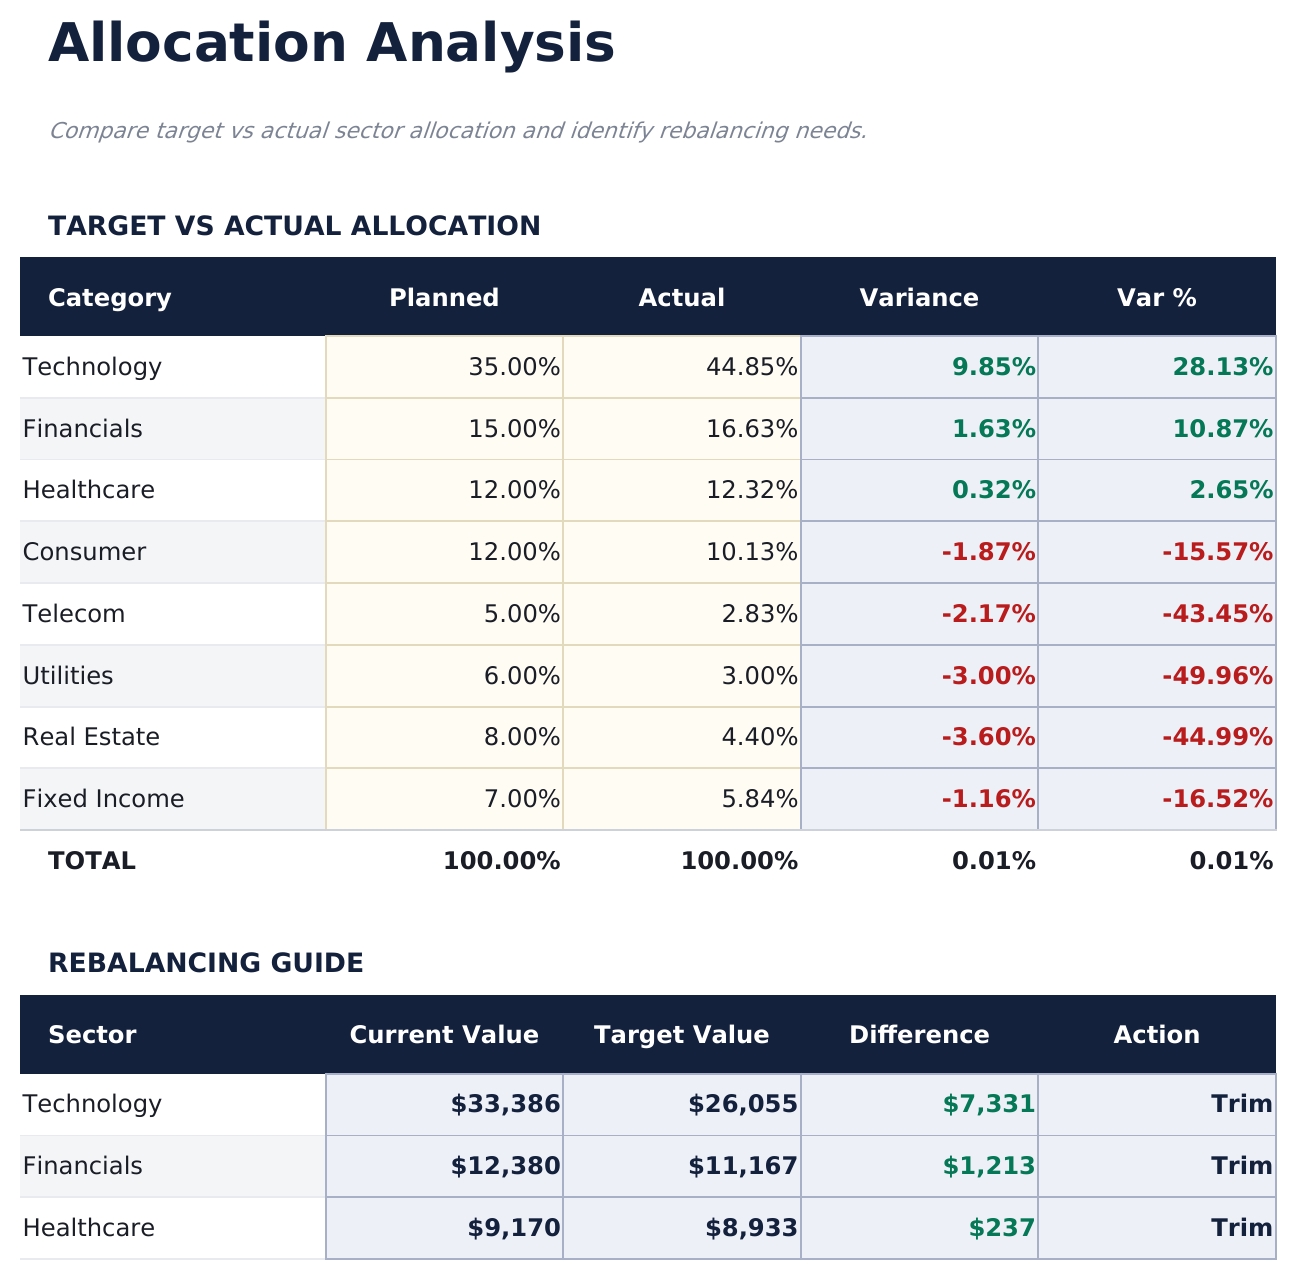
    Two views of the same gap. First each sector's target share against the share it actually holds, with the variance between them; then the same comparison in money - current value, target value, the difference, and whether closing it means trimming or adding. Both views read the one target percentage you set per sector, so moving a target moves the whole sheet and the dashboard with it. The targets are yours - the sheet does not propose them - and it reports the distance from them rather than making a case for any particular mix.

  6. Included guide

    How to Use

    A step-by-step guide on its own tab, covering setup, how the dividend and yield figures are built, and how the target allocation reads. Because it ships inside the file, the instructions travel with the template wherever it is opened.

Works in both Google Sheets and Excel

Ultimate Investment Portfolio Tracker Spreadsheet template for Google Sheets

Upload the Ultimate Investment Portfolio Tracker Spreadsheet Template to Drive, right-click it, and choose "Open with Google Sheets". This Ultimate Investment Portfolio Tracker Google Sheets template needs no conversion step and the chart survives the trip intact. The cross-sheet references that build the sector and dividend views rely on the existing tab names, so those are worth leaving alone.

Ultimate Investment Portfolio Tracker Google Sheets template setup

A shared copy of the Ultimate Investment Portfolio Tracker Google Sheets template suits investments held jointly or reviewed with an adviser, since every figure behind the allocation view is visible rather than asserted. Sheets version history covers a price typed over.

Sharing the Ultimate Investment Portfolio Tracker Google Sheet

The Ultimate Investment Portfolio Tracker Google Sheet is built around periodic updates rather than daily ones, since prices are yours to enter. Refreshing them monthly or quarterly is enough for what the allocation and dividend views report, because both move only when a price or a share count does.

Ultimate Investment Portfolio Tracker Spreadsheet template for Excel

The Ultimate Investment Portfolio Tracker spreadsheet Excel download is a plain .xlsx. Excel opens this Ultimate Investment Portfolio Tracker Excel template directly, with no import step and no compatibility prompt, and the chart is a native Excel chart that redraws as prices change. There are no macros and no VBA in the file, so it opens without a security warning.

Ultimate Investment Portfolio Tracker Excel template setup

The same Ultimate Investment Portfolio Tracker Excel template opens in Excel on Windows, Excel on Mac, and Excel for the web. It is also the identical file you would upload to Drive, so there is no separate Ultimate Investment Portfolio Tracker spreadsheet download to choose between.

Ultimate Investment Portfolio Tracker spreadsheet Excel notes

The Ultimate Investment Portfolio Tracker spreadsheet Excel file carries no macros and no VBA, so Excel opens it without a trust prompt. The same Ultimate Investment Portfolio Tracker spreadsheet Excel download also opens in Excel for the web.

Opening the Ultimate Investment Portfolio Tracker spreadsheet Excel file

Nothing in the Ultimate Investment Portfolio Tracker Excel template is version-specific, so this Ultimate Investment Portfolio Tracker spreadsheet Excel workbook behaves identically in Excel on Windows, Excel on Mac, and older builds.

Spreadsheet template highlights

What the Ultimate Investment Portfolio Tracker spreadsheet template tracks

The holdings sheet feeds four reporting sheets. These are the columns the Ultimate Investment Portfolio Tracker Spreadsheet Template works from:

Ticker
the symbol for the holding
Name
what it actually is
Sector
the grouping the performance and allocation sheets report on
Shares
how many you own
Avg Cost
what you paid per share on average
Current Price
the latest price, entered by you rather than fetched
Market Value auto
derived, shares multiplied by the current price
Gain / Loss auto
derived, in money terms
% Return auto
derived, which makes positions of different sizes comparable
% Portfolio auto
derived, how much of the whole this holding represents
Ann. Div/Sh
the dividend each share pays in a year
Div Income auto
derived, what that comes to across your holding
Yield auto
derived, income measured against current value
Target %
the share of the portfolio you are aiming at for a sector, set by you
Target Value auto
derived, that share applied to the current portfolio value
Difference auto
derived, how far the current value sits from that target
vs Target auto
derived, whether the sector sits above, below or on the target you set

Compare builds

FinancialAha Investment Portfolio Tracker spreadsheet template: Free, Essentials, and Ultimate compared

Feature Free View Spreadsheet Template Essentials View Spreadsheet Template Ultimate This page
Working sheets 1 2 5
Holdings 16 20 50
Prices Typed in Typed in Typed in
Percentage return Per holding Per holding
Holding name beside ticker Yes Yes
Sector Per holding
Share of portfolio Per holding
Dividend income and yield Yes
Target allocation against actual Yes, with the gap
Charts 1 1

The FinancialAha Ultimate Investment Portfolio Tracker Spreadsheet Template covers five working sheets. The Free Investment Portfolio Tracker Spreadsheet Template holds sixteen and reports gain in money only. The Essentials Investment Portfolio Tracker Spreadsheet Template for Google Sheets and Excel takes twenty and adds a percentage return. This build groups holdings by sector, reports each one's share of the portfolio, tracks the dividend income and yield every position produces, and sets the allocation you intended against the one you actually have - with the gap between them reported rather than argued for.

Good to know

Notes on working in the Ultimate Investment Portfolio Tracker spreadsheet template

  • Prices are typed rather than fetched in every tier. The sheet is only as current as your last update.
  • Income is reported apart from gain because a portfolio can be flat in value and still be paying.
  • The share-of-portfolio column is what turns a list into a portfolio - a holding can be up strongly and still be too small to matter.
  • The allocation targets are yours to set. The sheet reports the distance from them and does not propose a mix.
  • The currency dropdown sits on the Dashboard and relabels money columns across the whole Ultimate Investment Portfolio Tracker spreadsheet. It changes the label only and does not convert the numbers.

How to Use This Template

1

List your holdings

Up to fifty, each with a ticker, name, sector, shares and average cost.

2

Update prices

Type the latest price per holding. Nothing fetches quotes.

3

Add dividends per share

The annual income, yield and share of total income follow from it.

4

Set your target allocation

Per sector. The sheet reports how far the current value sits from it.

Stress-tested with AI.

Every template starts with deep research into how people actually track the topic. We design the layout, build the formulas, and polish the design until it feels like something we would use ourselves. Along the way, we use AI to stress-test the calculations: unusual inputs, edge cases, and formula behavior, checked until the numbers hold.

One-time purchase. No subscription. Works in Excel & Google Sheets.

Frequently Asked Questions

Is the FinancialAha Ultimate Investment Portfolio Tracker Spreadsheet Template a Google Sheets template?

Yes. Upload the file to Drive and choose "Open with Google Sheets". The Ultimate Investment Portfolio Tracker Google Sheets template needs no conversion step and the chart survives the trip intact. The cross-sheet references rely on the existing tab names, so those are worth leaving alone.

Is the FinancialAha Ultimate Investment Portfolio Tracker Spreadsheet Template an Excel template?

Yes. The download is a plain .xlsx, so the Ultimate Investment Portfolio Tracker Excel template opens directly in Excel with no import step. The chart is a native Excel chart, and there are no macros or VBA.

Will the FinancialAha Ultimate Investment Portfolio Tracker spreadsheet Excel file open in older versions of Excel?

Yes. The Ultimate Investment Portfolio Tracker spreadsheet Excel workbook ships as a plain .xlsx, so it opens identically in current Excel and in builds that predate dynamic arrays.

Does the Ultimate Investment Portfolio Tracker spreadsheet pull prices automatically?

No. Prices are typed in every tier - there is no feed, no web query and no macro anywhere in the file. It stays as current as your last update.

How does the allocation sheet work in the Ultimate Investment Portfolio Tracker spreadsheet?

You set a target percentage per sector. The sheet reports the current value, the target value that percentage works out to, and the difference between them. The targets are yours; it does not propose a mix or tell you what to hold.

What does the dividend sheet show in the Ultimate Investment Portfolio Tracker spreadsheet?

Every income-paying holding with its dividend per share, the annual income that produces, the yield against current value, and its share of your total income. That last column matters because income concentrated in a few holdings behaves very differently from income spread widely.

Why does the Ultimate Investment Portfolio Tracker spreadsheet group by sector?

Because positions in the same sector tend to move together, so reading them one at a time hides the pattern. The performance sheet lays three years of value out by sector, with the change from the year before in money and as a percentage.

Can I add holdings to the Ultimate Investment Portfolio Tracker spreadsheet?

A row per position on the holdings sheet, with the dividend sheet covering the same set, and you can right-click inside the table and choose Insert when you need another. The Free build takes sixteen and the Essentials build takes twenty.

What do I get after buying the Ultimate Investment Portfolio Tracker spreadsheet template?

You receive the Ultimate Investment Portfolio Tracker spreadsheet template as an Excel file (.xlsx) that works in Microsoft Excel and Google Sheets. Download it immediately after purchase - no signup or account required.

Is there a free Ultimate Investment Portfolio Tracker spreadsheet template?

Yes. A free version of the Ultimate Investment Portfolio Tracker spreadsheet template is available with basic features. The Ultimate version adds advanced analysis, more capacity, and additional sheets.

What if the Ultimate Investment Portfolio Tracker spreadsheet template does not work for me?

Contact us and we will help troubleshoot. The Ultimate Investment Portfolio Tracker spreadsheet template works in Microsoft Excel and Google Sheets with no macros required.

Ultimate

Highlights:

Instant download after purchase
No macros or VBA required
All formulas auto-calculate
No subscription required
Works in
Excel Google Sheets

Looking for more Ultimate templates?

We offer Ultimate versions of our most popular spreadsheet templates with advanced features, more capacity, and deeper analysis.

Private & secure

Your financial data stays on your device. We never see it.

Learn more →

Need help?

Check our guides or reach out with questions.

View FAQ →