Calculadora de Ganhos de Capital Modelo Essentials
Calcule ganhos e perdas de capital em vendas de investimentos. Rastreie lotes de impostos com detalhes de compra e venda para relatório de impostos.
O Que Está Incluído
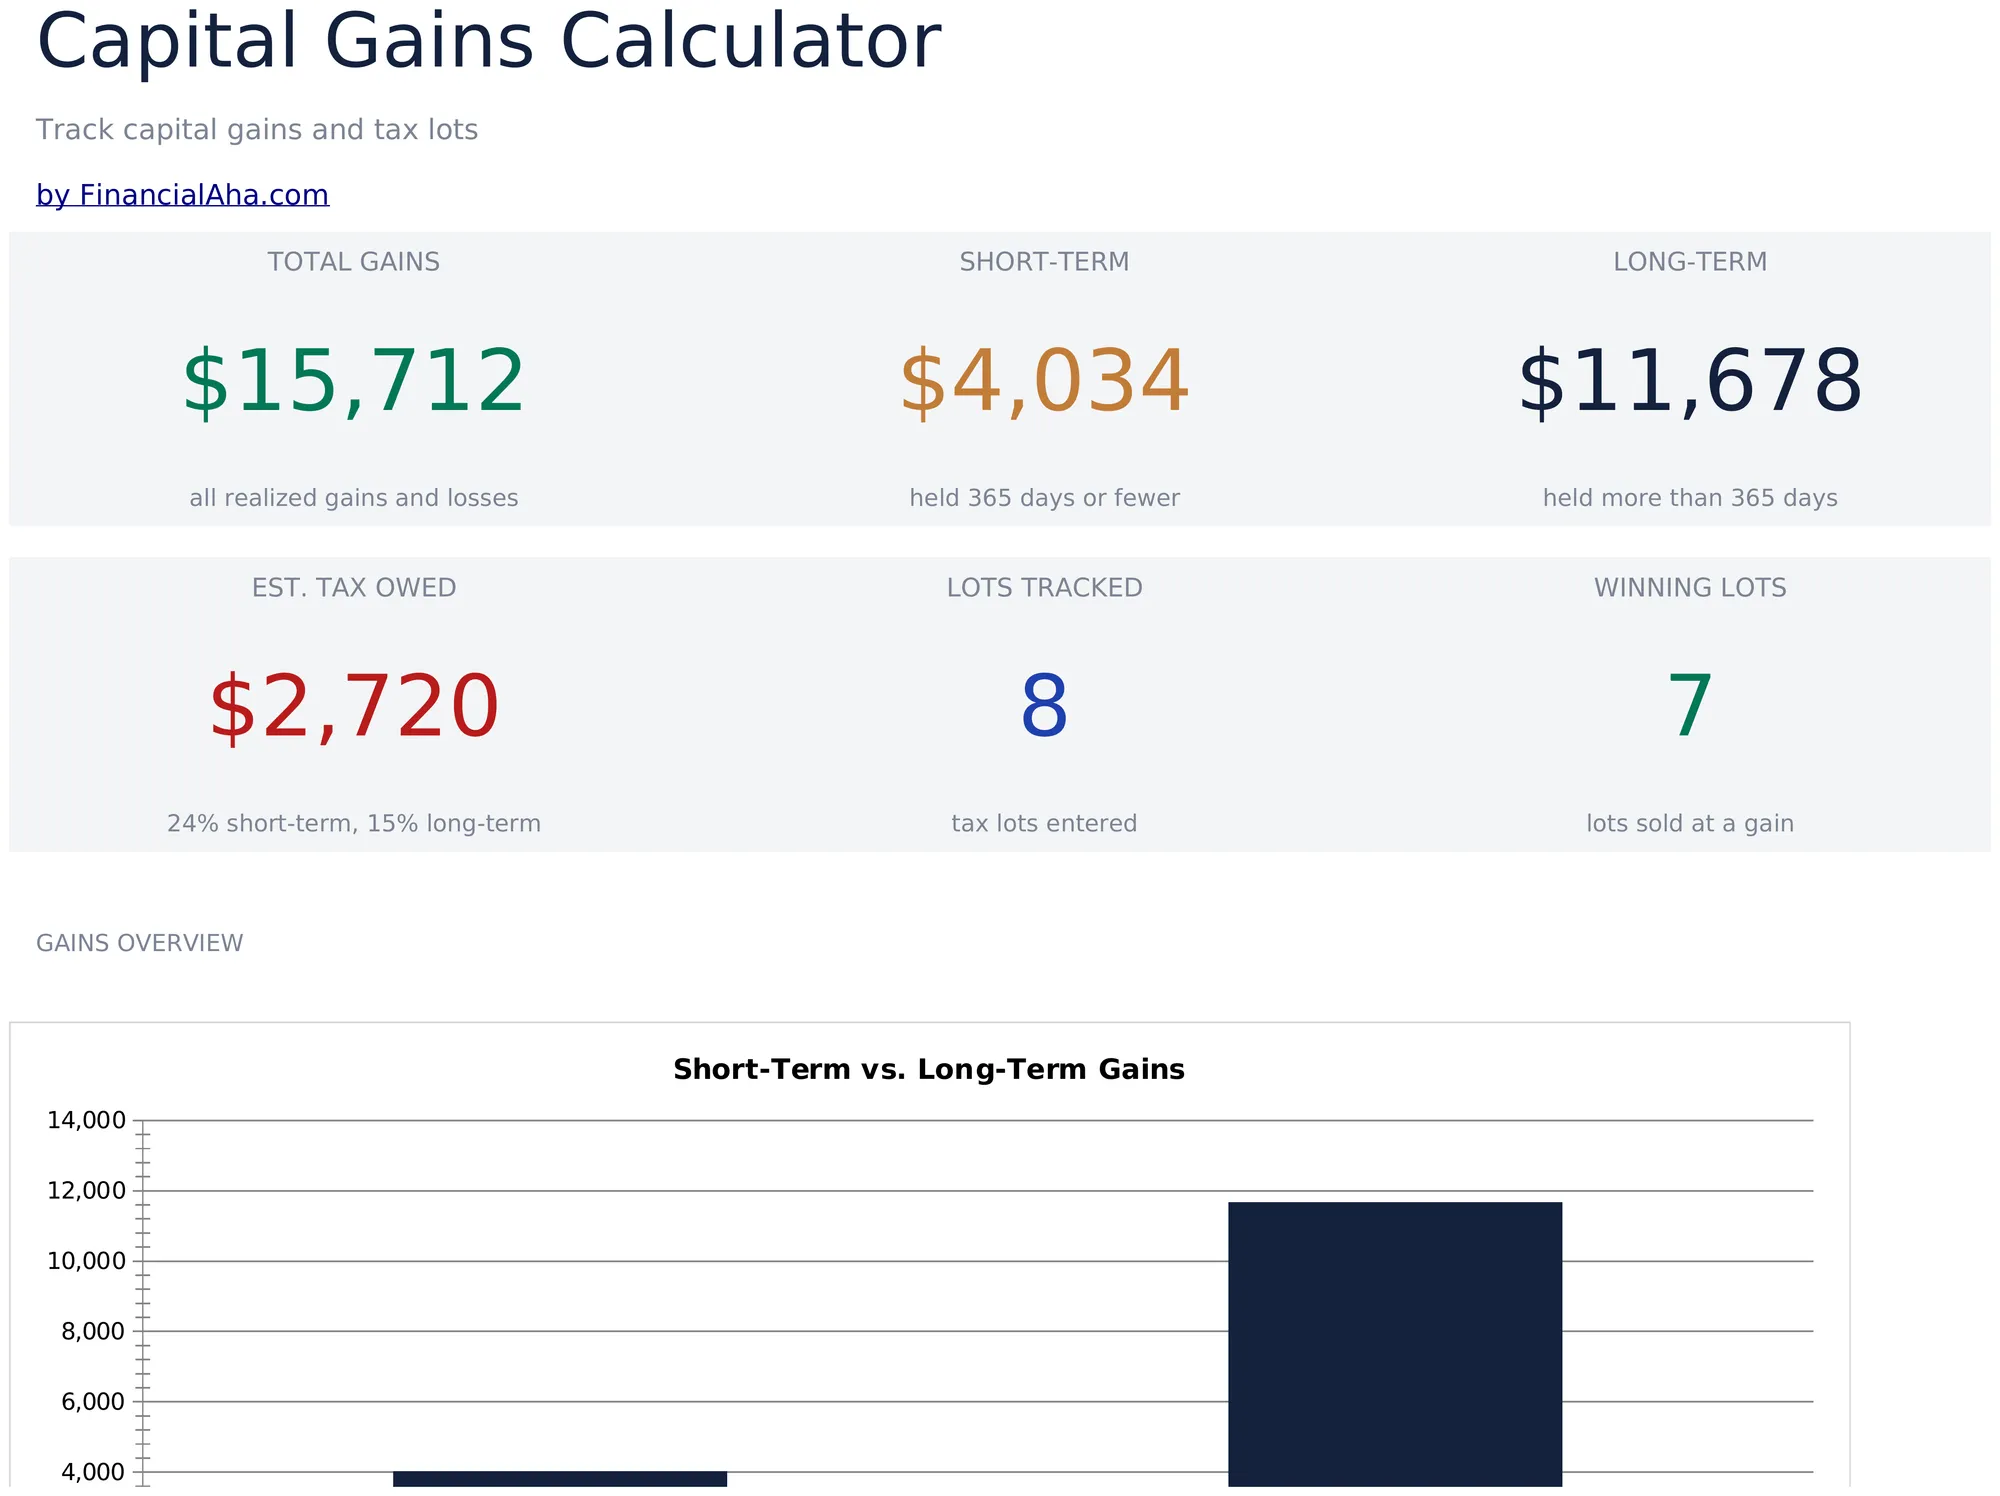
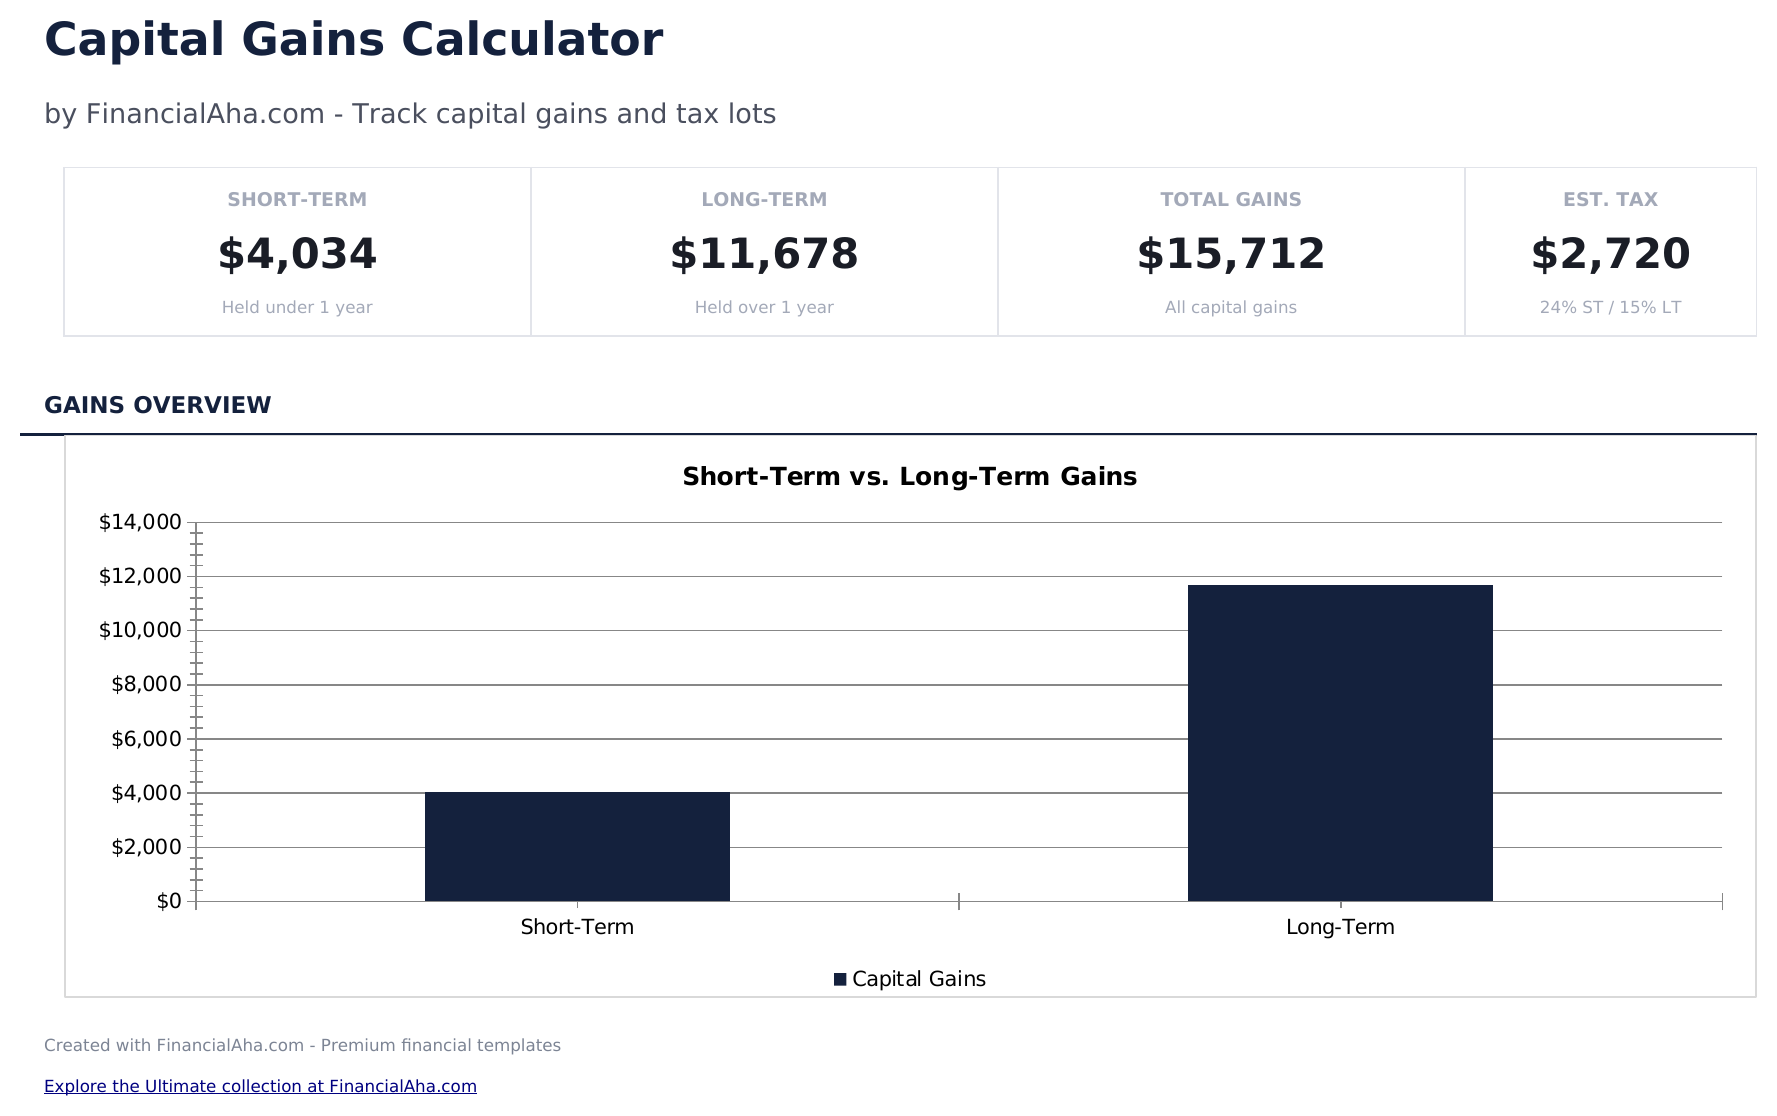
- Painel com resumo de ganhos e perdas mostrando ganhos de curto prazo totais, ganhos de longo prazo e ganho de capital líquido
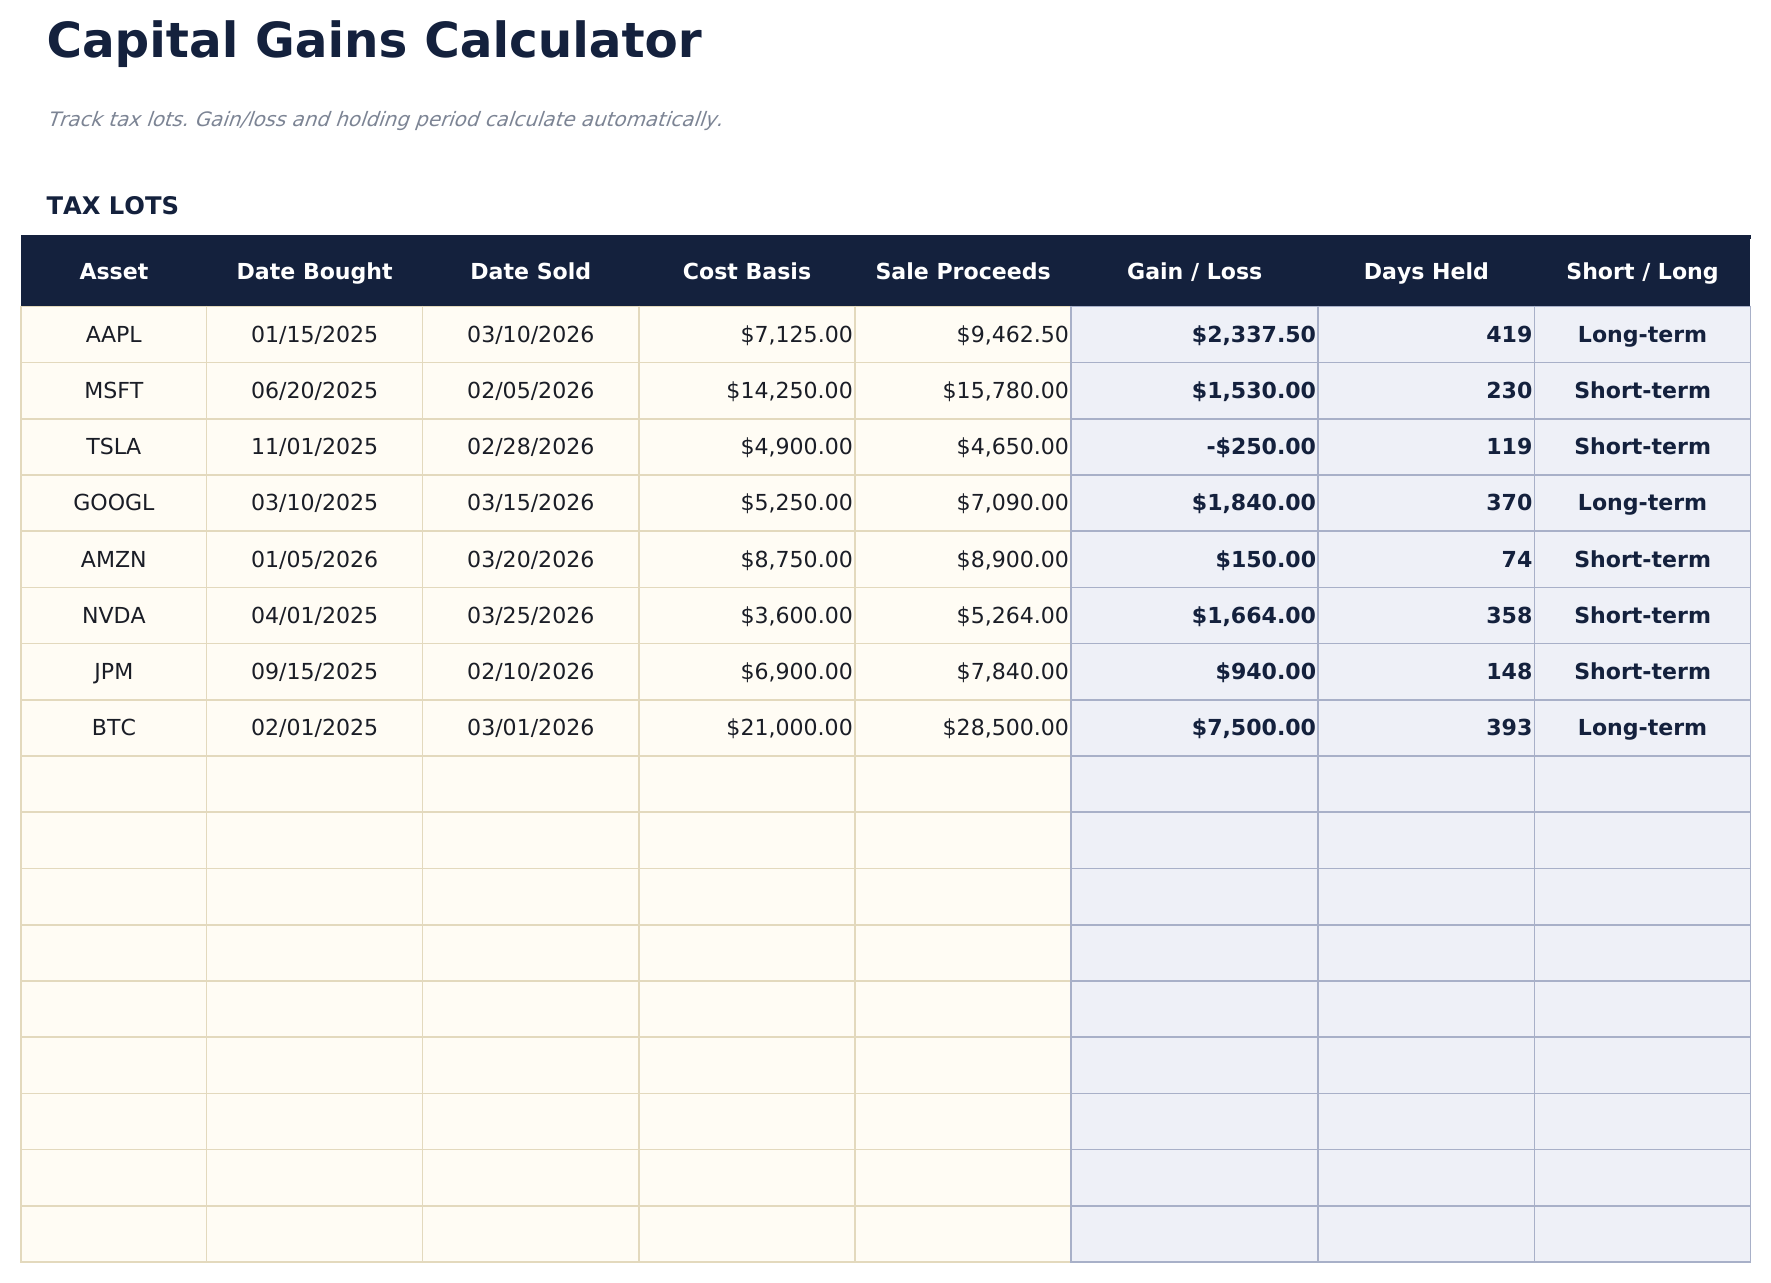
- Rastreamento de lotes de impostos com data de compra, preço de compra, data de venda, preço de venda, ações e ganho ou perda automático
- Classificação de curto prazo vs. longo prazo com base no período de retenção com categorização automática por lote de imposto vendido
- Cálculos automáticos de ganho e perda por lote considerando base de custo, rendimentos e ajustes de comissão ou taxa
- Resumo de ganho de capital líquido com células de entrada codificadas por cor (amarelas) e resultados de lote de imposto calculados automaticamente (azuis)
- Funciona no Microsoft Excel, Google Sheets e LibreOffice Calc sem necessidade de configuração
Need more from this template?
The Essentials version covers everyday tracking. Ultimate goes further with multi-entity support, scenario analysis, and ultimate-grade reporting.
- Painel com resumo de ganhos e perdas mostrando ganhos de curto prazo totais, ganhos de longo prazo e ganho de capital líquido
- Rastreamento de lotes de impostos com data de compra, preço de compra, data de venda, preço de venda, ações e ganho ou perda automático
- Classificação de curto prazo vs. longo prazo com base no período de retenção com categorização automática por lote de imposto vendido
- Cálculos automáticos de ganho e perda por lote considerando base de custo, rendimentos e ajustes de comissão ou taxa
- Acompanhe até 50 realized transações com asset, ações, datas bought e sold, preço de custo, e proceeds
- Painel com 6 KPIs: total gains, short-prazo gains, long-prazo gains, estimado imposto, effective taxa, e transação count
- Automatic short-prazo vs long-prazo classification based on ativo período (over 365 dias = long-prazo)
- Imposto Resumo com editável short-prazo e long-prazo alíquotas de imposto, broken down by ativo período com após-imposto gains calculation
- Análise de sensibilidade grade mostrando estimado imposto at 7 short-prazo taxas crossed com 5 long-prazo taxas (35 cenários)
Pré-visualização
Veja o que tem dentro desta planilha
Como Usar Esta Planilha de Calculadora de Ganhos de Capital
Digite cada venda
Para cada investimento vendido, digite a data de compra, preço de compra, data de venda, preço de venda e número de ações.
Revise o período de retenção
O modelo classifica cada venda como curto prazo (mantida por menos de um ano) ou longo prazo (mantida por um ano ou mais) automaticamente.
Verifique ganho ou perda
Cada lote de impostos mostra o ganho ou perda calculado com base nos rendimentos menos a base de custo, ajustado para qualquer comissão.
Veja o resumo
O painel totaliza ganhos de curto prazo, ganhos de longo prazo e ganho de capital líquido para o ano fiscal.
Customer Reviews
What Our Customers Say
"If I get half as good at handling my finances as you are at customer service, this'll be the best $26 I've spent lately."
"Great tool! Simplifies financial planning without the hassle of complex spreadsheets."
"I recently purchased your super convenient spreadsheet, it really helps me!"
"They're great and super intuitive. Thank you!"
Criadas com Claude AI. Aperfeiçoadas por nós.
Usamos Claude AI para criar cada planilha, após uma pesquisa aprofundada. Depois, nossa equipe entra em ação. Refinamos o layout, testamos exaustivamente cada fórmula, corrigimos casos extremos e polimos o design até que pareça algo que nós mesmos usaríamos. A IA nos leva 80% do caminho. Os últimos 20% são puro julgamento humano.
Perguntas Frequentes
O que é um lote de impostos?
Um lote de impostos é um registro de uma compra específica - a data, o preço e as ações compradas. Quando você vende, a correspondência da venda com um lote de impostos determina o ganho ou a perda.
Por que o período de retenção é importante?
Ganhos de curto prazo (menos de um ano) são tipicamente tributados às alíquotas de renda ordinária. Ganhos de longo prazo (mais de um ano) podem se qualificar para alíquotas de imposto de ganho de capital mais baixas.
Posso incluir custos de comissão?
Sim. Adicione comissões à base de custo ou subtraia dos rendimentos. Isso reduz o ganho tributável ou aumenta a perda dedutível.
Ele trata vendas de lavagem?
O modelo não detecta automaticamente vendas de lavagem. Se uma venda de lavagem se aplica, ajuste manualmente a base de custo das ações de substituição.
Como abrir no Google Sheets?
Envie o arquivo .xlsx para o Google Drive e abra com o Google Sheets. Todas as fórmulas e formatações serão preservadas.
Mais modelos Essentials de Investimentos e Negociações
Destaques:
Procurando planilhas premium?
Nossas planilhas pagas incluem painéis avançados com várias abas, gráficos nativos do Excel e atualizações contínuas.
Leve todos os modelos Ultimate
Todos os 58 modelos Ultimate em uma única compra por $299 - valor de $1,102, você fica com $803.