Diário de Negociações de Ações Modelo Essentials
Registre operações de ações com detalhes de entrada, saída e lucro/prejuízo. Acompanhe o desempenho de negociação ao longo do tempo com cálculos de P&L contínuos.
O Que Está Incluído
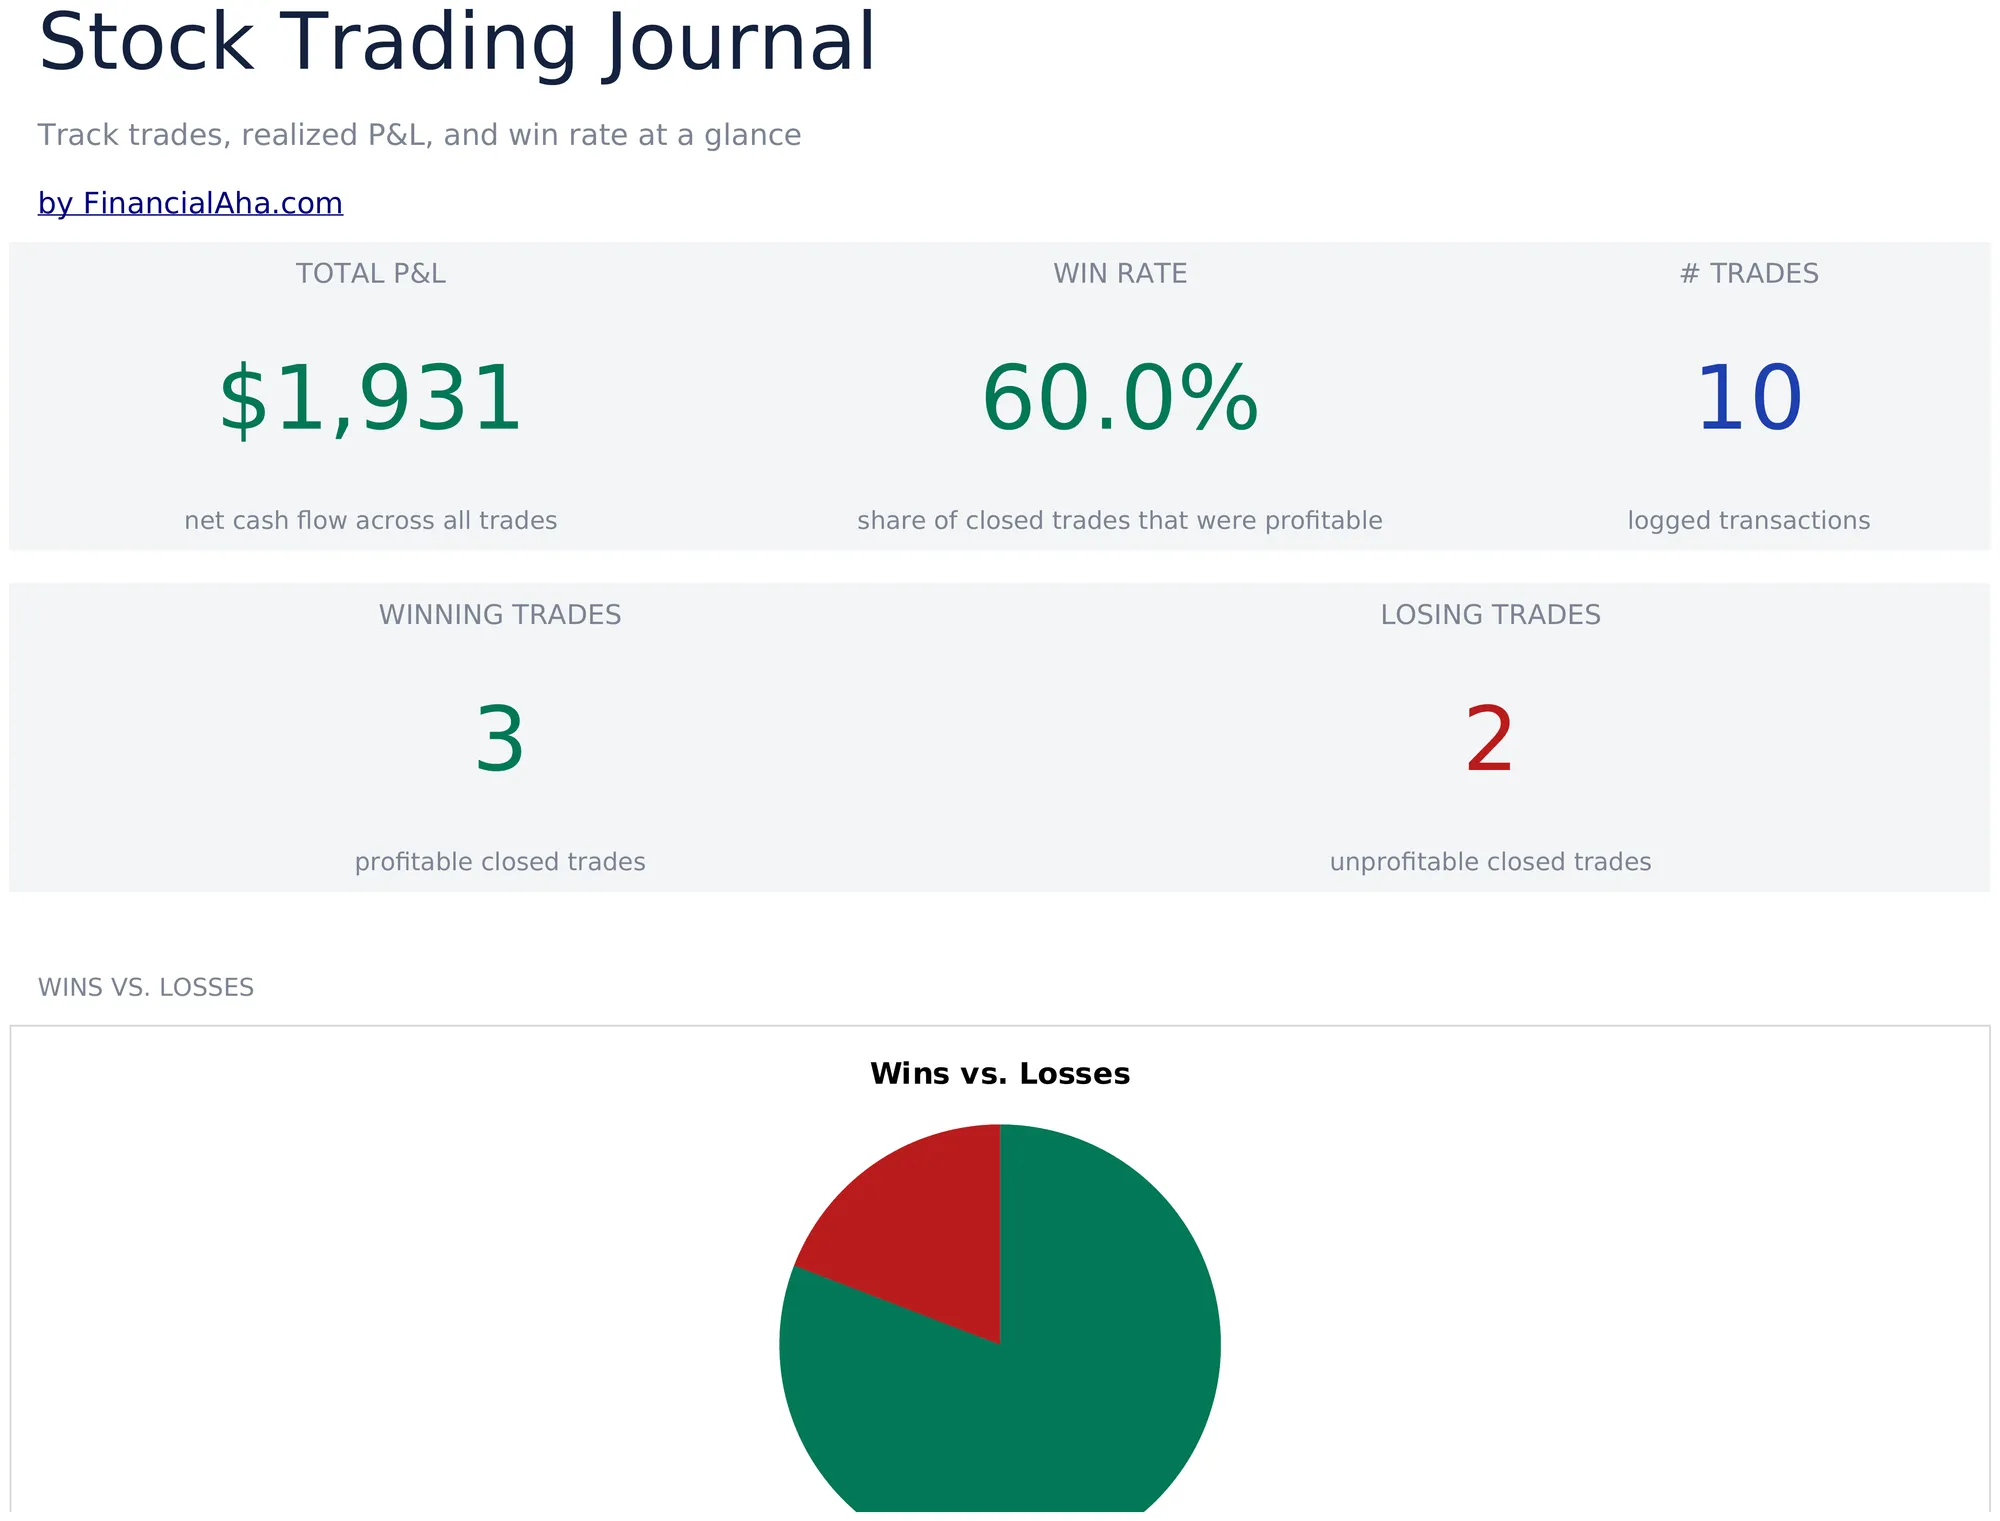
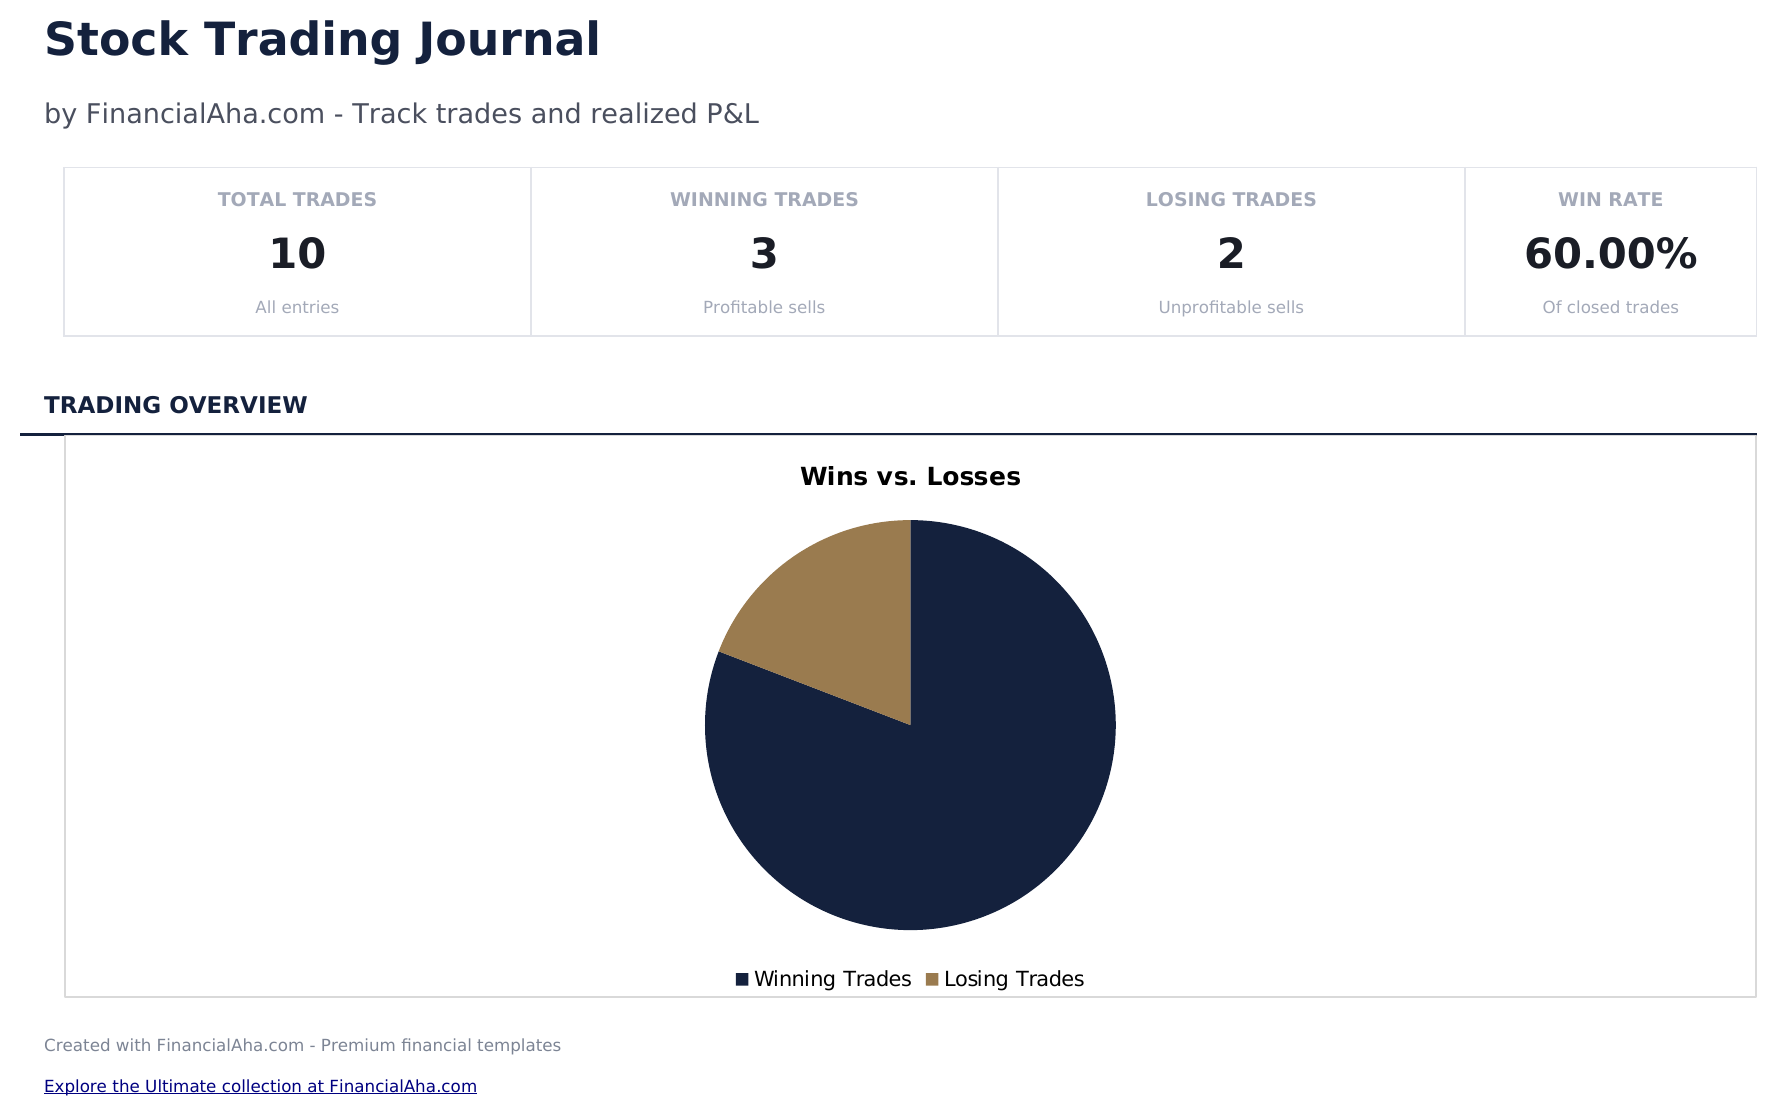
- Painel com métricas de desempenho de negociação mostrando total de operações, taxa de acerto, retorno médio e P&L cumulativo
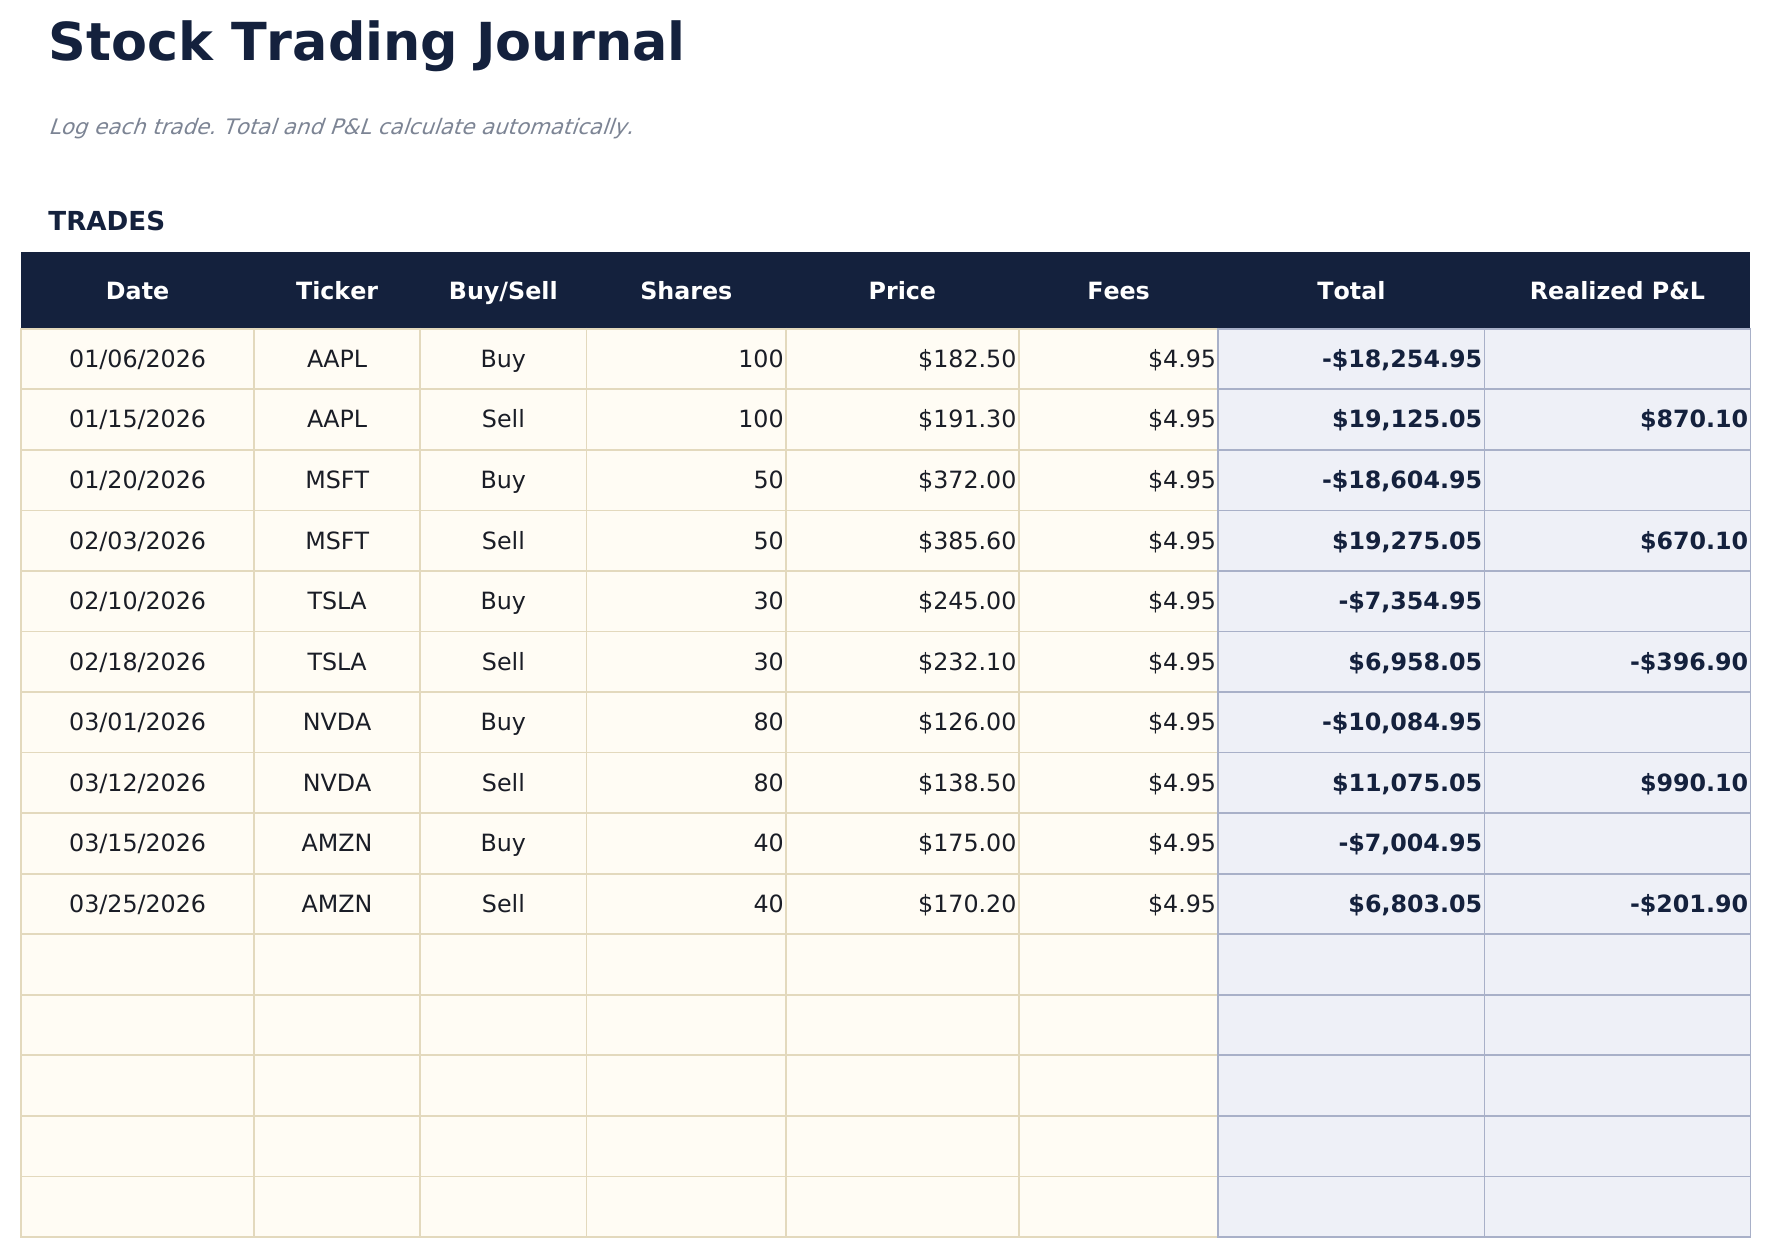
- Registro de negociações com colunas para ticker, data de entrada, preço de entrada, data de saída, preço de saída, quantidade de ações e lucro ou prejuízo
- Lucro e prejuízo por operação calculados automaticamente a partir do preço de entrada, preço de saída, quantidade de ações e custos de comissão
- Cálculos de taxa de acerto e retorno médio atualizados após cada entrada de negociação com estatísticas separadas para posições compradas e vendidas
- P&L cumulativo com células de entrada coloridas (amarelo) e métricas de desempenho calculadas automaticamente (azul)
- Funciona em Microsoft Excel, Google Sheets e LibreOffice Calc sem configuração necessária
Need more from this template?
The Essentials version covers everyday tracking. Ultimate goes further with multi-entity support, scenario analysis, and ultimate-grade reporting.
- Painel com métricas de desempenho de negociação mostrando total de operações, taxa de acerto, retorno médio e P&L cumulativo
- Registro de negociações com colunas para ticker, data de entrada, preço de entrada, data de saída, preço de saída, quantidade de ações e lucro ou prejuízo
- Lucro e prejuízo por operação calculados automaticamente a partir do preço de entrada, preço de saída, quantidade de ações e custos de comissão
- Cálculos de taxa de acerto e retorno médio atualizados após cada entrada de negociação com estatísticas separadas para posições compradas e vendidas
- Registre até 200 operações com ticker, data, direção (Compra/Venda a Descoberto), quantidade, preço de entrada, preço de saída, estratégia e observações
- Painel com 6 cartões de KPI: P&L total, taxa de acerto, melhor operação, ganho médio, perda média e total de operações
- Resumo de Desempenho mostrando total de operações, acertos, erros, taxa de acerto, ganho médio, perda média e maior ganho e perda por ticker
- Planilha de P&L Mensal agregando operações por mês: total de operações, acertos, erros, lucro bruto, perda bruta e P&L líquido por mês
- Análise por Estratégia detalhando o desempenho por estratégia de trading: taxa de acerto, P&L médio, P&L líquido e contagem de operações por estratégia
Pré-visualização
Veja o que tem dentro desta planilha
Como Usar Esta Planilha de Diário de Negociações de Ações
Registre cada operação
Insira o ticker, data de entrada, preço de entrada, data de saída, preço de saída e número de ações para cada operação concluída.
Registre seu motivo
Adicione notas sobre por que você entrou e saiu de cada posição. Isso ajuda a revisar padrões de decisão ao longo do tempo.
Revise os resultados das operações
Lucro ou prejuízo por operação é calculado automaticamente a partir do preço de entrada, preço de saída, quantidade de ações e comissões.
Verifique as métricas de desempenho
O painel mostra total de operações, taxa de acerto, ganho médio, prejuízo médio e P&L cumulativo.
Customer Reviews
What Our Customers Say
"If I get half as good at handling my finances as you are at customer service, this'll be the best $26 I've spent lately."
"Great tool! Simplifies financial planning without the hassle of complex spreadsheets."
"I recently purchased your super convenient spreadsheet, it really helps me!"
"They're great and super intuitive. Thank you!"
Criadas com Claude AI. Aperfeiçoadas por nós.
Usamos Claude AI para criar cada planilha, após uma pesquisa aprofundada. Depois, nossa equipe entra em ação. Refinamos o layout, testamos exaustivamente cada fórmula, corrigimos casos extremos e polimos o design até que pareça algo que nós mesmos usaríamos. A IA nos leva 80% do caminho. Os últimos 20% são puro julgamento humano.
Perguntas Frequentes
Ele calcula taxa de acerto?
Sim. Taxa de acerto é o número de operações lucrativas dividido pelo total de operações. O painel é atualizado após cada nova entrada de negociação.
Posso rastrear comissões?
Sim. Adicione custos de comissão por operação. Eles são subtraídos do lucro ou adicionados ao prejuízo para cada posição.
Ele suporta venda a descoberto?
Sim. Para operações de venda a descoberto, insira o preço de venda a descoberto como entrada e o preço de cobertura como saída. O cálculo de P&L funciona corretamente em ambas as direções.
Posso ver o desempenho por ticker?
Filtre ou ordene por ticker para ver todas as operações de uma única ação. Isso ajuda a identificar quais tickers são mais lucrativos.
Como abrir no Google Sheets?
Envie o arquivo .xlsx para o Google Drive e abra com o Google Sheets. Todas as fórmulas e formatações serão preservadas.
Mais modelos Essentials de Investimentos e Negociações
Destaques:
Procurando planilhas premium?
Nossas planilhas pagas incluem painéis avançados com várias abas, gráficos nativos do Excel e atualizações contínuas.
Leve todos os modelos Ultimate
Todos os 58 modelos Ultimate em uma única compra por $299 - valor de $1,102, você fica com $803.