Diario di Trading Azionario Modello Essentials
Registra le operazioni azionarie con i dettagli di entrata, uscita e profitto/perdita. Monitora le prestazioni di trading nel tempo con calcoli P&L progressivi.
Cosa include
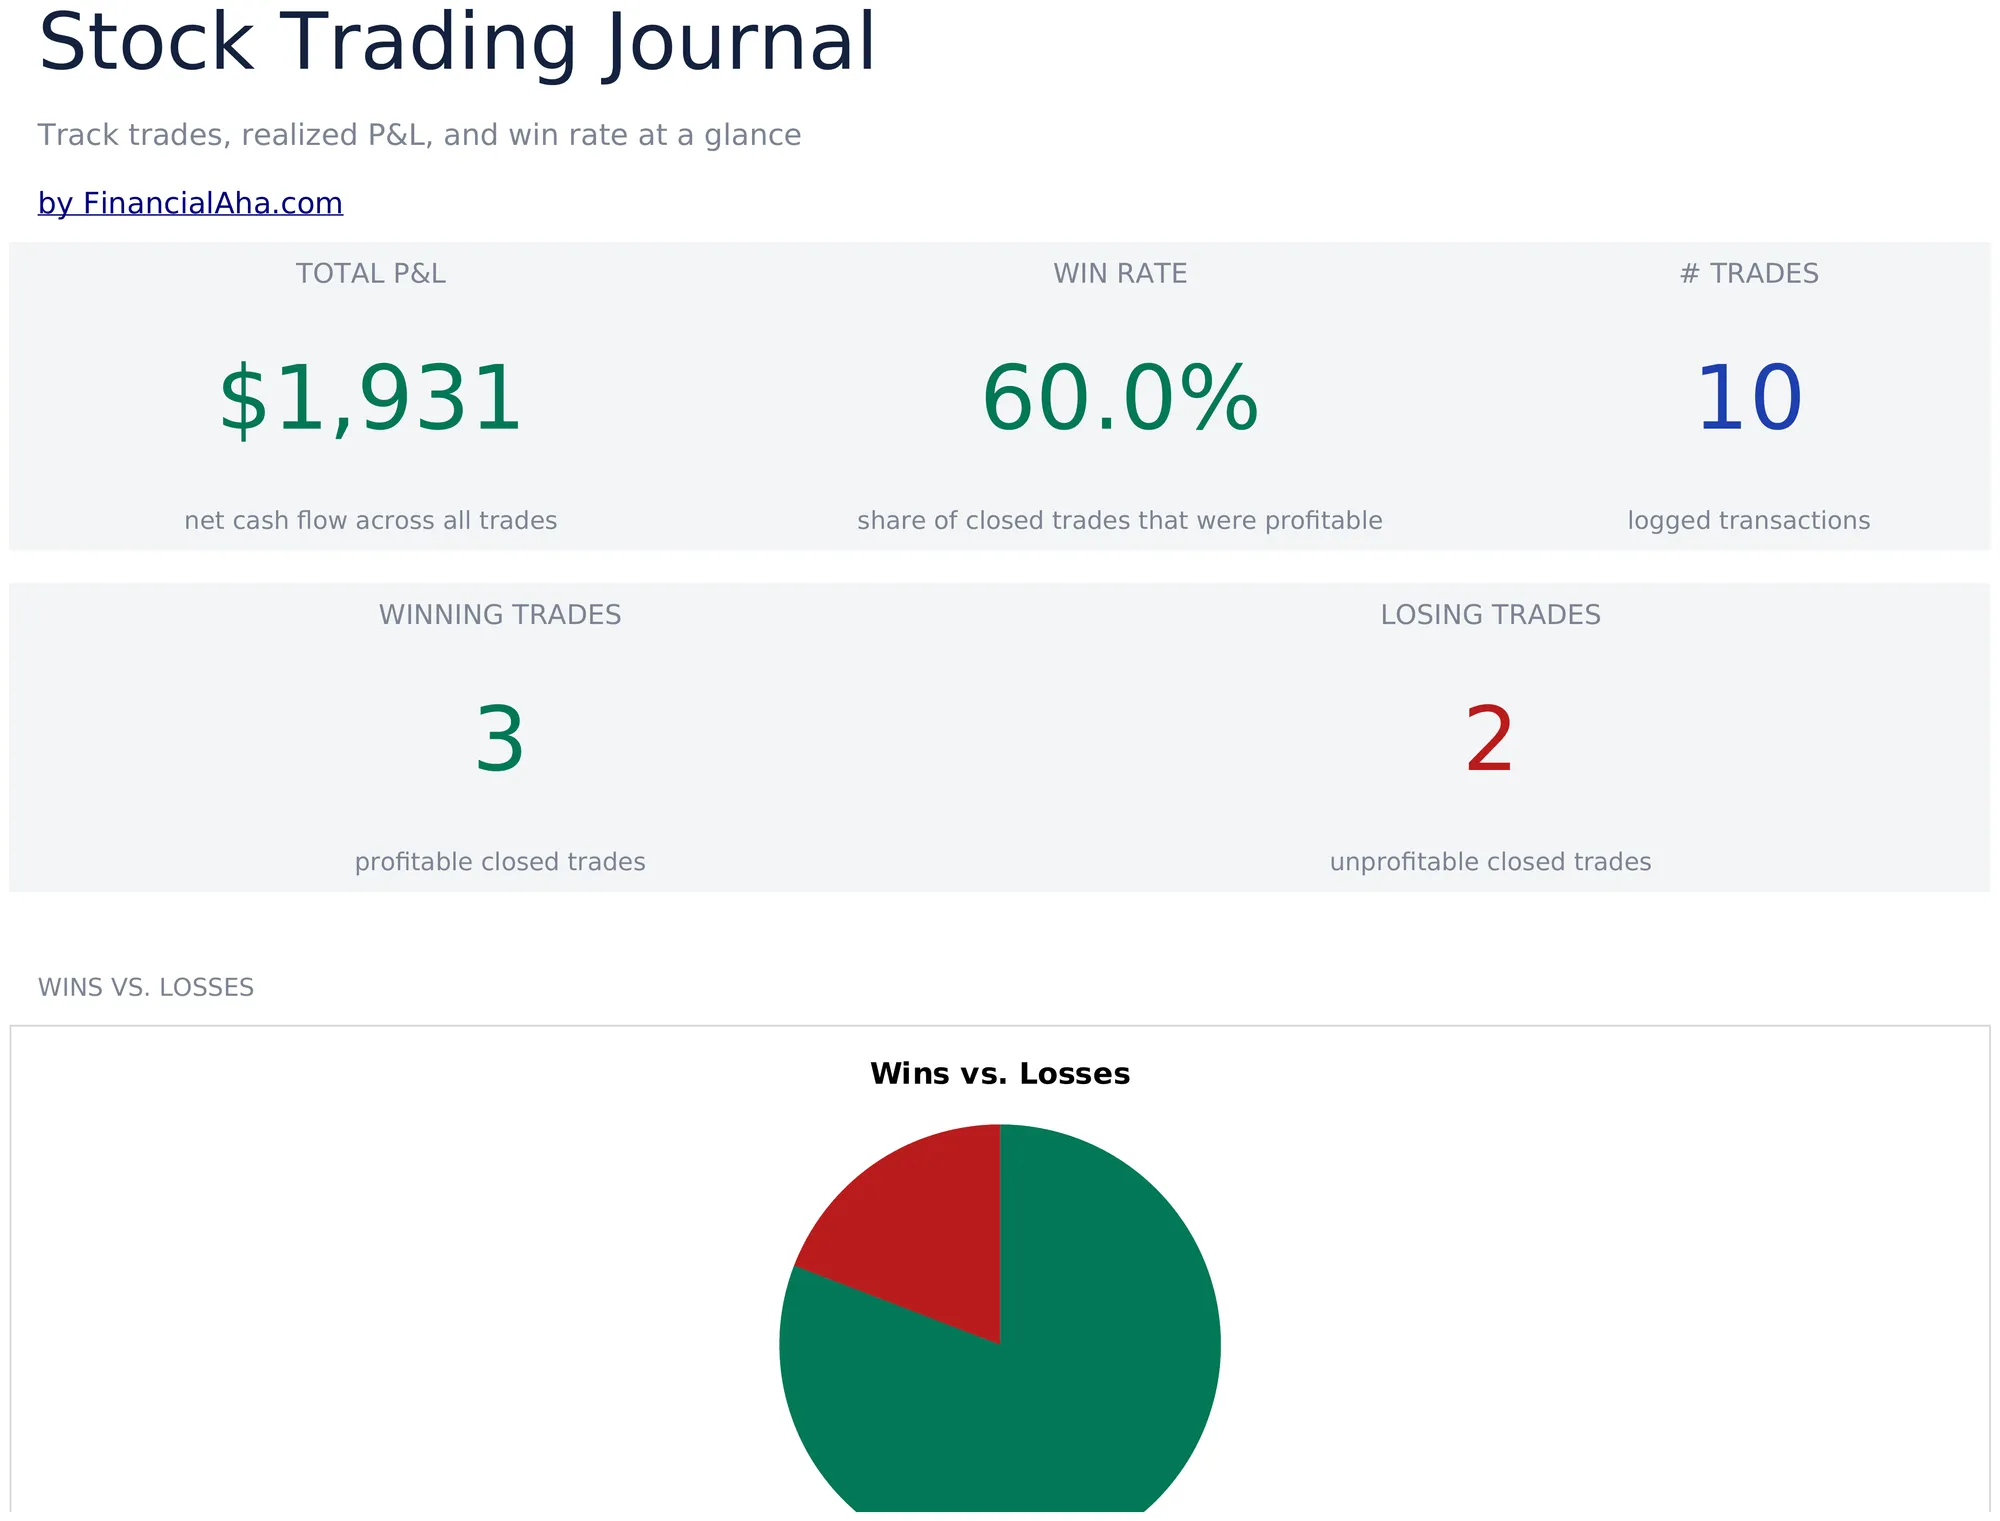
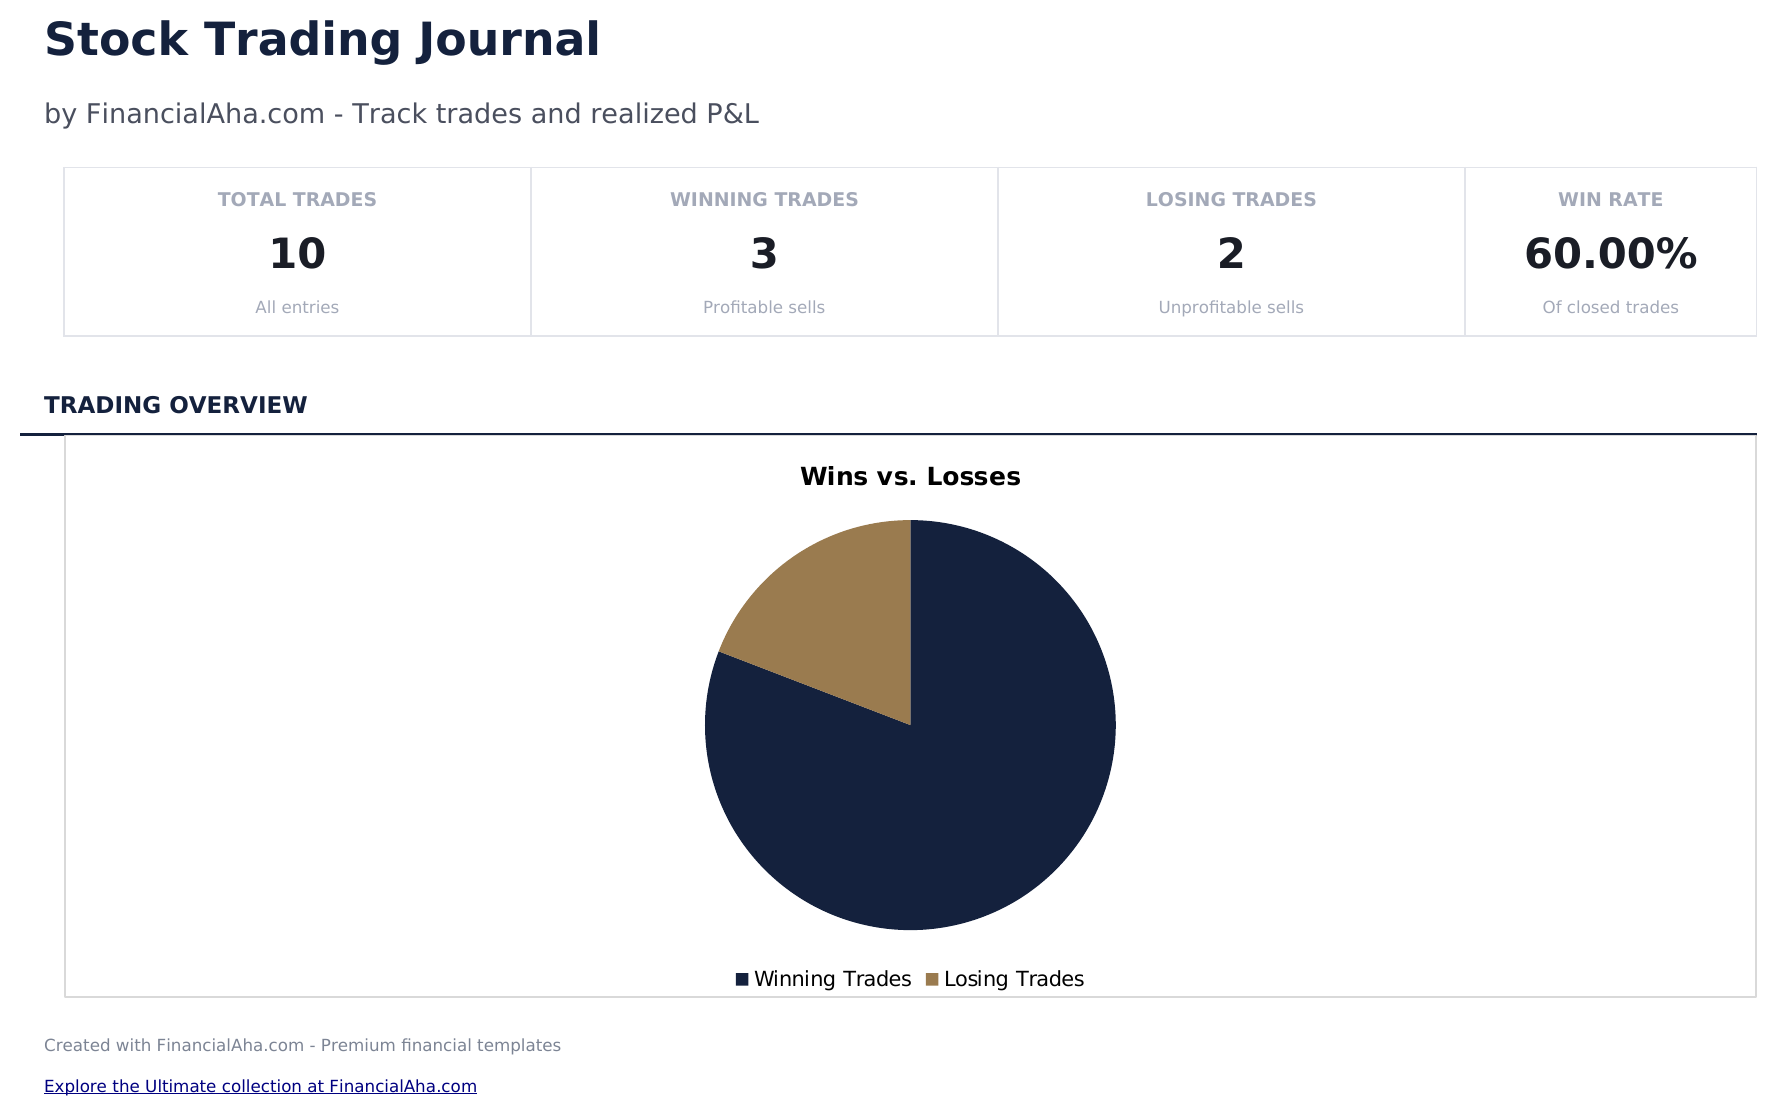
- Dashboard con metriche di prestazione del trading che mostra il totale delle operazioni, il tasso di successo, il rendimento medio e il P&L cumulativo
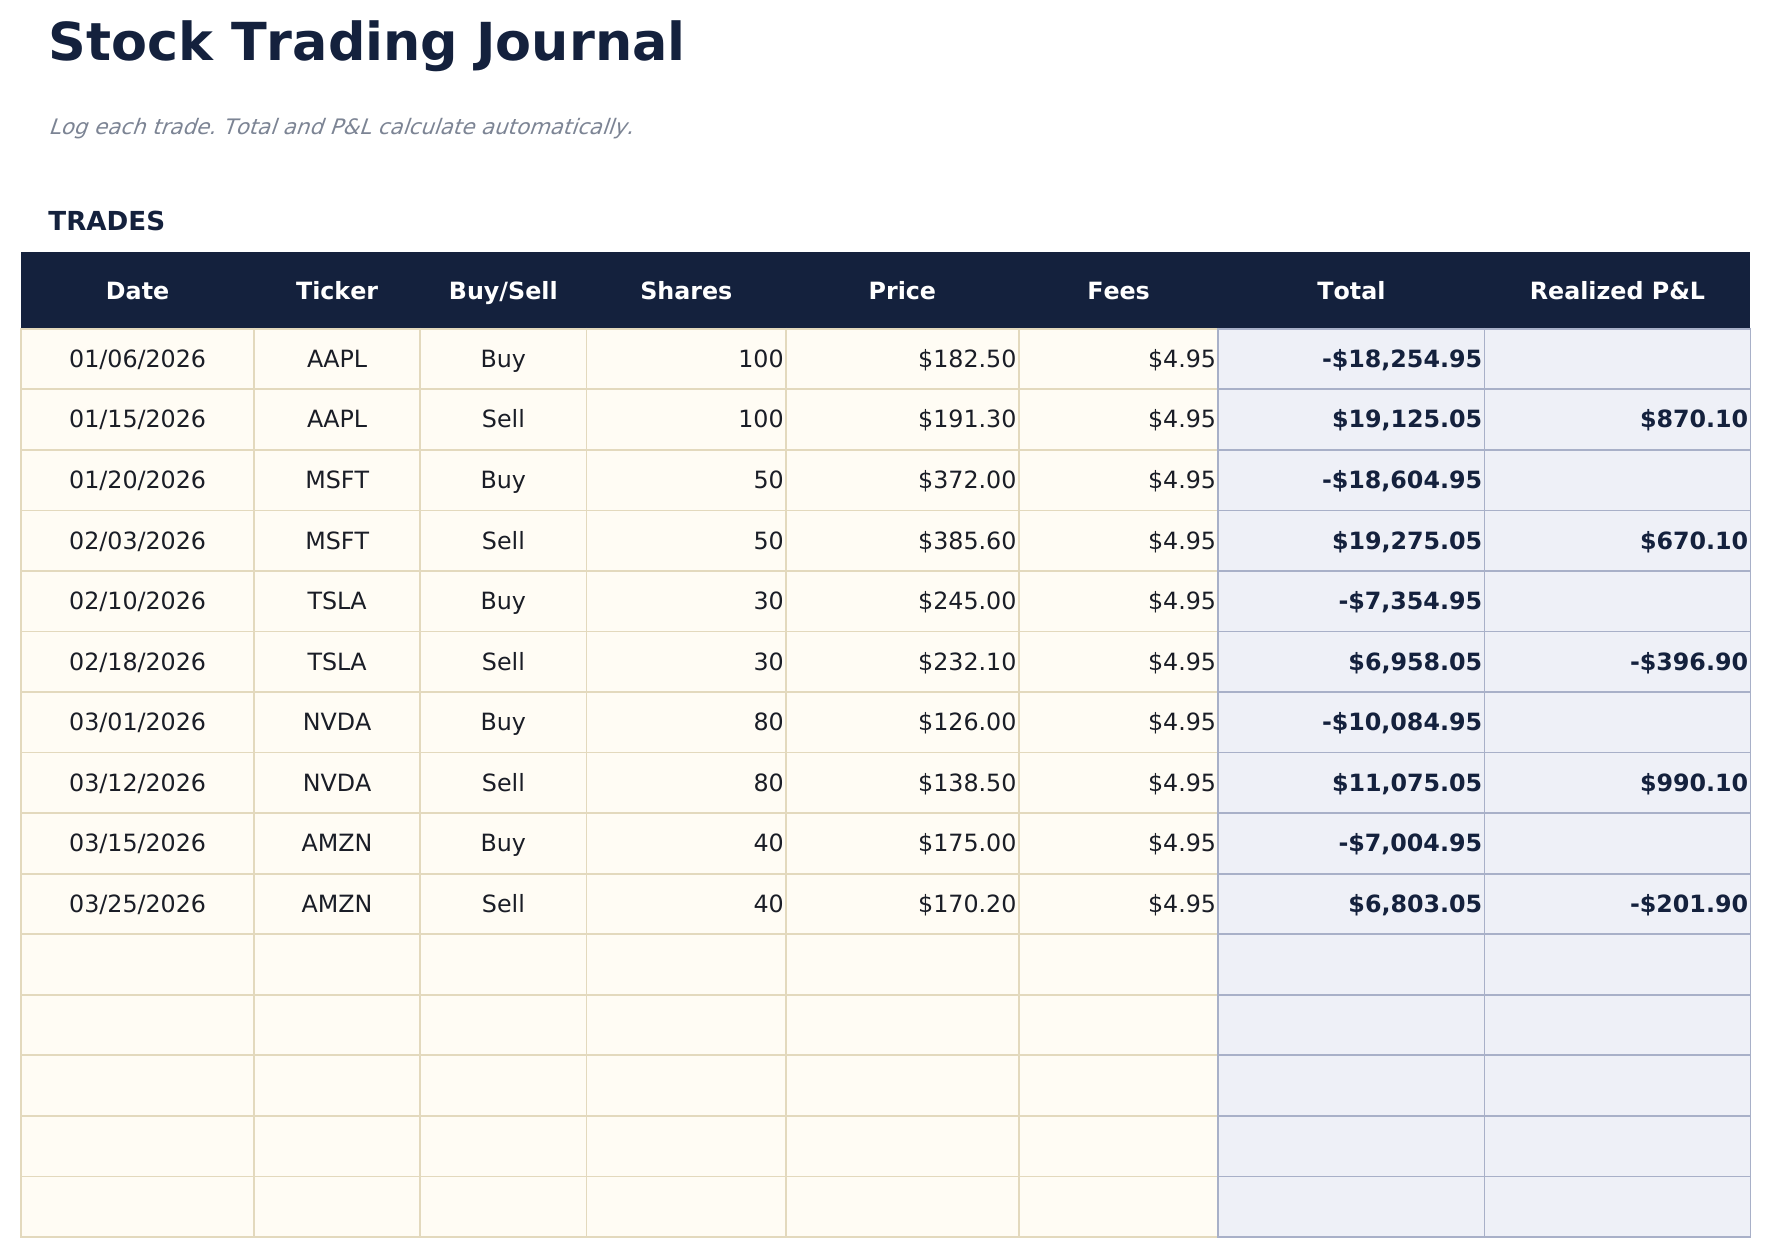
- Registro delle operazioni con colonne per ticker, data di entrata, prezzo di entrata, data di uscita, prezzo di uscita, azioni e profitto o perdita
- Profitto e perdita per operazione calcolati automaticamente dal prezzo di entrata, prezzo di uscita, azioni e costi di commissione
- Calcoli del tasso di successo e del rendimento medio aggiornati dopo ogni registrazione con statistiche separate per posizioni lunghe e corte
- P&L cumulativo progressivo con celle di inserimento con codice colore (giallo) e metriche di prestazione calcolate automaticamente (blu)
- Funziona con Microsoft Excel, Google Sheets e LibreOffice Calc senza alcuna configurazione richiesta
Need more from this template?
The Essentials version covers everyday tracking. Ultimate goes further with multi-entity support, scenario analysis, and ultimate-grade reporting.
- Dashboard con metriche di prestazione del trading che mostra il totale delle operazioni, il tasso di successo, il rendimento medio e il P&L cumulativo
- Registro delle operazioni con colonne per ticker, data di entrata, prezzo di entrata, data di uscita, prezzo di uscita, azioni e profitto o perdita
- Profitto e perdita per operazione calcolati automaticamente dal prezzo di entrata, prezzo di uscita, azioni e costi di commissione
- Calcoli del tasso di successo e del rendimento medio aggiornati dopo ogni registrazione con statistiche separate per posizioni lunghe e corte
- Registra fino a 200 operazioni con ticker, data, direzione (Long/Short), quantita, prezzo di ingresso, prezzo di uscita, strategia e note
- Dashboard con 6 schede KPI: P&L totale, tasso di vincita, miglior operazione, vincita media, perdita media e totale operazioni
- Riepilogo Performance che mostra operazioni totali, vincite, perdite, tasso di vincita, guadagno medio, perdita media e migliore e peggiore operazione per ticker
- Foglio P&L Mensile che aggrega le operazioni per mese: operazioni totali, vincite, perdite, profitto lordo, perdita lorda e P&L netto per mese
- Analisi Strategie che scompone le performance per strategia di trading: tasso di vincita, P&L medio, P&L netto e conteggio operazioni per strategia
Anteprima
Scopri cosa contiene questo modello
Come usare questo modello Diario di Trading Azionario
Registra ogni operazione
Inserisci il ticker, la data di entrata, il prezzo di entrata, la data di uscita, il prezzo di uscita e il numero di azioni per ogni operazione completata.
Registra la tua motivazione
Aggiungi note sul motivo per cui sei entrato e uscito da ogni posizione. Questo aiuta a rivedere i modelli decisionali nel tempo.
Esamina i risultati delle operazioni
Il profitto o la perdita per operazione viene calcolato automaticamente dal prezzo di entrata, prezzo di uscita, azioni e commissioni.
Controlla le metriche di prestazione
Il dashboard mostra il totale delle operazioni, il tasso di successo, il guadagno medio, la perdita media e il P&L cumulativo.
Customer Reviews
What Our Customers Say
"If I get half as good at handling my finances as you are at customer service, this'll be the best $26 I've spent lately."
"Great tool! Simplifies financial planning without the hassle of complex spreadsheets."
"I recently purchased your super convenient spreadsheet, it really helps me!"
"They're great and super intuitive. Thank you!"
Creati da Claude AI. Perfezionati da noi.
Utilizziamo Claude AI per creare ogni modello, dopo una ricerca approfondita. Poi interviene il nostro team. Miglioriamo il layout, testiamo ogni formula, correggiamo i casi limite e rifiniamo il design fino a ottenere qualcosa che useremmo noi stessi. L'AI ci porta all'80%. L'ultimo 20% è tutto giudizio umano.
Domande frequenti
Calcola il tasso di successo?
Sì. Il tasso di successo è il numero di operazioni redditizie diviso per il totale delle operazioni. Il dashboard si aggiorna dopo ogni nuova registrazione.
Posso tracciare le commissioni?
Sì. Aggiungi i costi di commissione per ogni operazione. Vengono sottratti dal profitto o aggiunti alla perdita per ogni posizione.
Supporta le vendite allo scoperto?
Sì. Per le vendite allo scoperto, inserisci il prezzo di vendita allo scoperto come entrata e il prezzo di copertura come uscita. Il calcolo del P&L funziona correttamente per entrambe le direzioni.
Posso vedere le prestazioni per ticker?
Filtra o ordina per ticker per visualizzare tutte le operazioni su un singolo titolo. Questo aiuta a identificare quali ticker sono più redditizi.
Come posso aprirlo in Google Sheets?
Carica il file .xlsx su Google Drive, poi aprilo con Google Sheets. Tutte le formule e la formattazione saranno conservate.
Altri modelli Essentials Investimenti e Trading
Punti Chiave:
Cerchi modelli di fogli di calcolo premium?
I nostri modelli a pagamento includono dashboard multi-foglio avanzate, grafici nativi Excel e aggiornamenti continui.
Privato e sicuro
I tuoi dati finanziari restano sul tuo dispositivo. Non li vediamo mai.
Scopri di piu →Ottieni invece ogni modello Ultimate
Tutti i 58 modelli Ultimate in un unico acquisto per $299 - valore di $1,102, risparmi $803.