دفتر تداول الأسهم قالب Essentials
سجّل صفقات الأسهم بتفاصيل الدخول والخروج والربح/الخسارة. تتبّع أداء التداول بمرور الوقت بحسابات أرباح وخسائر جارية.
ماذا يتضمن
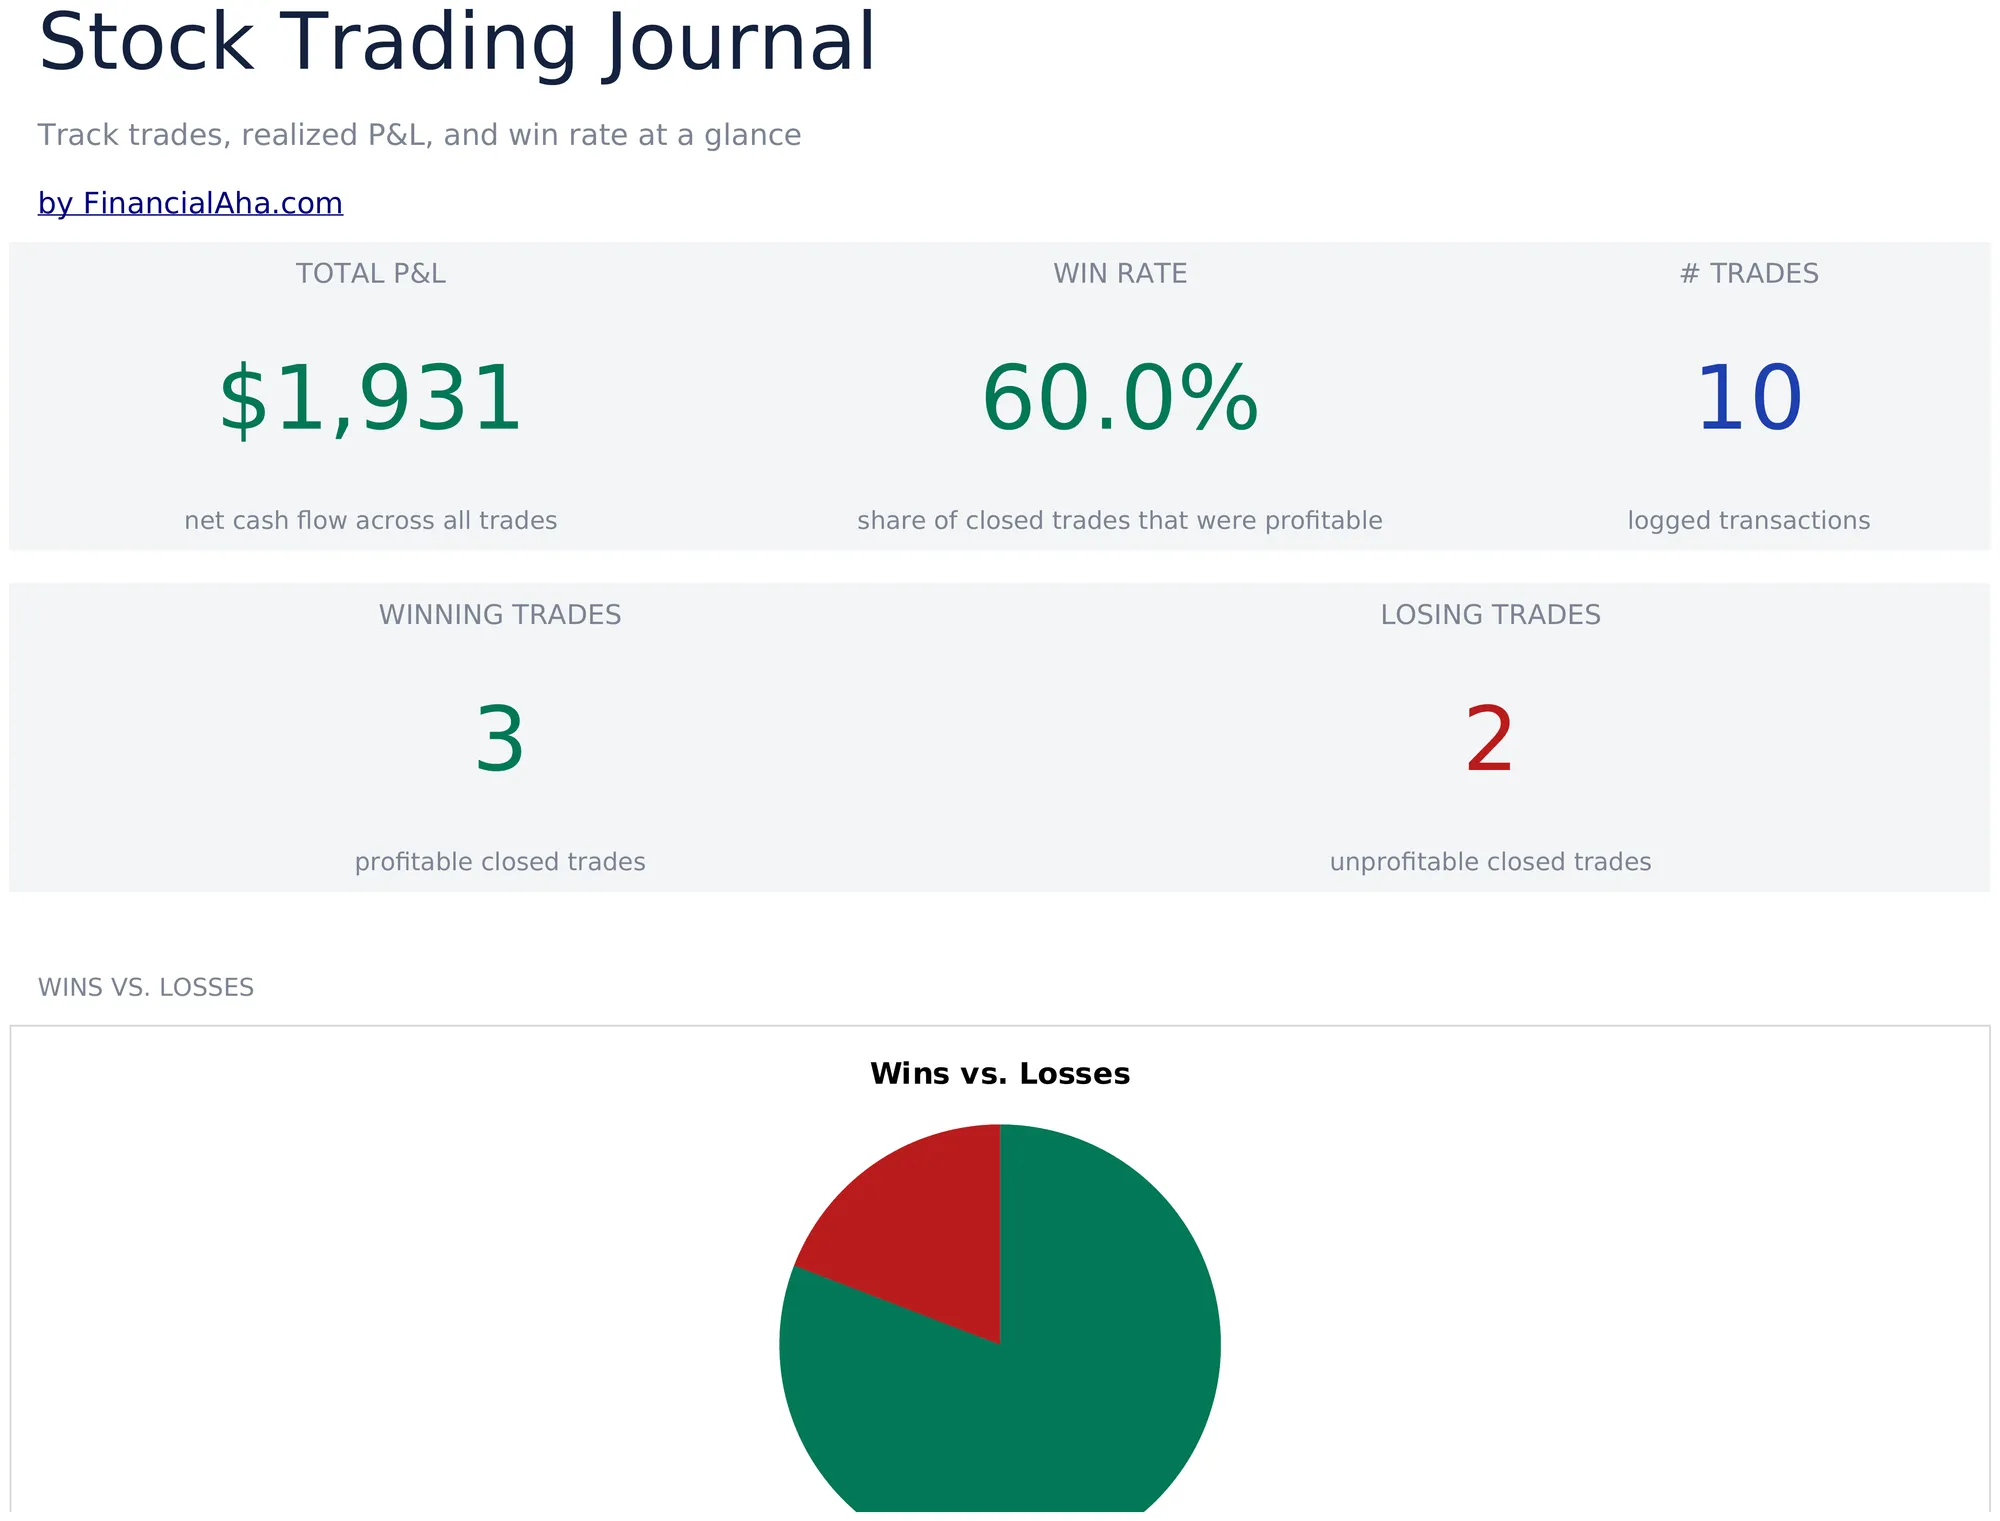
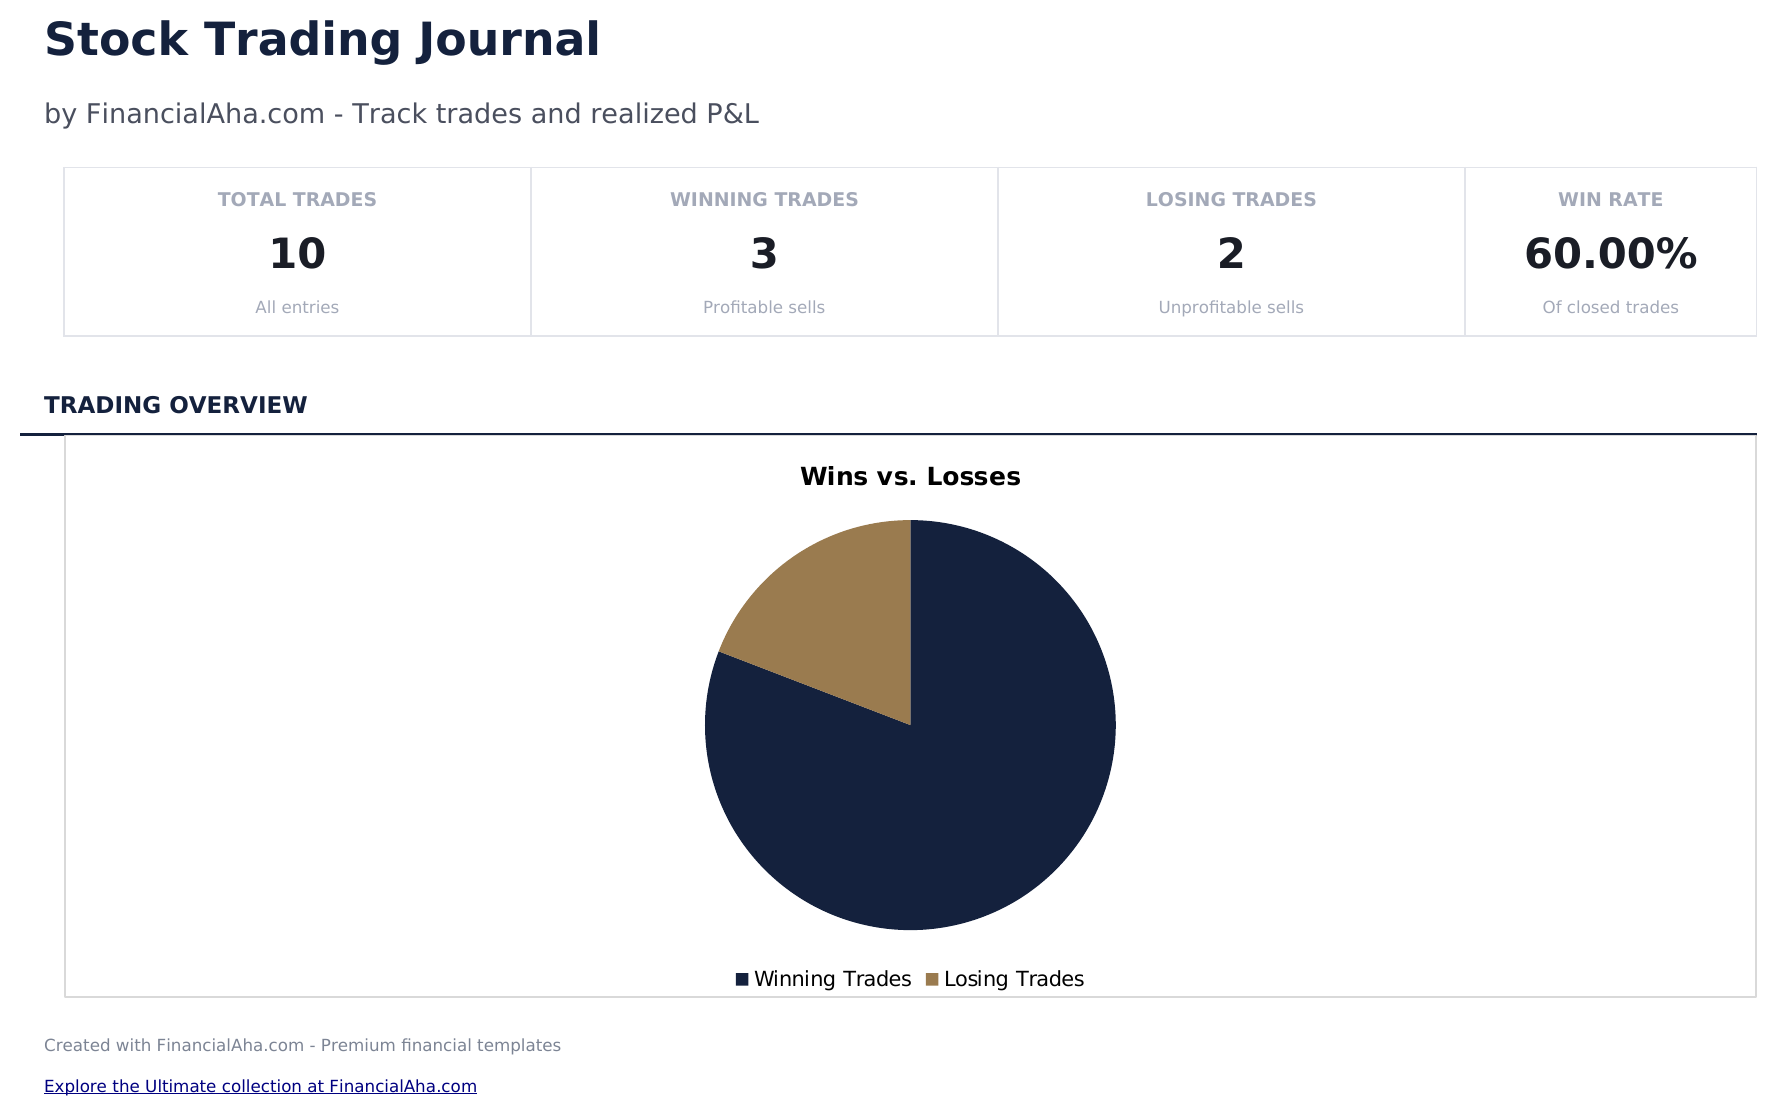
- لوحة متابعة بمقاييس أداء التداول تعرض إجمالي الصفقات ونسبة الربح ومتوسط العائد والأرباح والخسائر التراكمية
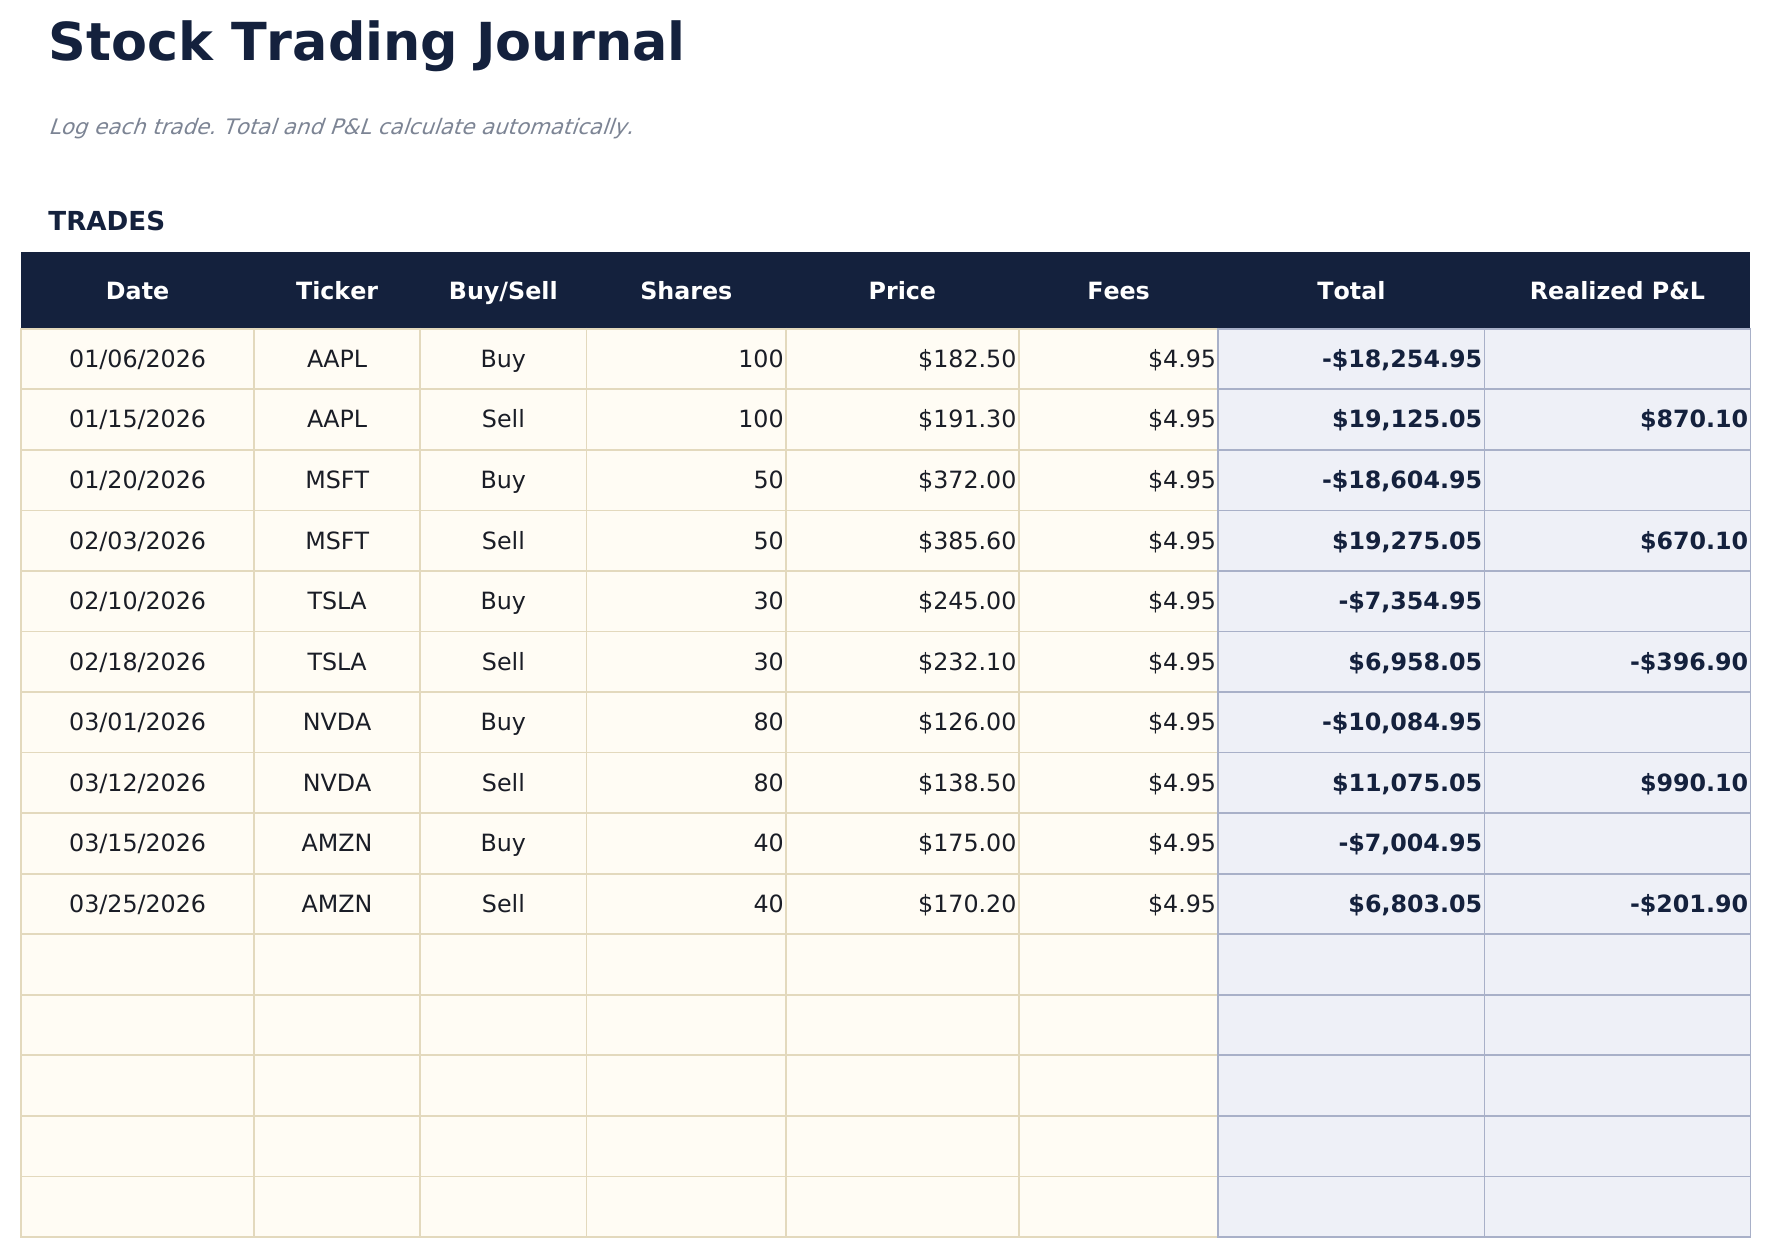
- سجل الصفقات بأعمدة رمز التداول وتاريخ الدخول وسعر الدخول وتاريخ الخروج وسعر الخروج والأسهم والربح أو الخسارة
- حساب الربح والخسارة لكل صفقة تلقائياً من سعر الدخول وسعر الخروج والأسهم وأي تكاليف عمولة
- حسابات نسبة الربح ومتوسط العائد تتحدّث بعد كل صفقة مع إحصاءات منفصلة للصفقات الطويلة والقصيرة
- أرباح وخسائر تراكمية جارية مع خلايا إدخال ملوّنة (صفراء) ومقاييس أداء محسوبة تلقائياً (زرقاء)
- يعمل في Microsoft Excel وGoogle Sheets وLibreOffice Calc دون الحاجة لأي إعداد
Need more from this template?
The Essentials version covers everyday tracking. Ultimate goes further with multi-entity support, scenario analysis, and ultimate-grade reporting.
- لوحة متابعة بمقاييس أداء التداول تعرض إجمالي الصفقات ونسبة الربح ومتوسط العائد والأرباح والخسائر التراكمية
- سجل الصفقات بأعمدة رمز التداول وتاريخ الدخول وسعر الدخول وتاريخ الخروج وسعر الخروج والأسهم والربح أو الخسارة
- حساب الربح والخسارة لكل صفقة تلقائياً من سعر الدخول وسعر الخروج والأسهم وأي تكاليف عمولة
- حسابات نسبة الربح ومتوسط العائد تتحدّث بعد كل صفقة مع إحصاءات منفصلة للصفقات الطويلة والقصيرة
- سجل حتى 200 صفقة مع الرمز والتاريخ والاتجاه (شراء/بيع على المكشوف) والكمية وسعر الدخول وسعر الخروج والاستراتيجية والملاحظات
- لوحة معلومات مع 6 بطاقات KPI: إجمالي الأرباح/الخسائر ومعدل الفوز وأفضل صفقة ومتوسط الربح ومتوسط الخسارة وعدد الصفقات
- ملخص الأداء يعرض الصفقات الكلية والرابحة والخاسرة ومعدل الفوز ومتوسط الربح والخسارة وأكبر ربح وخسارة حسب الرمز
- ورقة الأرباح والخسائر الشهرية تجمع الصفقات حسب الشهر مع عدد الصفقات والرابحة والخاسرة والربح الإجمالي والخسارة الإجمالية وصافي الأرباح/الخسائر
- تحليل الاستراتيجيات يحلل الأداء حسب استراتيجية التداول: معدل الفوز ومتوسط الأرباح/الخسائر وصافيها وعدد الصفقات لكل استراتيجية
معاينة
اطلع على محتويات هذا القالب
كيفية استخدام قالب دفتر تداول الأسهم هذا
سجّل كل صفقة
أدخل رمز التداول وتاريخ الدخول وسعر الدخول وتاريخ الخروج وسعر الخروج وعدد الأسهم لكل صفقة مكتملة.
سجّل مبرراتك
أضف ملاحظات عن سبب دخولك وخروجك من كل مركز. يساعد هذا في مراجعة أنماط القرارات بمرور الوقت.
راجع نتائج الصفقات
يُحسب الربح أو الخسارة لكل صفقة تلقائياً من سعر الدخول وسعر الخروج والأسهم والعمولات.
تحقق من مقاييس الأداء
تعرض لوحة المتابعة إجمالي الصفقات ونسبة الربح ومتوسط الربح ومتوسط الخسارة والأرباح والخسائر التراكمية.
Customer Reviews
What Our Customers Say
"If I get half as good at handling my finances as you are at customer service, this'll be the best $26 I've spent lately."
"Great tool! Simplifies financial planning without the hassle of complex spreadsheets."
"I recently purchased your super convenient spreadsheet, it really helps me!"
"They're great and super intuitive. Thank you!"
صُممت بواسطة Claude AI. أتقنّاها نحن.
نستخدم Claude AI لصياغة كل قالب بعد بحث معمّق. ثم يتدخل فريقنا. نحسّن التصميم، ونختبر كل صيغة، ونعالج الحالات الاستثنائية، وننقّح التصميم حتى يصبح شيئاً نستخدمه نحن فعلاً. الذكاء الاصطناعي يوصلنا إلى 80%. الـ 20% المتبقية هي حكم بشري بالكامل.
الأسئلة الشائعة
هل يحسب نسبة الربح؟
نعم. نسبة الربح هي عدد الصفقات المربحة مقسوماً على إجمالي الصفقات. تتحدّث لوحة المتابعة بعد كل صفقة جديدة.
هل يمكنني تتبّع العمولات؟
نعم. أضف تكاليف العمولة لكل صفقة. تُطرح من الربح أو تُضاف إلى الخسارة لكل مركز.
هل يدعم البيع على المكشوف؟
نعم. للصفقات القصيرة، أدخل سعر البيع على المكشوف كدخول وسعر التغطية كخروج. يعمل حساب الأرباح والخسائر بشكل صحيح لكلا الاتجاهين.
هل يمكنني رؤية الأداء حسب رمز التداول؟
فلتر أو صنّف حسب رمز التداول لرؤية جميع الصفقات في سهم واحد. يساعد هذا في تحديد الرموز الأكثر ربحية.
كيف أفتح هذا في Google Sheets؟
ارفع ملف .xlsx إلى Google Drive، ثم افتحه باستخدام Google Sheets. جميع الصيغ والتنسيقات ستبقى محفوظة.
المزيد من قوالب Essentials في الاستثمار والتداول
أبرز النقاط:
تبحث عن قوالب جداول بيانات احترافية؟
القوالب المدفوعة تشمل لوحات معلومات متعددة الأوراق متقدمة، ورسوم بيانية أصلية في Excel، وتحديثات مستمرة.
احصل على كل قالب Ultimate بدلاً من ذلك
جميع الـ 58 قالب Ultimate في عملية شراء واحدة مقابل $299 - بقيمة $1,102، توفر $803.