股票交易日志 Essentials 模板
记录股票交易的买入、卖出和盈亏详情。通过累计盈亏计算跟踪交易表现。
包含内容
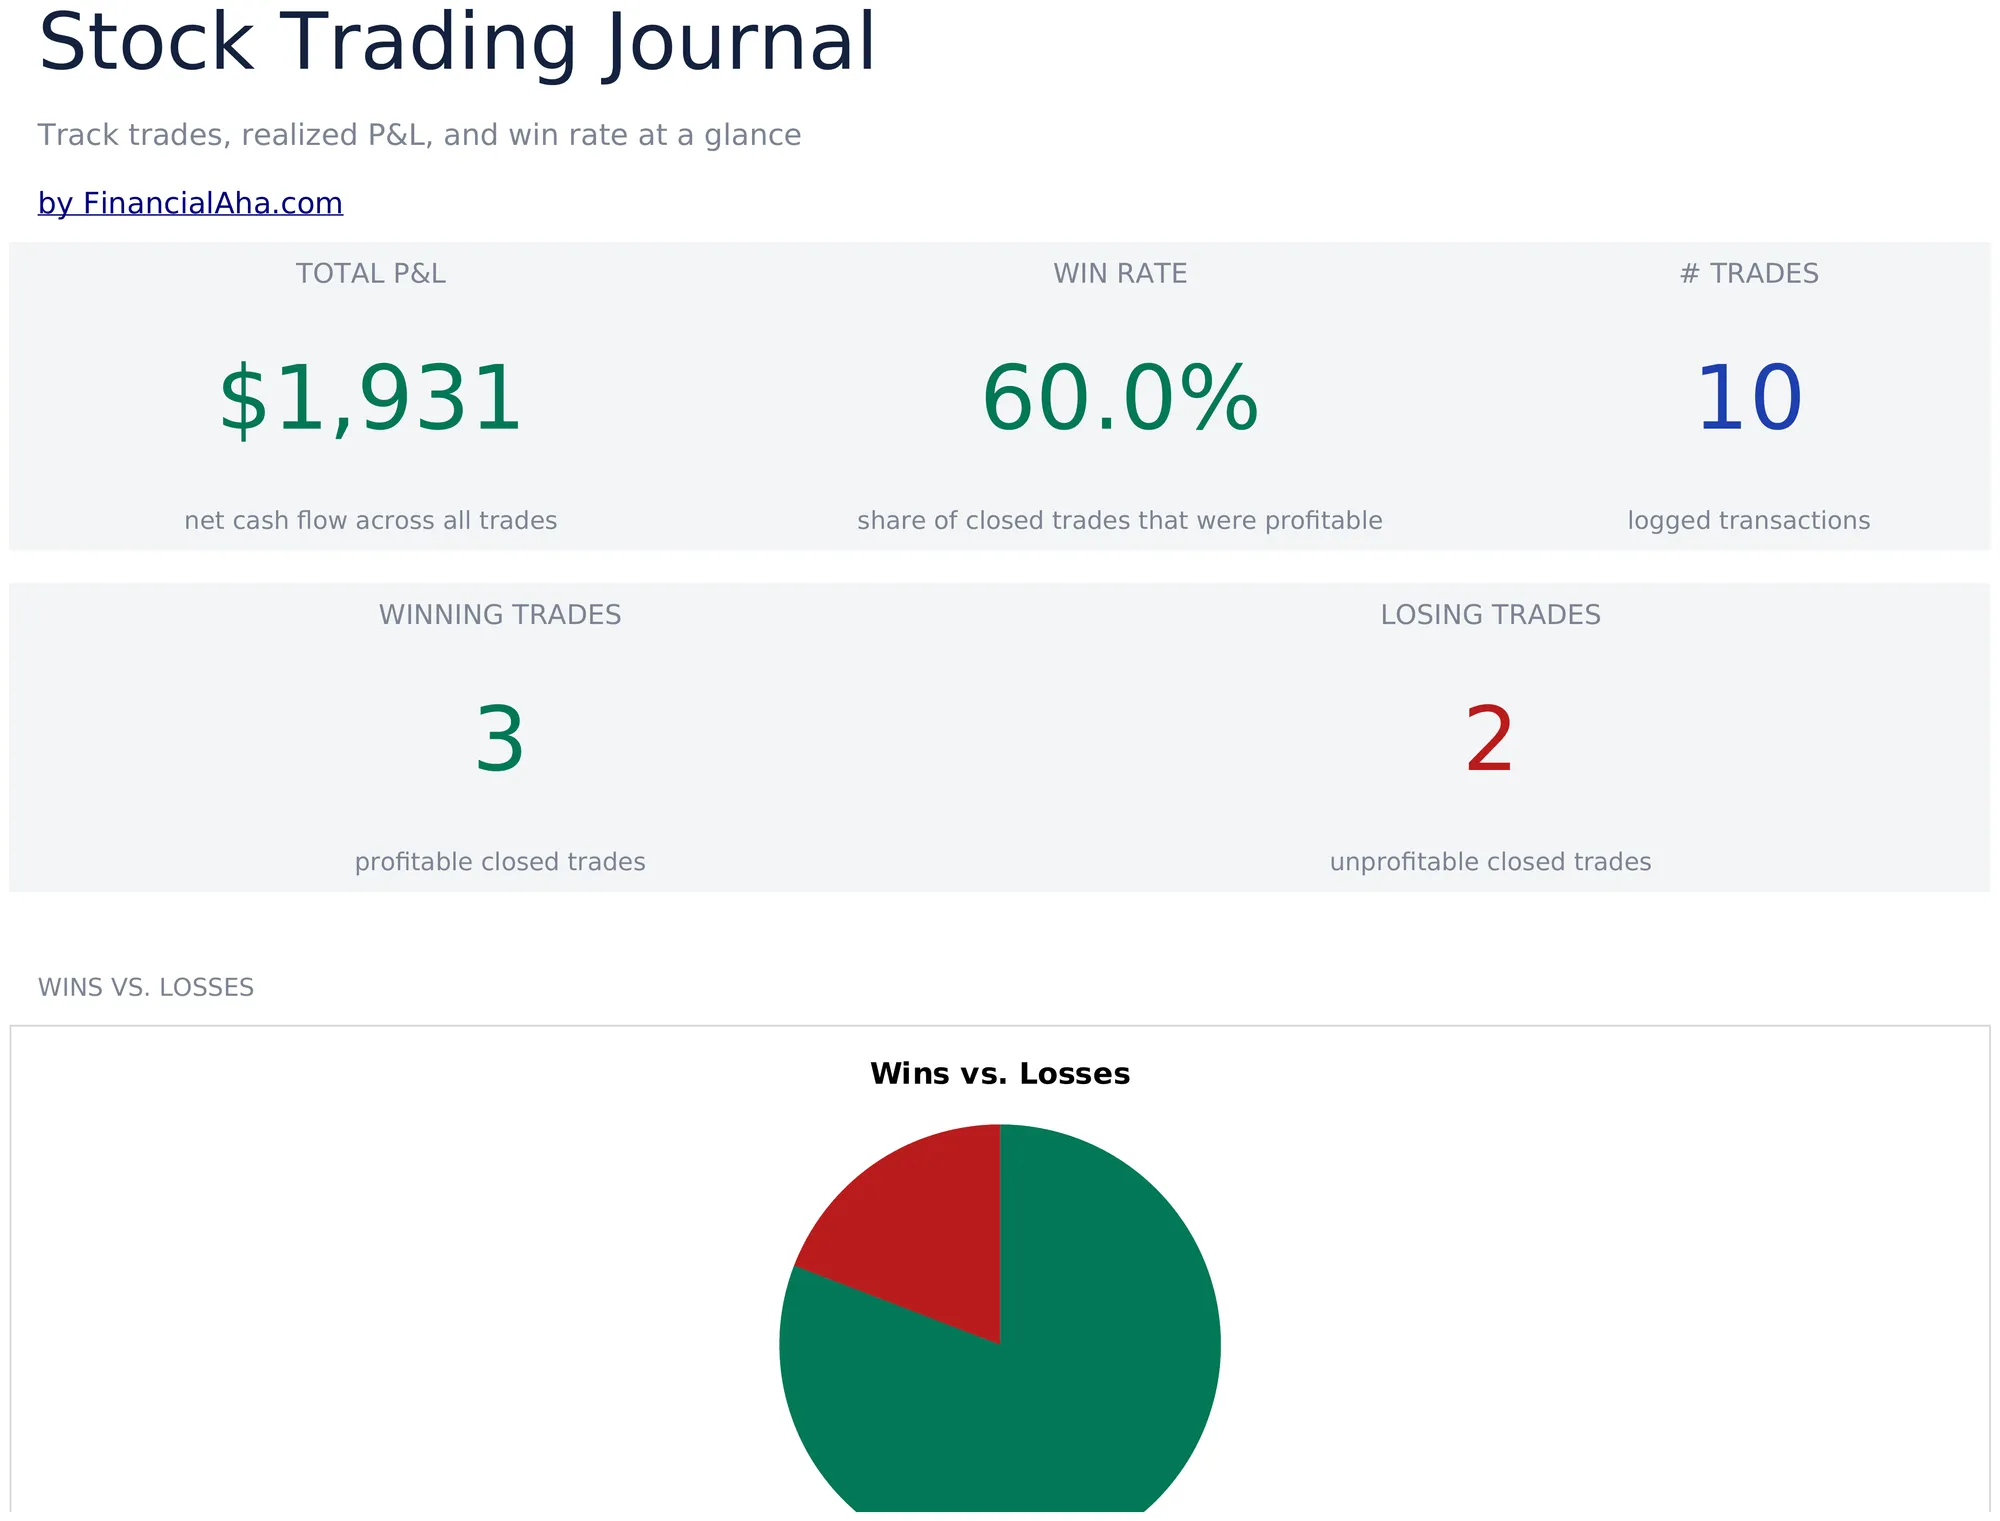
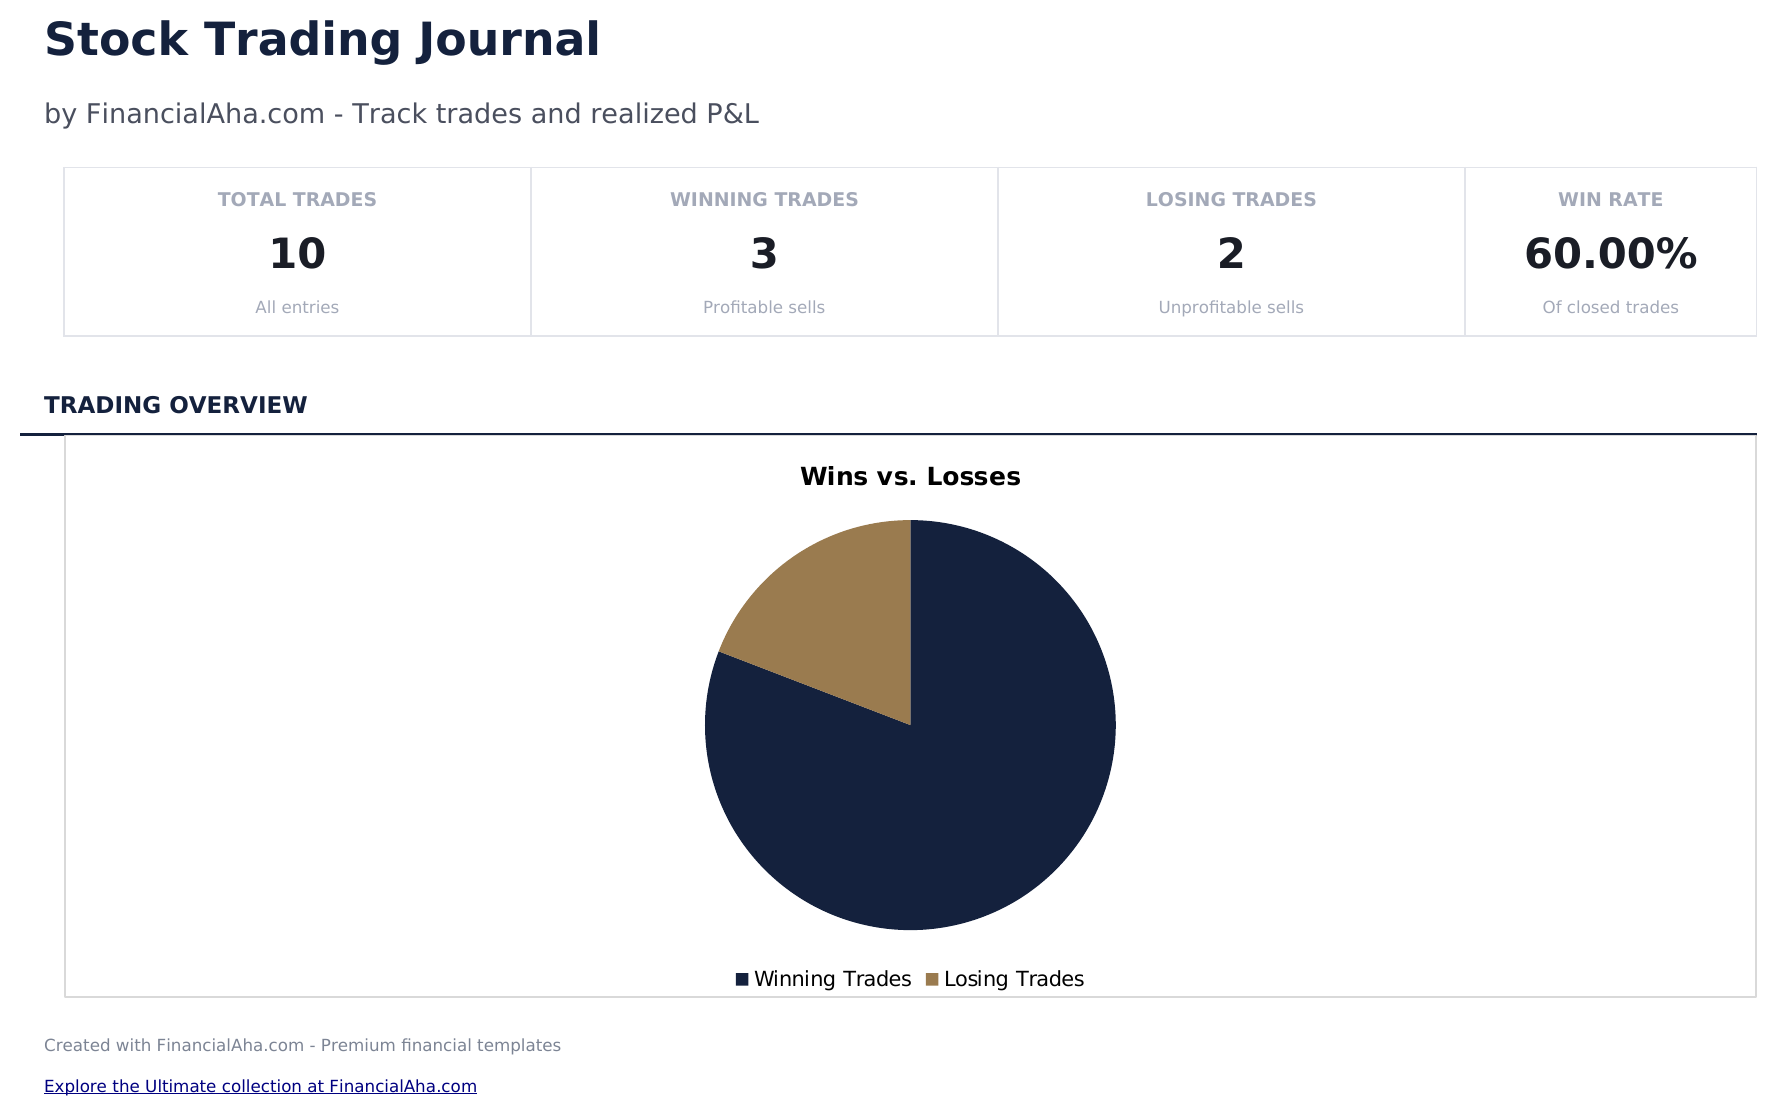
- 仪表板提供交易表现指标,显示总交易次数、胜率、平均回报和累计盈亏
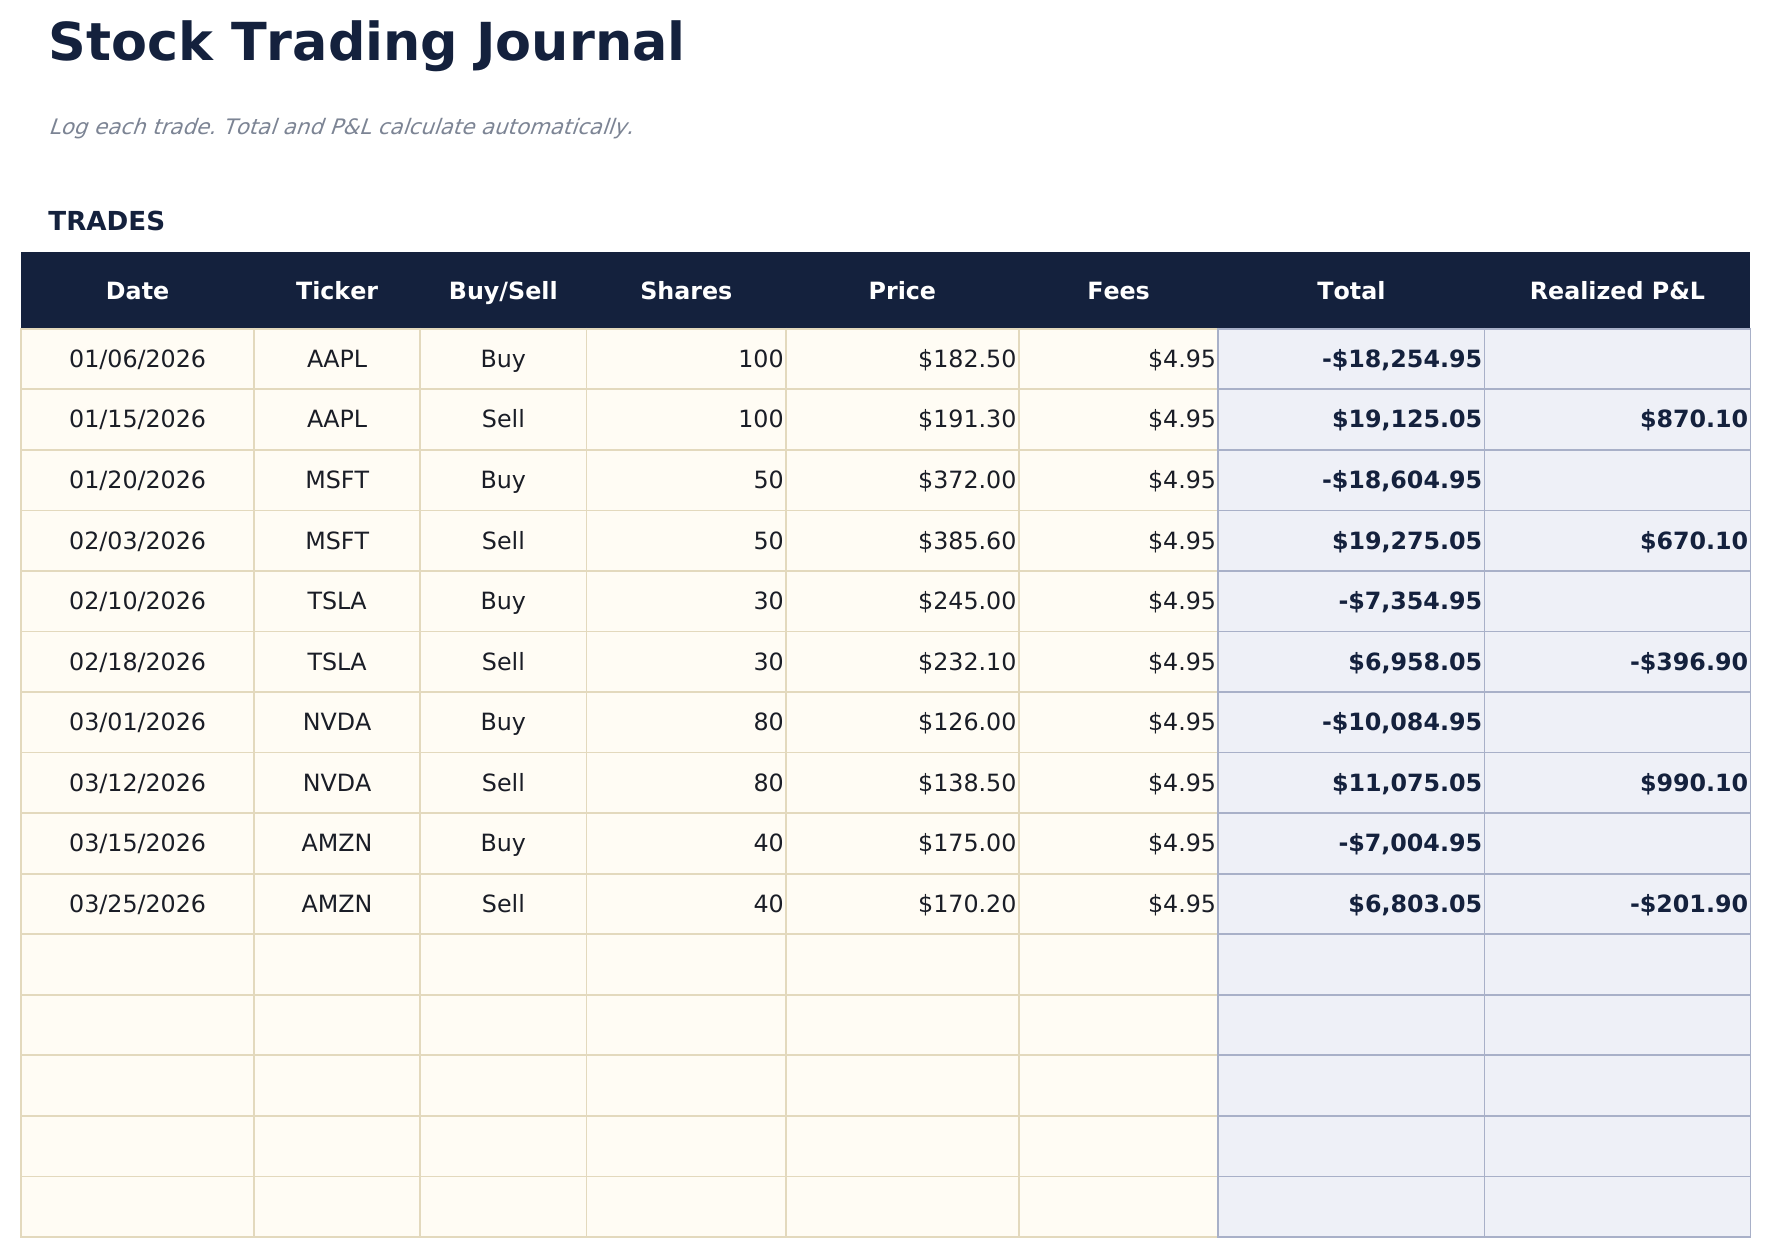
- 交易记录包含股票代码、买入日期、买入价、卖出日期、卖出价、股数和盈亏列
- 每笔交易的盈亏基于买入价、卖出价、股数和佣金成本自动计算
- 胜率和平均回报在每次交易录入后更新,并分别统计做多和做空数据
- 累计盈亏跟踪,配有彩色标记的输入单元格(黄色)和自动计算的表现指标(蓝色)
- 适用于 Microsoft Excel、Google Sheets 和 LibreOffice Calc,无需任何设置
Need more from this template?
The Essentials version covers everyday tracking. Ultimate goes further with multi-entity support, scenario analysis, and ultimate-grade reporting.
- 仪表板提供交易表现指标,显示总交易次数、胜率、平均回报和累计盈亏
- 交易记录包含股票代码、买入日期、买入价、卖出日期、卖出价、股数和盈亏列
- 每笔交易的盈亏基于买入价、卖出价、股数和佣金成本自动计算
- 胜率和平均回报在每次交易录入后更新,并分别统计做多和做空数据
- 记录最多200笔交易,含股票代码、日期、方向(做多/做空)、股数、入场价、出场价、策略和备注
- 仪表板包含6个KPI卡片:总盈亏、胜率、最佳交易、平均盈利、平均亏损和总交易数
- 绩效摘要显示总交易数、盈利数、亏损数、胜率、平均盈利、平均亏损以及按股票代码的最大盈利和亏损
- 月度盈亏表按月汇总交易:总交易数、盈利数、亏损数、总利润、总亏损和每月净盈亏
- 策略分析按交易策略分解绩效:胜率、平均盈亏、净盈亏和每种策略的交易数
预览
查看此模板的内容
如何使用这个股票交易日志模板
记录每笔交易
为每笔完成的交易输入股票代码、买入日期、买入价、卖出日期、卖出价和股数。
记录交易理由
添加关于每次买入和卖出原因的备注。这有助于回顾交易决策模式。
查看交易结果
每笔交易的盈亏基于买入价、卖出价、股数和佣金自动计算。
检查表现指标
仪表板显示总交易次数、胜率、平均盈利、平均亏损和累计盈亏。
Customer Reviews
What Our Customers Say
"If I get half as good at handling my finances as you are at customer service, this'll be the best $26 I've spent lately."
"Great tool! Simplifies financial planning without the hassle of complex spreadsheets."
"I recently purchased your super convenient spreadsheet, it really helps me!"
"They're great and super intuitive. Thank you!"
由 Claude AI 构建,经我们精心打磨。
我们使用 Claude AI 在深入研究后起草每个模板。然后由团队接手,优化布局、全面测试每个公式、修复边界情况,并打磨设计,直到达到我们自己愿意使用的标准。AI 完成了 80% 的工作,最后 20% 靠的是人工判断。
常见问题
能计算胜率吗?
可以。胜率为盈利交易次数除以总交易次数。仪表板在每次新交易录入后更新。
可以跟踪佣金吗?
可以。添加每笔交易的佣金成本。佣金会从盈利中扣除或计入亏损。
支持做空交易吗?
支持。对于做空交易,将卖空价作为买入价,回补价作为卖出价。盈亏计算对两个方向均正确。
能按股票代码查看表现吗?
按股票代码筛选或排序即可查看单只股票的所有交易。这有助于识别哪些股票盈利最多。
如何在 Google Sheets 中打开?
将 .xlsx 文件上传到 Google Drive,然后使用 Google Sheets 打开。所有公式和格式都会保留。
更多 投资与交易 Essentials 模板
亮点:
不如获取每一个 Ultimate 模板
全部 58 个 Ultimate 模板一次购买即可获得,仅需 $299 - 价值 $1,102,您可节省 $803。