Stock Trading Journal Essentials Template
Log stock trades with entry, exit, and profit/loss details. Track trading performance over time with running P&L calculations.
What's Included
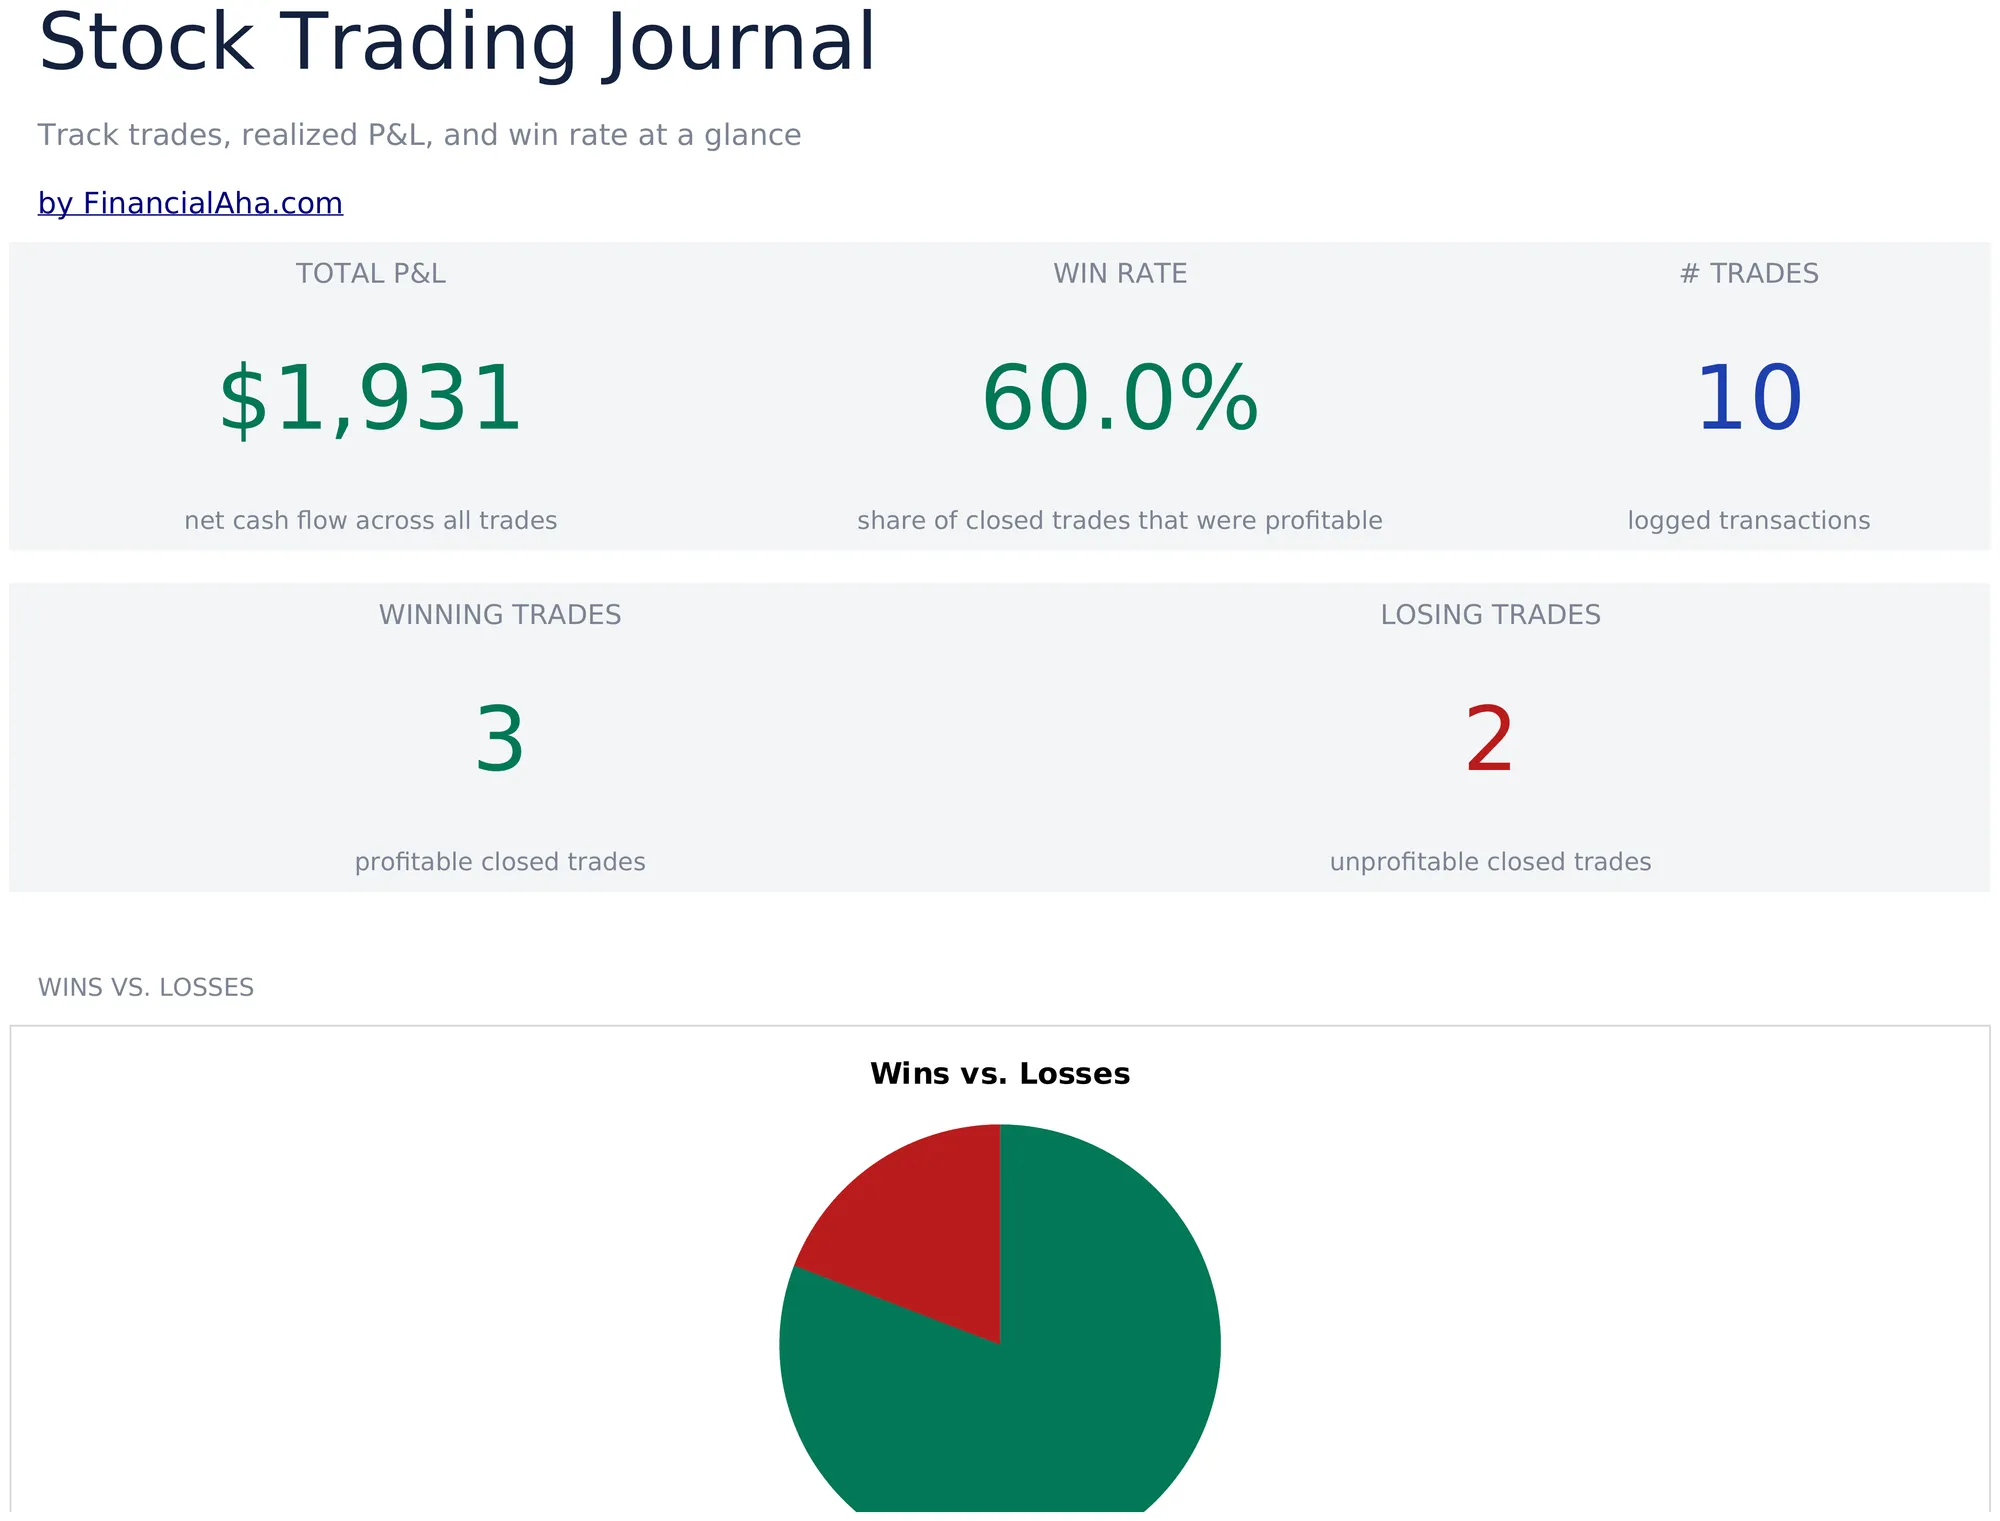
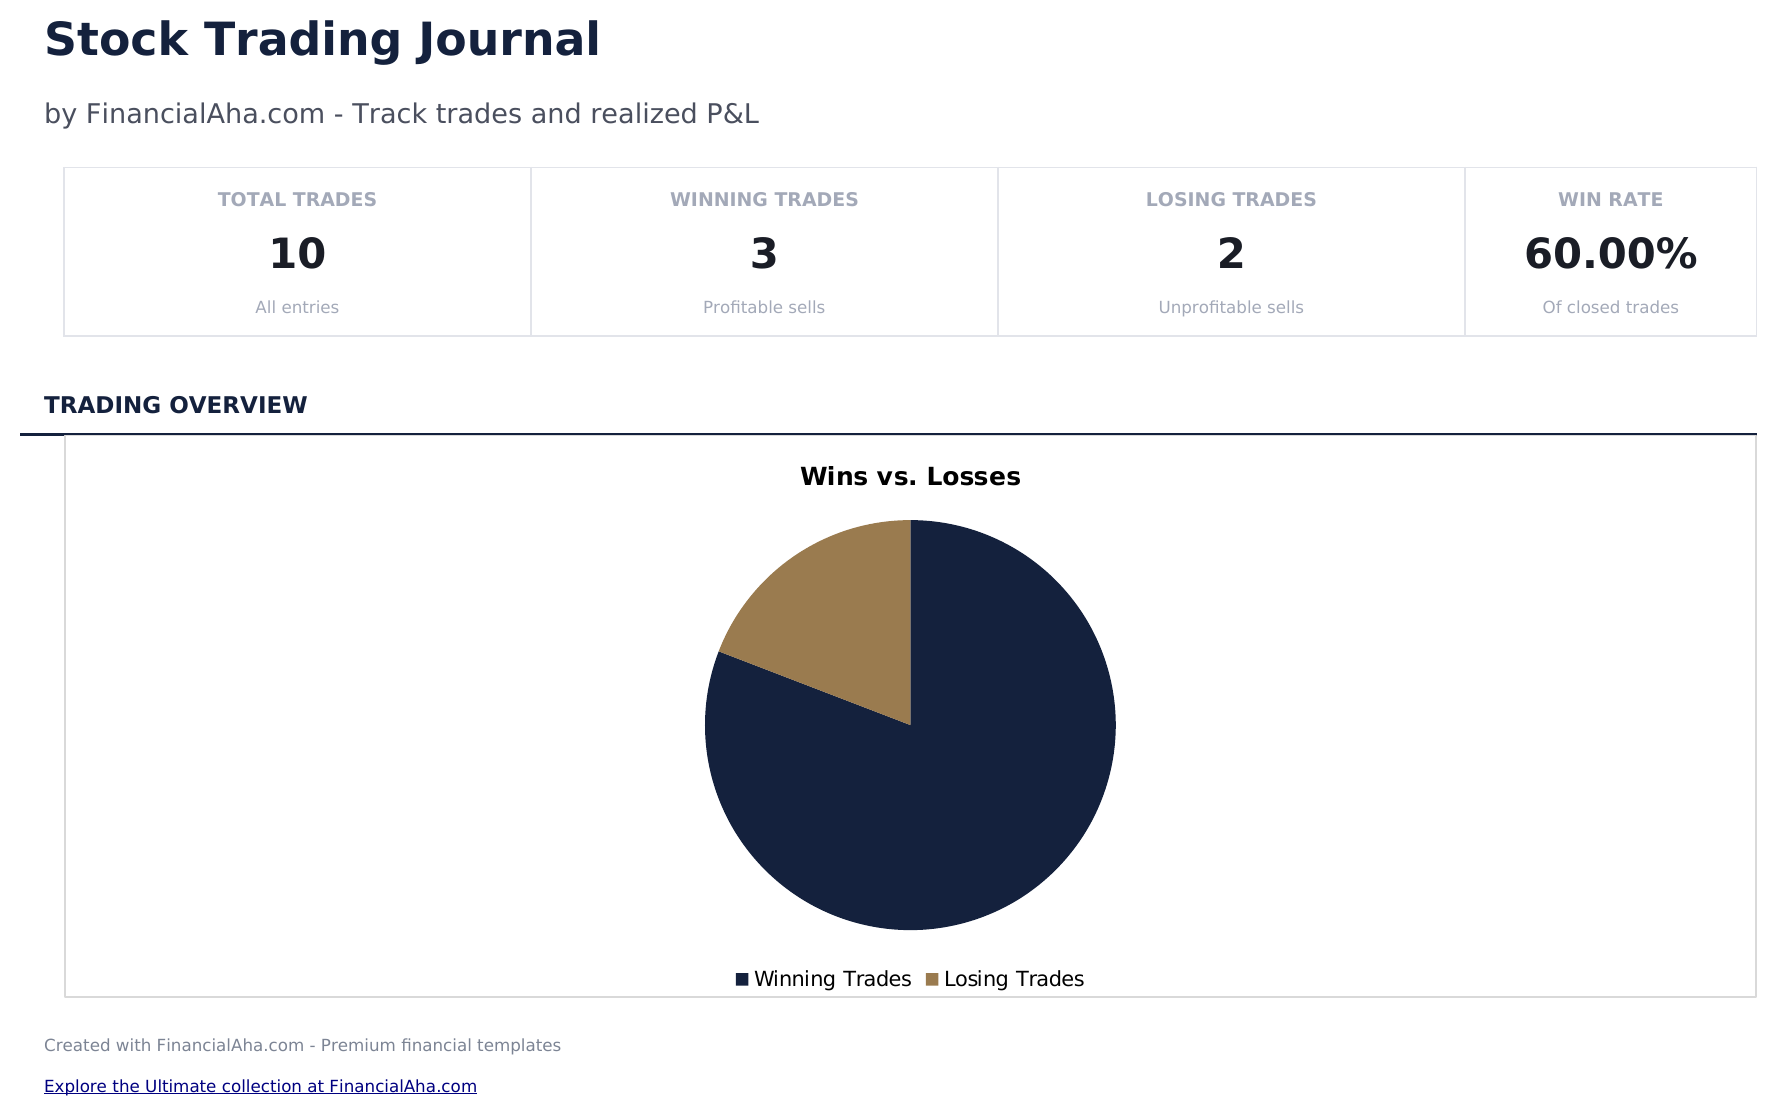
- Dashboard with trading performance metrics showing total trades, win rate, average return, and cumulative P&L
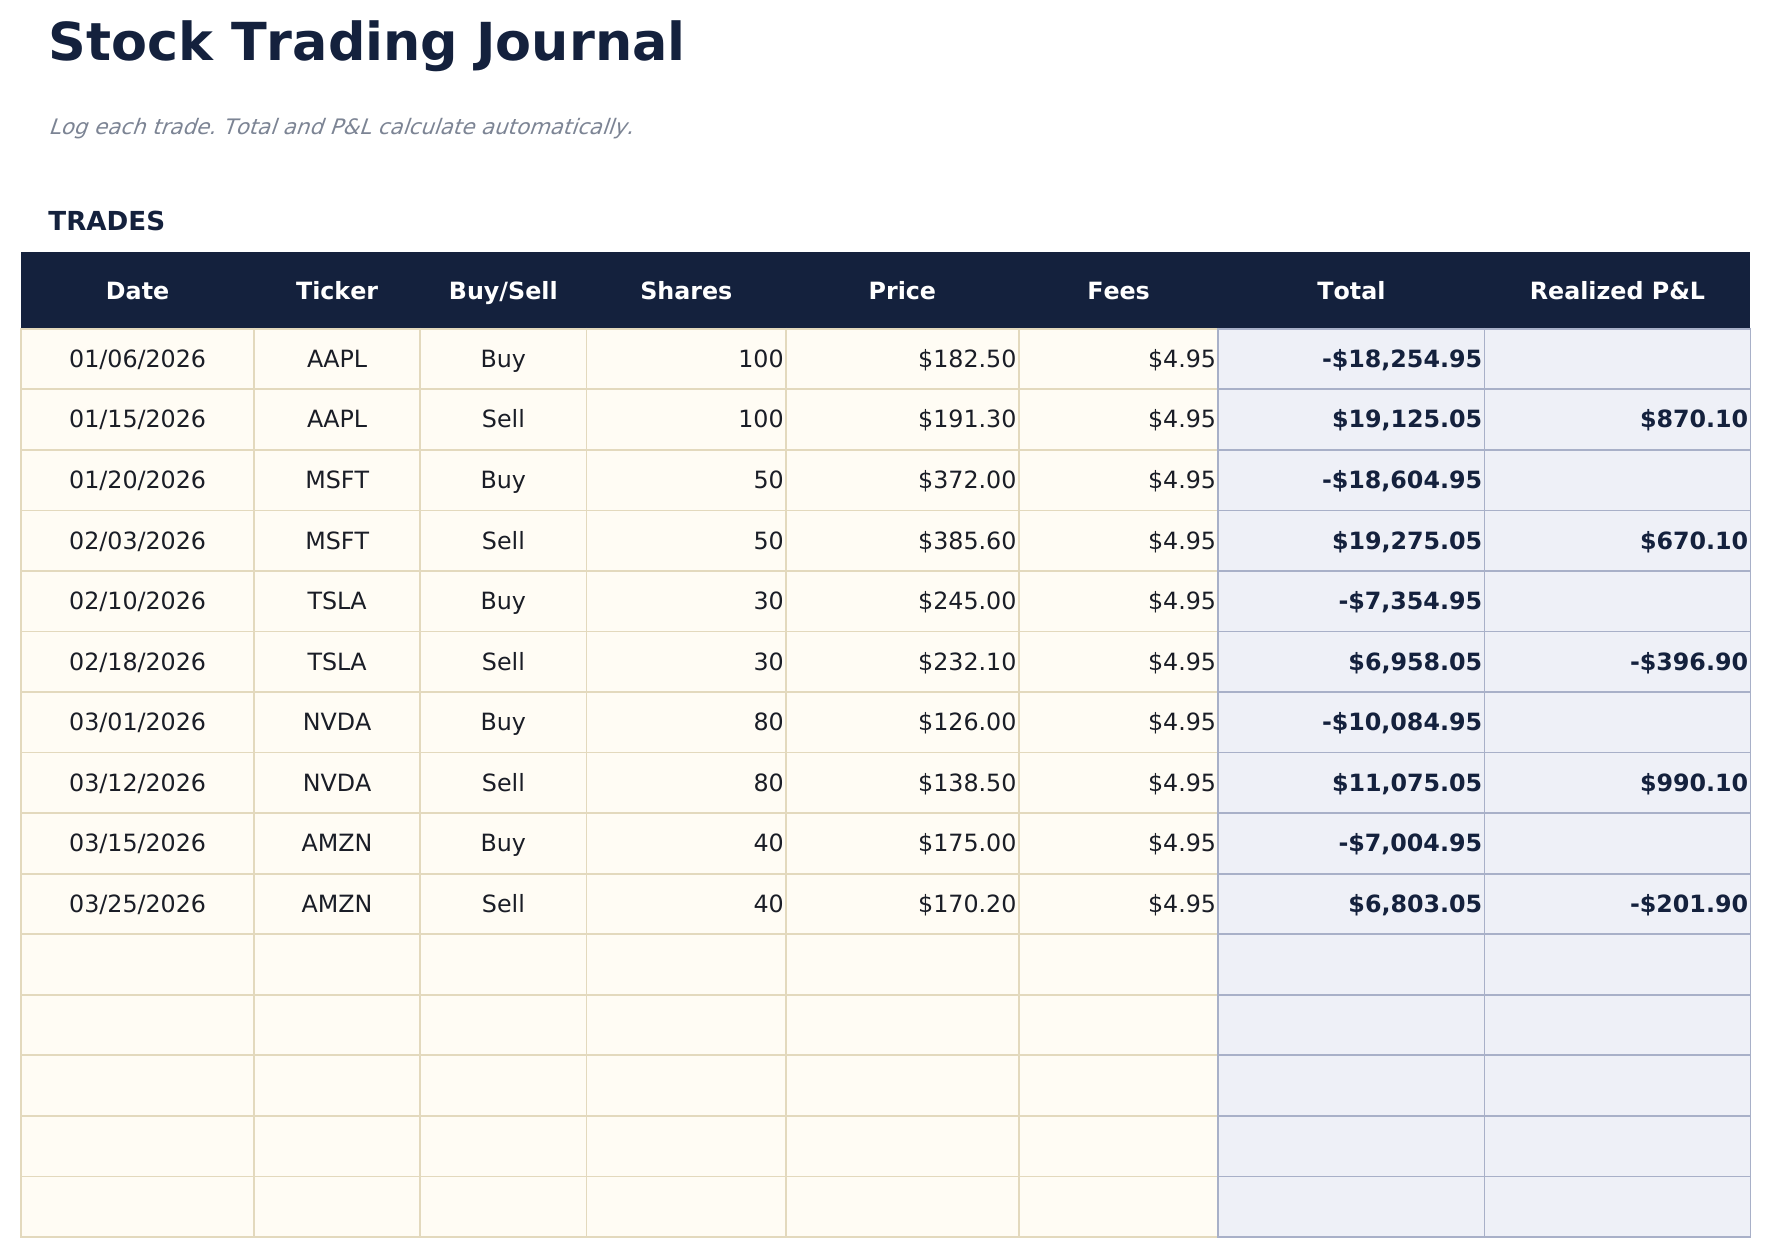
- Trade log with columns for ticker, date entered, entry price, date exited, exit price, shares, and profit or loss
- Profit and loss per trade calculated automatically from entry price, exit price, shares, and any commission costs
- Win rate and average return calculations updated after each trade entry with separate long and short stats
- Running cumulative P&L with color-coded input cells (yellow) and auto-calculated performance metrics (blue)
- Works in Microsoft Excel, Google Sheets, and LibreOffice Calc with no setup required
Need more from this template?
The Essentials version covers everyday tracking. Ultimate goes further with multi-entity support, scenario analysis, and ultimate-grade reporting.
- Dashboard with trading performance metrics showing total trades, win rate, average return, and cumulative P&L
- Trade log with columns for ticker, date entered, entry price, date exited, exit price, shares, and profit or loss
- Profit and loss per trade calculated automatically from entry price, exit price, shares, and any commission costs
- Win rate and average return calculations updated after each trade entry with separate long and short stats
- Log up to 200 trades with ticker, date, direction (Long/Short), shares, entry price, exit price, strategy, and notes
- Dashboard with 6 KPI cards: total P&L, win rate, best trade, average win, average loss, and total trades
- Performance Summary showing total trades, wins, losses, win rate, average gain, average loss, and largest win and loss by ticker
- Monthly P&L sheet aggregating trades by month: total trades, wins, losses, gross profit, gross loss, and net P&L per month
- Strategy Analysis breaking down performance by trading strategy: win rate, average P&L, net P&L, and trade count per strategy
Preview
See what's inside this template
How to Use This Stock Trading Journal Template
Log each trade
Enter the ticker, entry date, entry price, exit date, exit price, and number of shares for every completed trade.
Record your rationale
Add notes about why you entered and exited each position. This helps review decision patterns over time.
Review trade results
Profit or loss per trade calculates automatically from entry price, exit price, shares, and commissions.
Check performance metrics
The dashboard shows total trades, win rate, average gain, average loss, and cumulative P&L.
Customer Reviews
What Our Customers Say
"If I get half as good at handling my finances as you are at customer service, this'll be the best $26 I've spent lately."
"Great tool! Simplifies financial planning without the hassle of complex spreadsheets."
"I recently purchased your super convenient spreadsheet, it really helps me!"
"They're great and super intuitive. Thank you!"
Built by Claude AI. Perfected by us.
We use Claude AI to draft each template, after a deep research. Then our team steps in. We refine the layout, stress-test every formula, fix edge cases, and polish the design until it feels like something we would actually use ourselves. The AI gets us 80% there. The last 20% is all human judgment.
Frequently Asked Questions
Does it calculate win rate?
Yes. Win rate is the number of profitable trades divided by total trades. The dashboard updates after each new trade entry.
Can I track commissions?
Yes. Add commission costs per trade. They are subtracted from the profit or added to the loss for each position.
Does it support short selling?
Yes. For short trades, enter the short sale price as the entry and the cover price as the exit. The P&L calculation works correctly for both directions.
Can I see performance by ticker?
Filter or sort by ticker to see all trades in a single stock. This helps identify which tickers are most profitable.
How do I open this in Google Sheets?
Upload the .xlsx file to Google Drive, then open it with Google Sheets. All formulas and formatting will be preserved.
More Essentials Investing & Trading Templates
Highlights:
Looking for premium spreadsheet templates?
Our paid templates include advanced multi-sheet dashboards, native Excel charts, and ongoing updates.
Get every Ultimate template instead
All 58 Ultimate templates in one purchase for $299 - $1,102 value, you keep $803.