Aandelenhandelsdagboek Essentials-sjabloon
Registreer aandelentransacties met instap-, uitstap- en winst/verliesdetails. Volg handelsprestaties met doorlopende W&V-berekeningen.
Wat zit erin
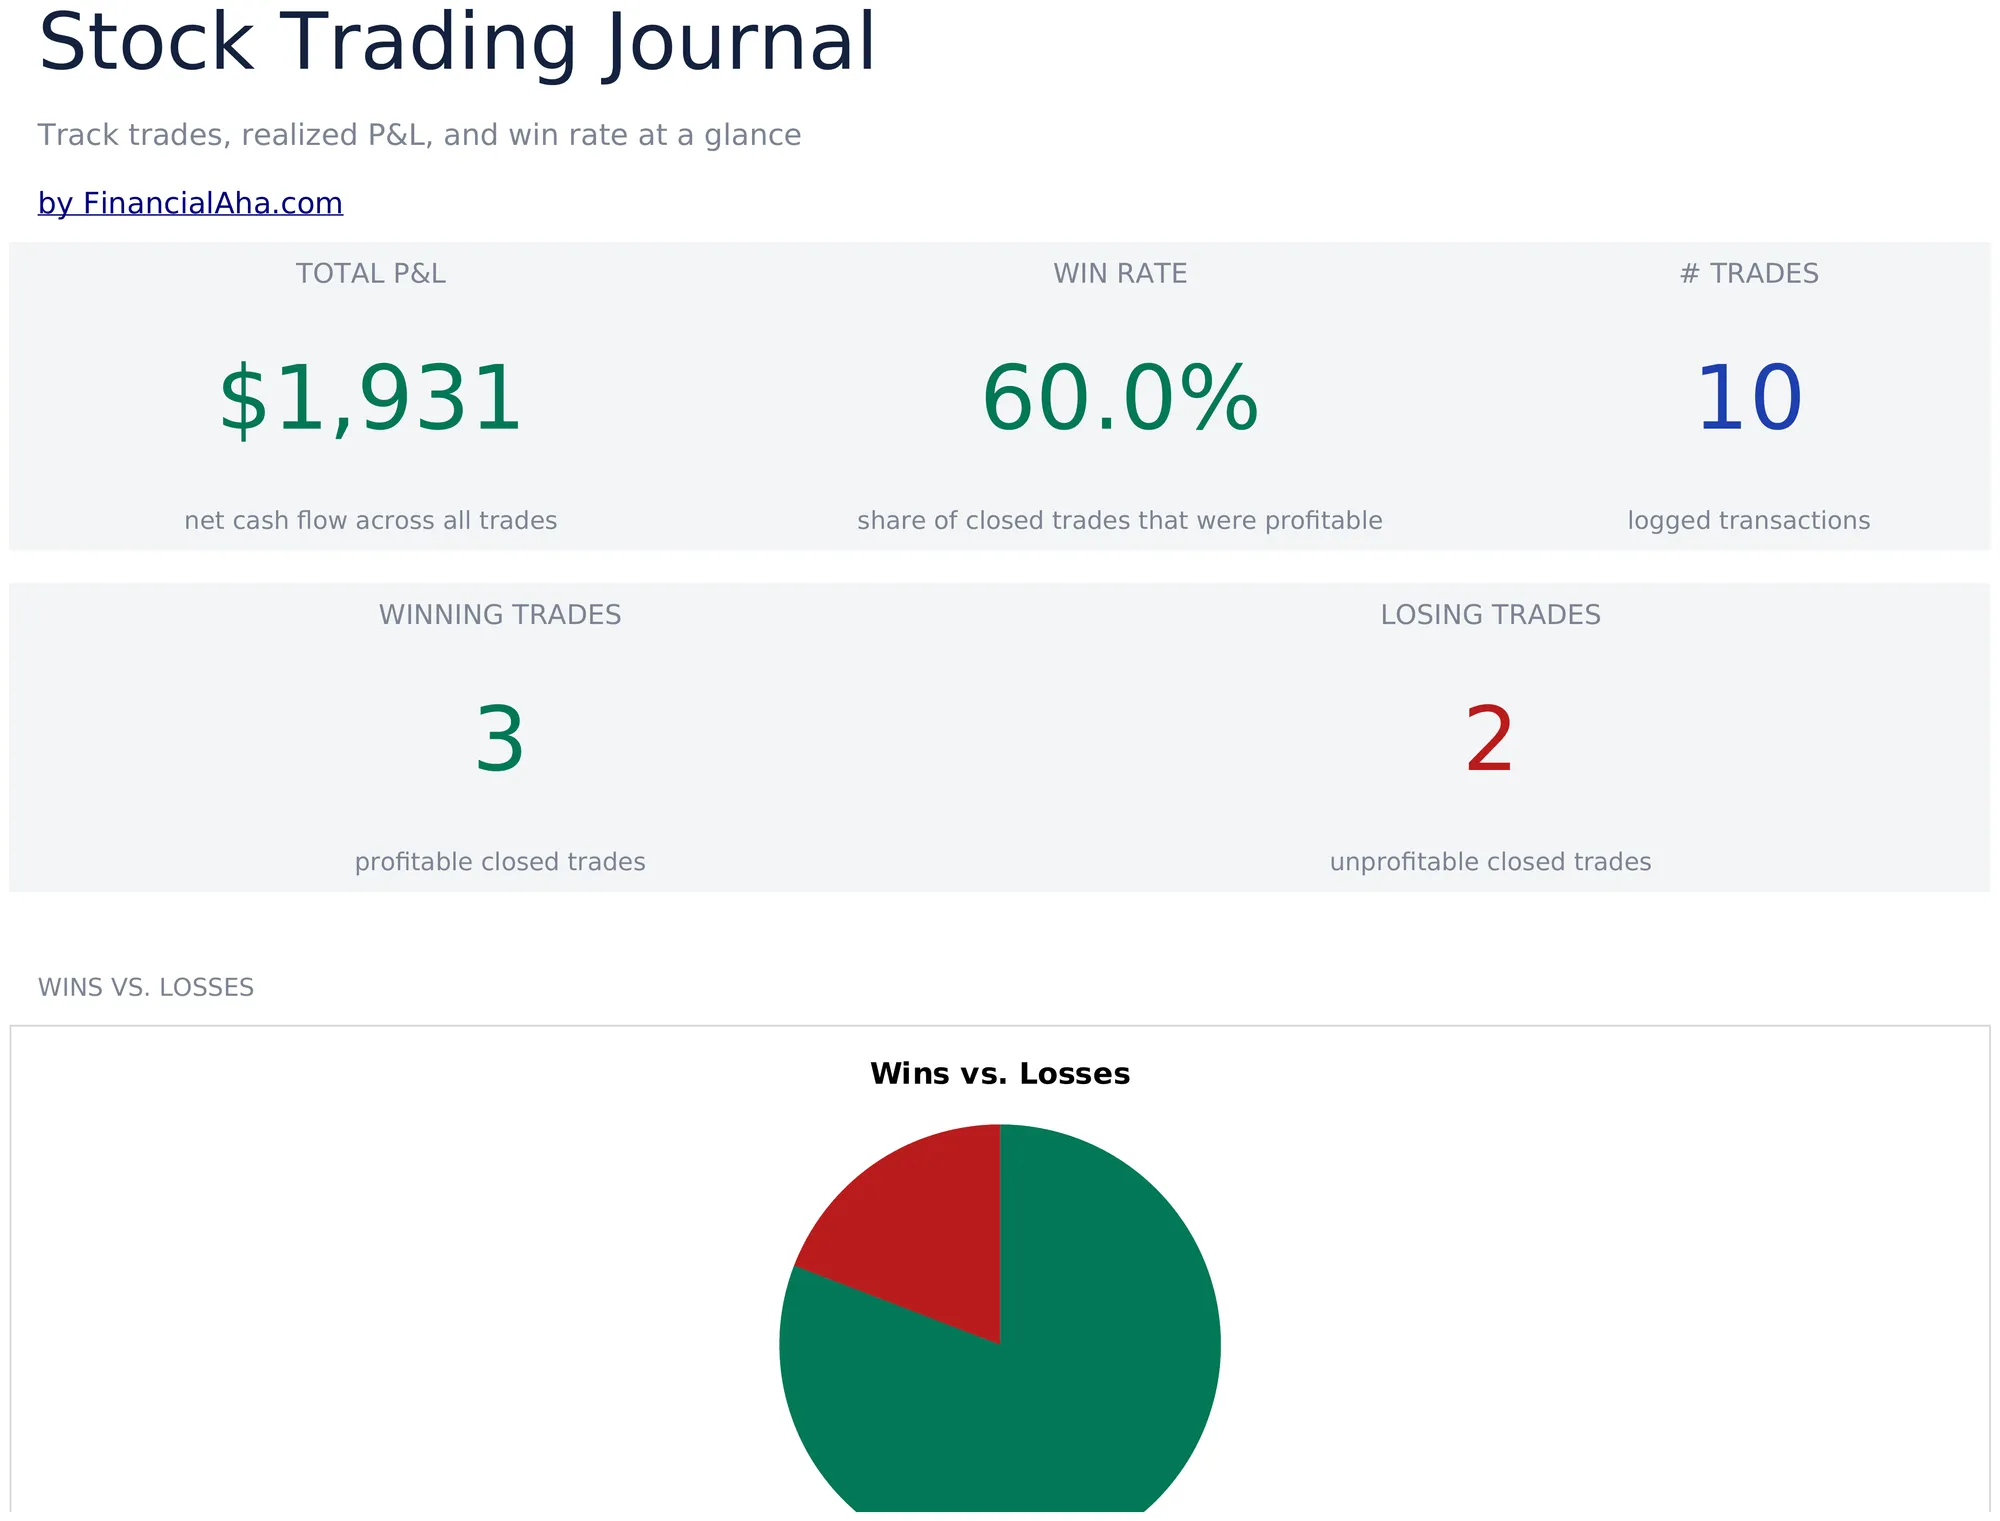
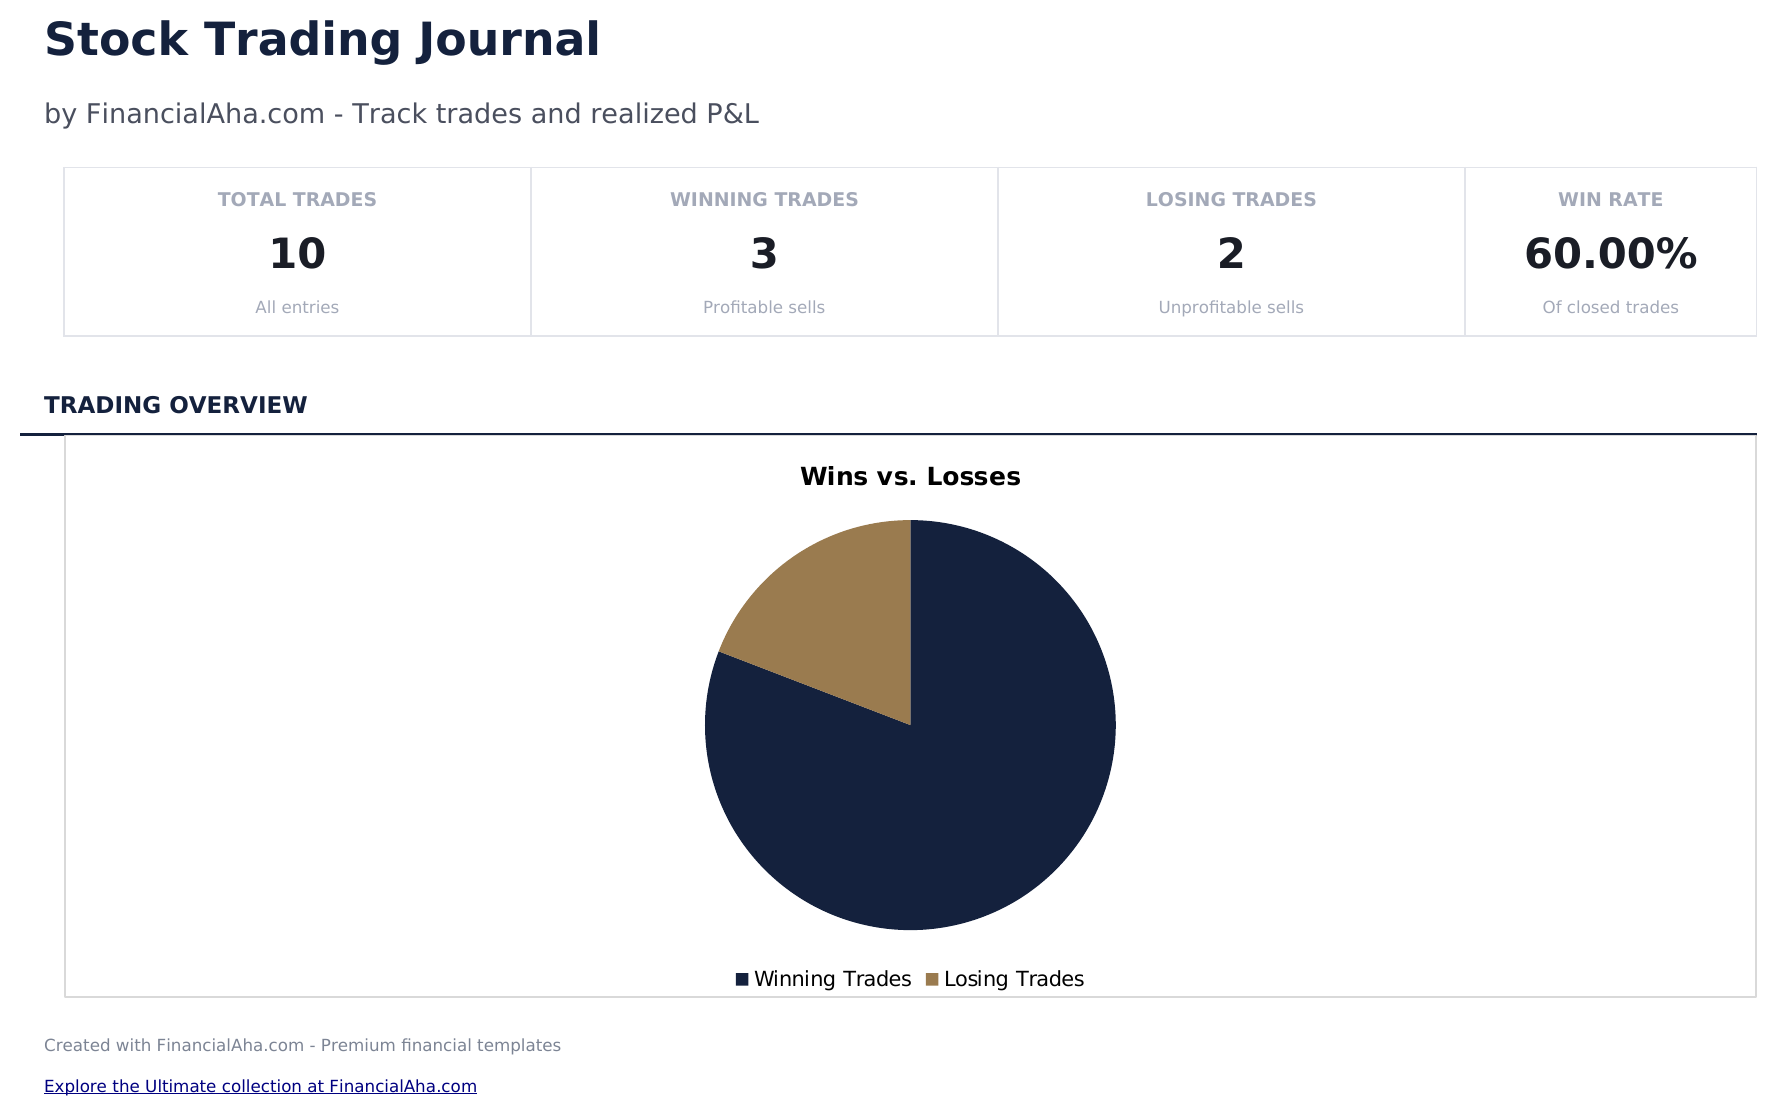
- Dashboard met handelsprestatiemetrieken met totaal transacties, winstpercentage, gemiddeld rendement en cumulatieve W&V
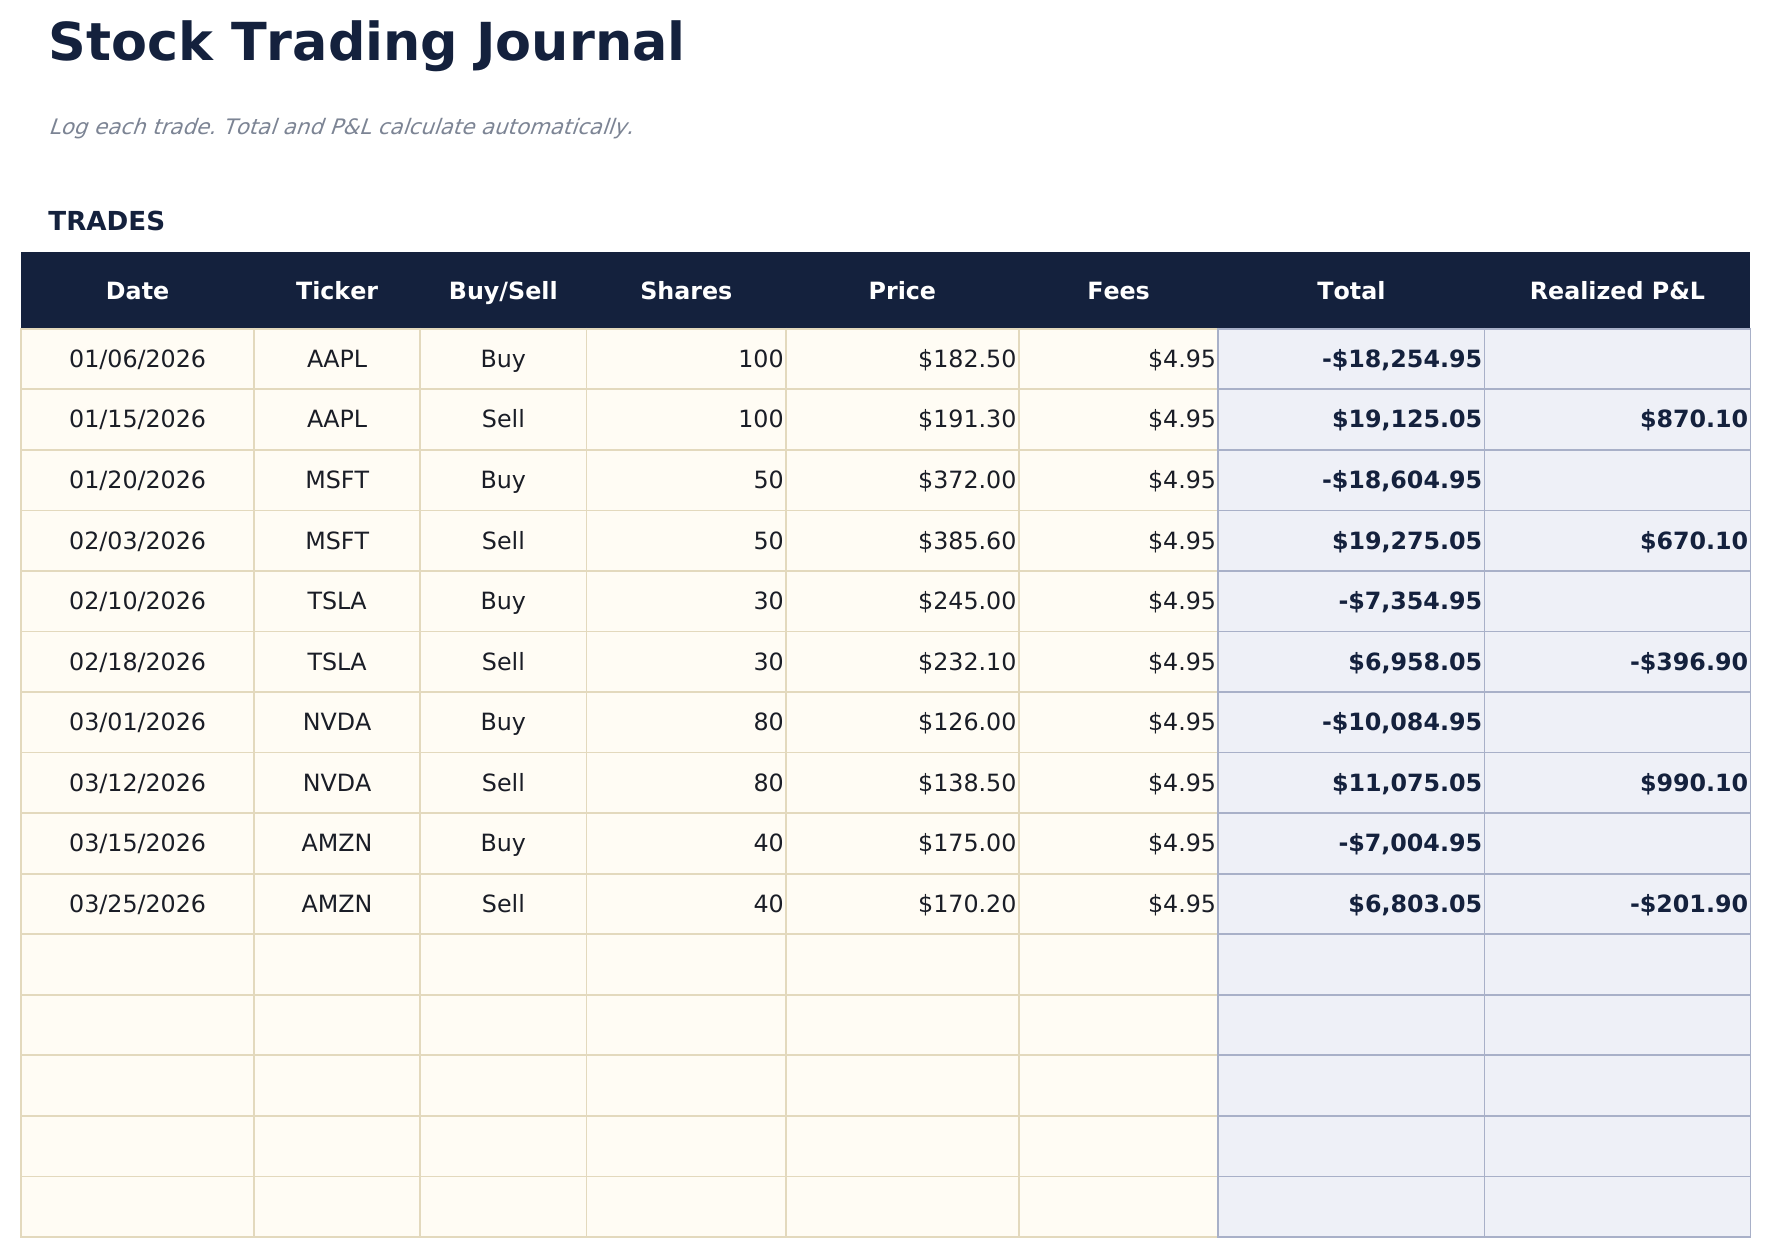
- Transactielogboek met kolommen voor ticker, instapdatum, instapprijs, uitstapdatum, uitstapprijs, aandelen en winst of verlies
- Winst en verlies per transactie automatisch berekend op basis van instapprijs, uitstapprijs, aandelen en eventuele commissiekosten
- Winstpercentage en gemiddeld rendement berekeningen bijgewerkt na elke transactie met aparte long- en shortstatistieken
- Doorlopende cumulatieve W&V met kleurgecodeerde invoercellen (geel) en automatisch berekende prestatiemetrieken (blauw)
- Werkt in Microsoft Excel, Google Sheets en LibreOffice Calc zonder installatie
Need more from this template?
The Essentials version covers everyday tracking. Ultimate goes further with multi-entity support, scenario analysis, and ultimate-grade reporting.
- Dashboard met handelsprestatiemetrieken met totaal transacties, winstpercentage, gemiddeld rendement en cumulatieve W&V
- Transactielogboek met kolommen voor ticker, instapdatum, instapprijs, uitstapdatum, uitstapprijs, aandelen en winst of verlies
- Winst en verlies per transactie automatisch berekend op basis van instapprijs, uitstapprijs, aandelen en eventuele commissiekosten
- Winstpercentage en gemiddeld rendement berekeningen bijgewerkt na elke transactie met aparte long- en shortstatistieken
- Registreer tot 200 trades met ticker, datum, richting (Long/Short), aandelen, instapprijs, uitstapprijs, strategie en notities
- Dashboard met 6 KPI-kaarten: totaal winst/verlies, winstpercentage, beste trade, gemiddelde winst, gemiddeld verlies en totaal trades
- Prestatieoverzicht met totaal trades, winsten, verliezen, winstpercentage, gemiddelde winst, gemiddeld verlies en grootste winst en verlies per ticker
- Werkblad Maandelijks Winst/Verlies dat trades per maand aggregeert: totaal trades, winsten, verliezen, brutowinst, brutoverlies en netto winst/verlies per maand
- Strategieanalyse die prestaties per handelsstrategie uitsplitst: winstpercentage, gemiddeld winst/verlies, netto winst/verlies en aantal trades per strategie
Voorbeeld
Bekijk wat er in dit sjabloon zit
Hoe gebruik je dit Aandelenhandelsdagboek sjabloon
Registreer elke transactie
Voer de ticker, instapdatum, instapprijs, uitstapdatum, uitstapprijs en aantal aandelen in voor elke voltooide transactie.
Noteer uw onderbouwing
Voeg notities toe over waarom u de positie bent aangegaan en verlaten. Dit helpt bij het evalueren van beslissingspatronen.
Bekijk transactieresultaten
Winst of verlies per transactie wordt automatisch berekend op basis van instapprijs, uitstapprijs, aandelen en commissies.
Controleer prestatiemetrieken
Het dashboard toont totaal transacties, winstpercentage, gemiddelde winst, gemiddeld verlies en cumulatieve W&V.
Customer Reviews
What Our Customers Say
"If I get half as good at handling my finances as you are at customer service, this'll be the best $26 I've spent lately."
"Great tool! Simplifies financial planning without the hassle of complex spreadsheets."
"I recently purchased your super convenient spreadsheet, it really helps me!"
"They're great and super intuitive. Thank you!"
Gebouwd door Claude AI. Verfijnd door ons.
We gebruiken Claude AI om elk sjabloon te ontwerpen, na uitgebreid onderzoek. Daarna neemt ons team het over. We verfijnen de indeling, testen elke formule grondig, lossen randgevallen op en polijsten het ontwerp totdat het iets is dat we zelf ook echt zouden gebruiken. De AI brengt ons 80% van de weg. De laatste 20% is puur menselijk oordeel.
Veelgestelde vragen
Berekent het het winstpercentage?
Ja. Het winstpercentage is het aantal winstgevende transacties gedeeld door het totaal aantal transacties. Het dashboard wordt bijgewerkt na elke nieuwe transactie.
Kan ik commissies bijhouden?
Ja. Voeg commissiekosten toe per transactie. Deze worden afgetrokken van de winst of opgeteld bij het verlies per positie.
Ondersteunt het short selling?
Ja. Voor shorttransacties voert u de shortverkoopprijs in als instap en de dekkingsprijs als uitstap. De W&V-berekening werkt correct voor beide richtingen.
Kan ik prestaties per ticker zien?
Filter of sorteer op ticker om alle transacties in een enkel aandeel te zien. Dit helpt te identificeren welke tickers het meest winstgevend zijn.
Hoe open ik dit in Google Sheets?
Upload het .xlsx-bestand naar Google Drive en open het vervolgens met Google Sheets. Alle formules en opmaak blijven behouden.
Meer Essentials-sjablonen voor Beleggen & Handelen
Hoogtepunten:
Op zoek naar premium spreadsheet-sjablonen?
Onze betaalde sjablonen bevatten geavanceerde dashboards met meerdere werkbladen, ingebouwde Excel-grafieken en doorlopende updates.
Krijg in plaats daarvan elk Ultimate sjabloon
Alle 58 Ultimate sjablonen in één aankoop voor $299 - $1,102 waarde, u houdt $803 over.