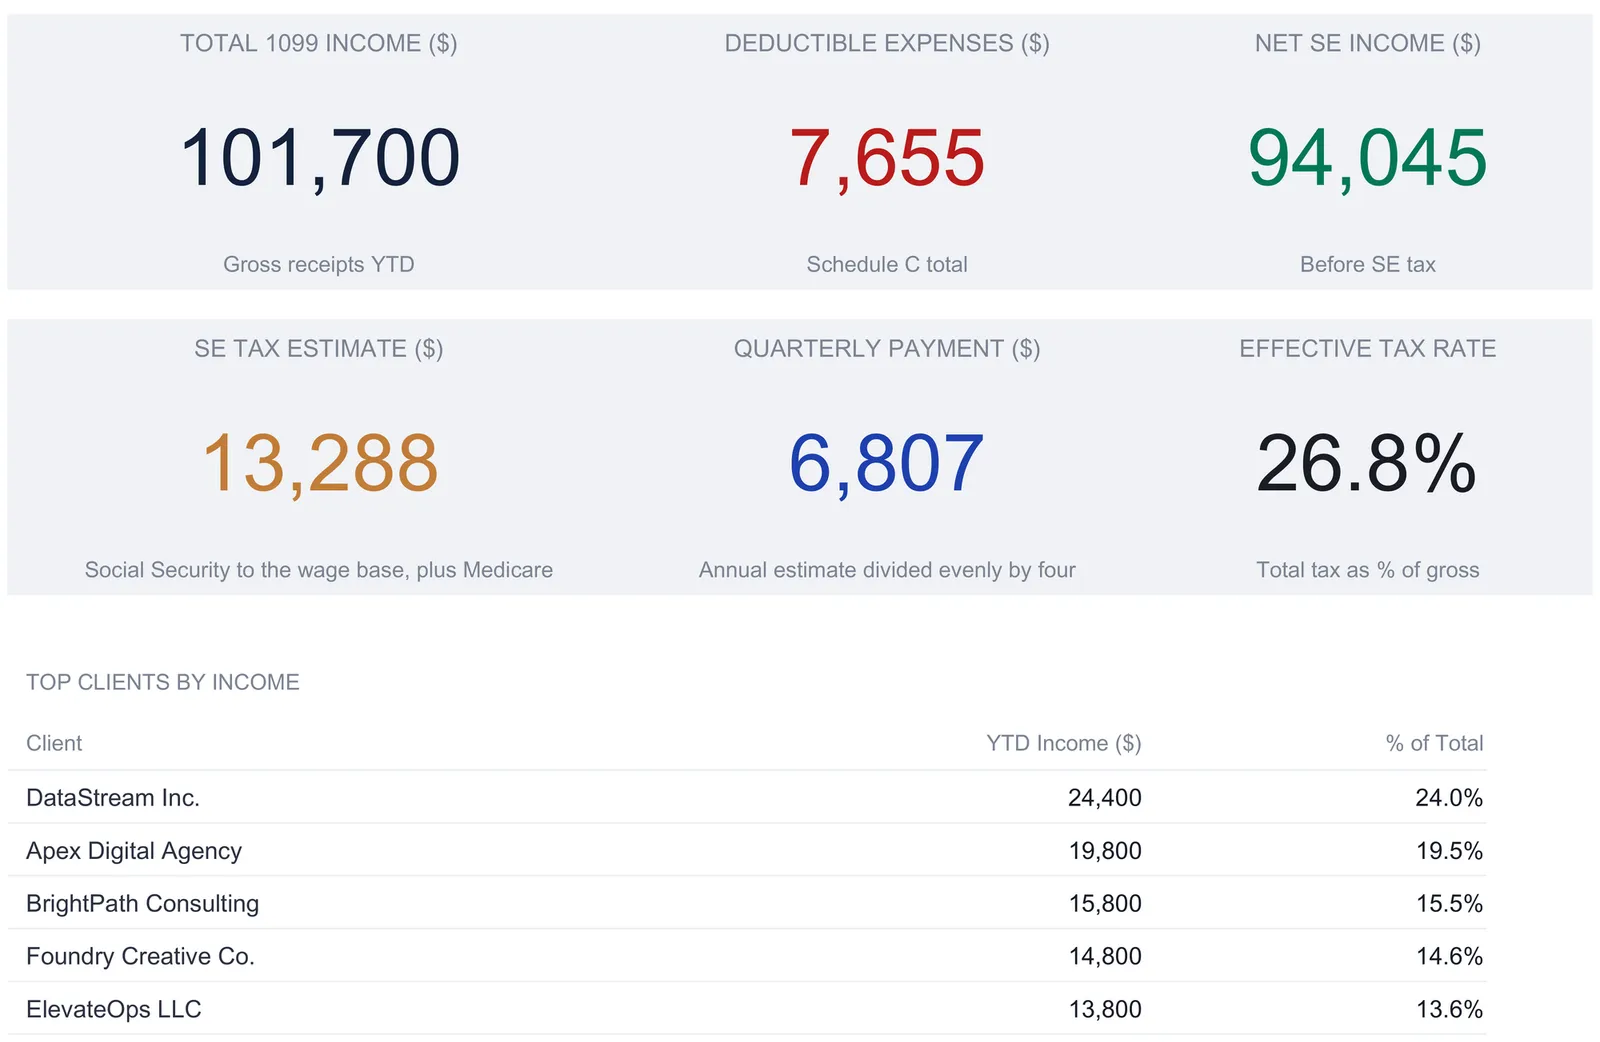
A 1099 income tracker keeps every client payment in one log, records business costs against Schedule C categories, and derives the rest: income by client, a quarterly estimate, a Schedule C prep sheet, and a dashboard. This walkthrough follows the whole structure with a worked example, a contractor with $101,700 in 1099 income across six payers, $7,655 in deductible expenses, and $94,045 of net self-employment income. Our 1099 Income Tracker Ultimate ($29) ships it ready-made for Excel and Google Sheets.
Independent work pays in scattered pieces. A payment lands from one client, then another from a second, then a platform deposit that looks nothing like an invoice, and by the end of the year the money has arrived through five different channels from six different payers. Come tax season the question is not how much showed up in the bank, which is easy, but how much of it was income, how much of it was offset by deductible costs, and how much should have been set aside along the way. A spreadsheet answers those three questions from one place, provided the raw payments are logged once and everything else is left to read from them.
That is the shape of a 1099 income tracker: a single income log, a separate expense log keyed to Schedule C categories, and then a set of derived views that never get typed into - income by client, a quarterly estimate, a Schedule C prep sheet, and a dashboard on top. The examples below come from our 1099 Income Tracker Ultimate Spreadsheet Template ($29), which ships the whole structure ready-made for Excel and Google Sheets. The layout is reproducible by hand if you would rather build your own; what matters is how the pieces connect.
What a 1099 income tracker has to hold
Behind the dashboard there are only a few kinds of data, each on its own sheet:
- Payment records. Every 1099 payment received, with the date, the payer, a description, the form type, and the amount. This is the one place a payment is ever typed.
- Business costs. Each expense, its Schedule C category, the amount, and the share of it you are treating as deductible.
- Income by client. Each payer totaled from the log, with a marker for whether the total crosses the reporting threshold you set.
- A quarterly estimate. The income and expenses split by quarter, and, from your own tax assumptions, a self-employment tax figure, an income tax figure, and a quarterly payment.
- A Schedule C prep sheet. The same totals arranged to mirror the line numbers on the IRS form.
- Derived metrics. The dashboard’s six tiles, its top-clients table, and its two charts. Nothing here is typed; it is all calculation.
The workbook gives each of these its own sheet (Income Log, Expense Log, Client Summary, Quarterly Estimates, Schedule C Prep) with a Dashboard on top and a How to Use sheet carrying the instructions. There is no separate settings tab: the currency selector sits on the Dashboard, and the tax assumptions sit on the Quarterly Estimates sheet, each next to the numbers it drives. Following the order the How to Use sheet lays out, the income log comes first.
Log every payment once: the Income Log
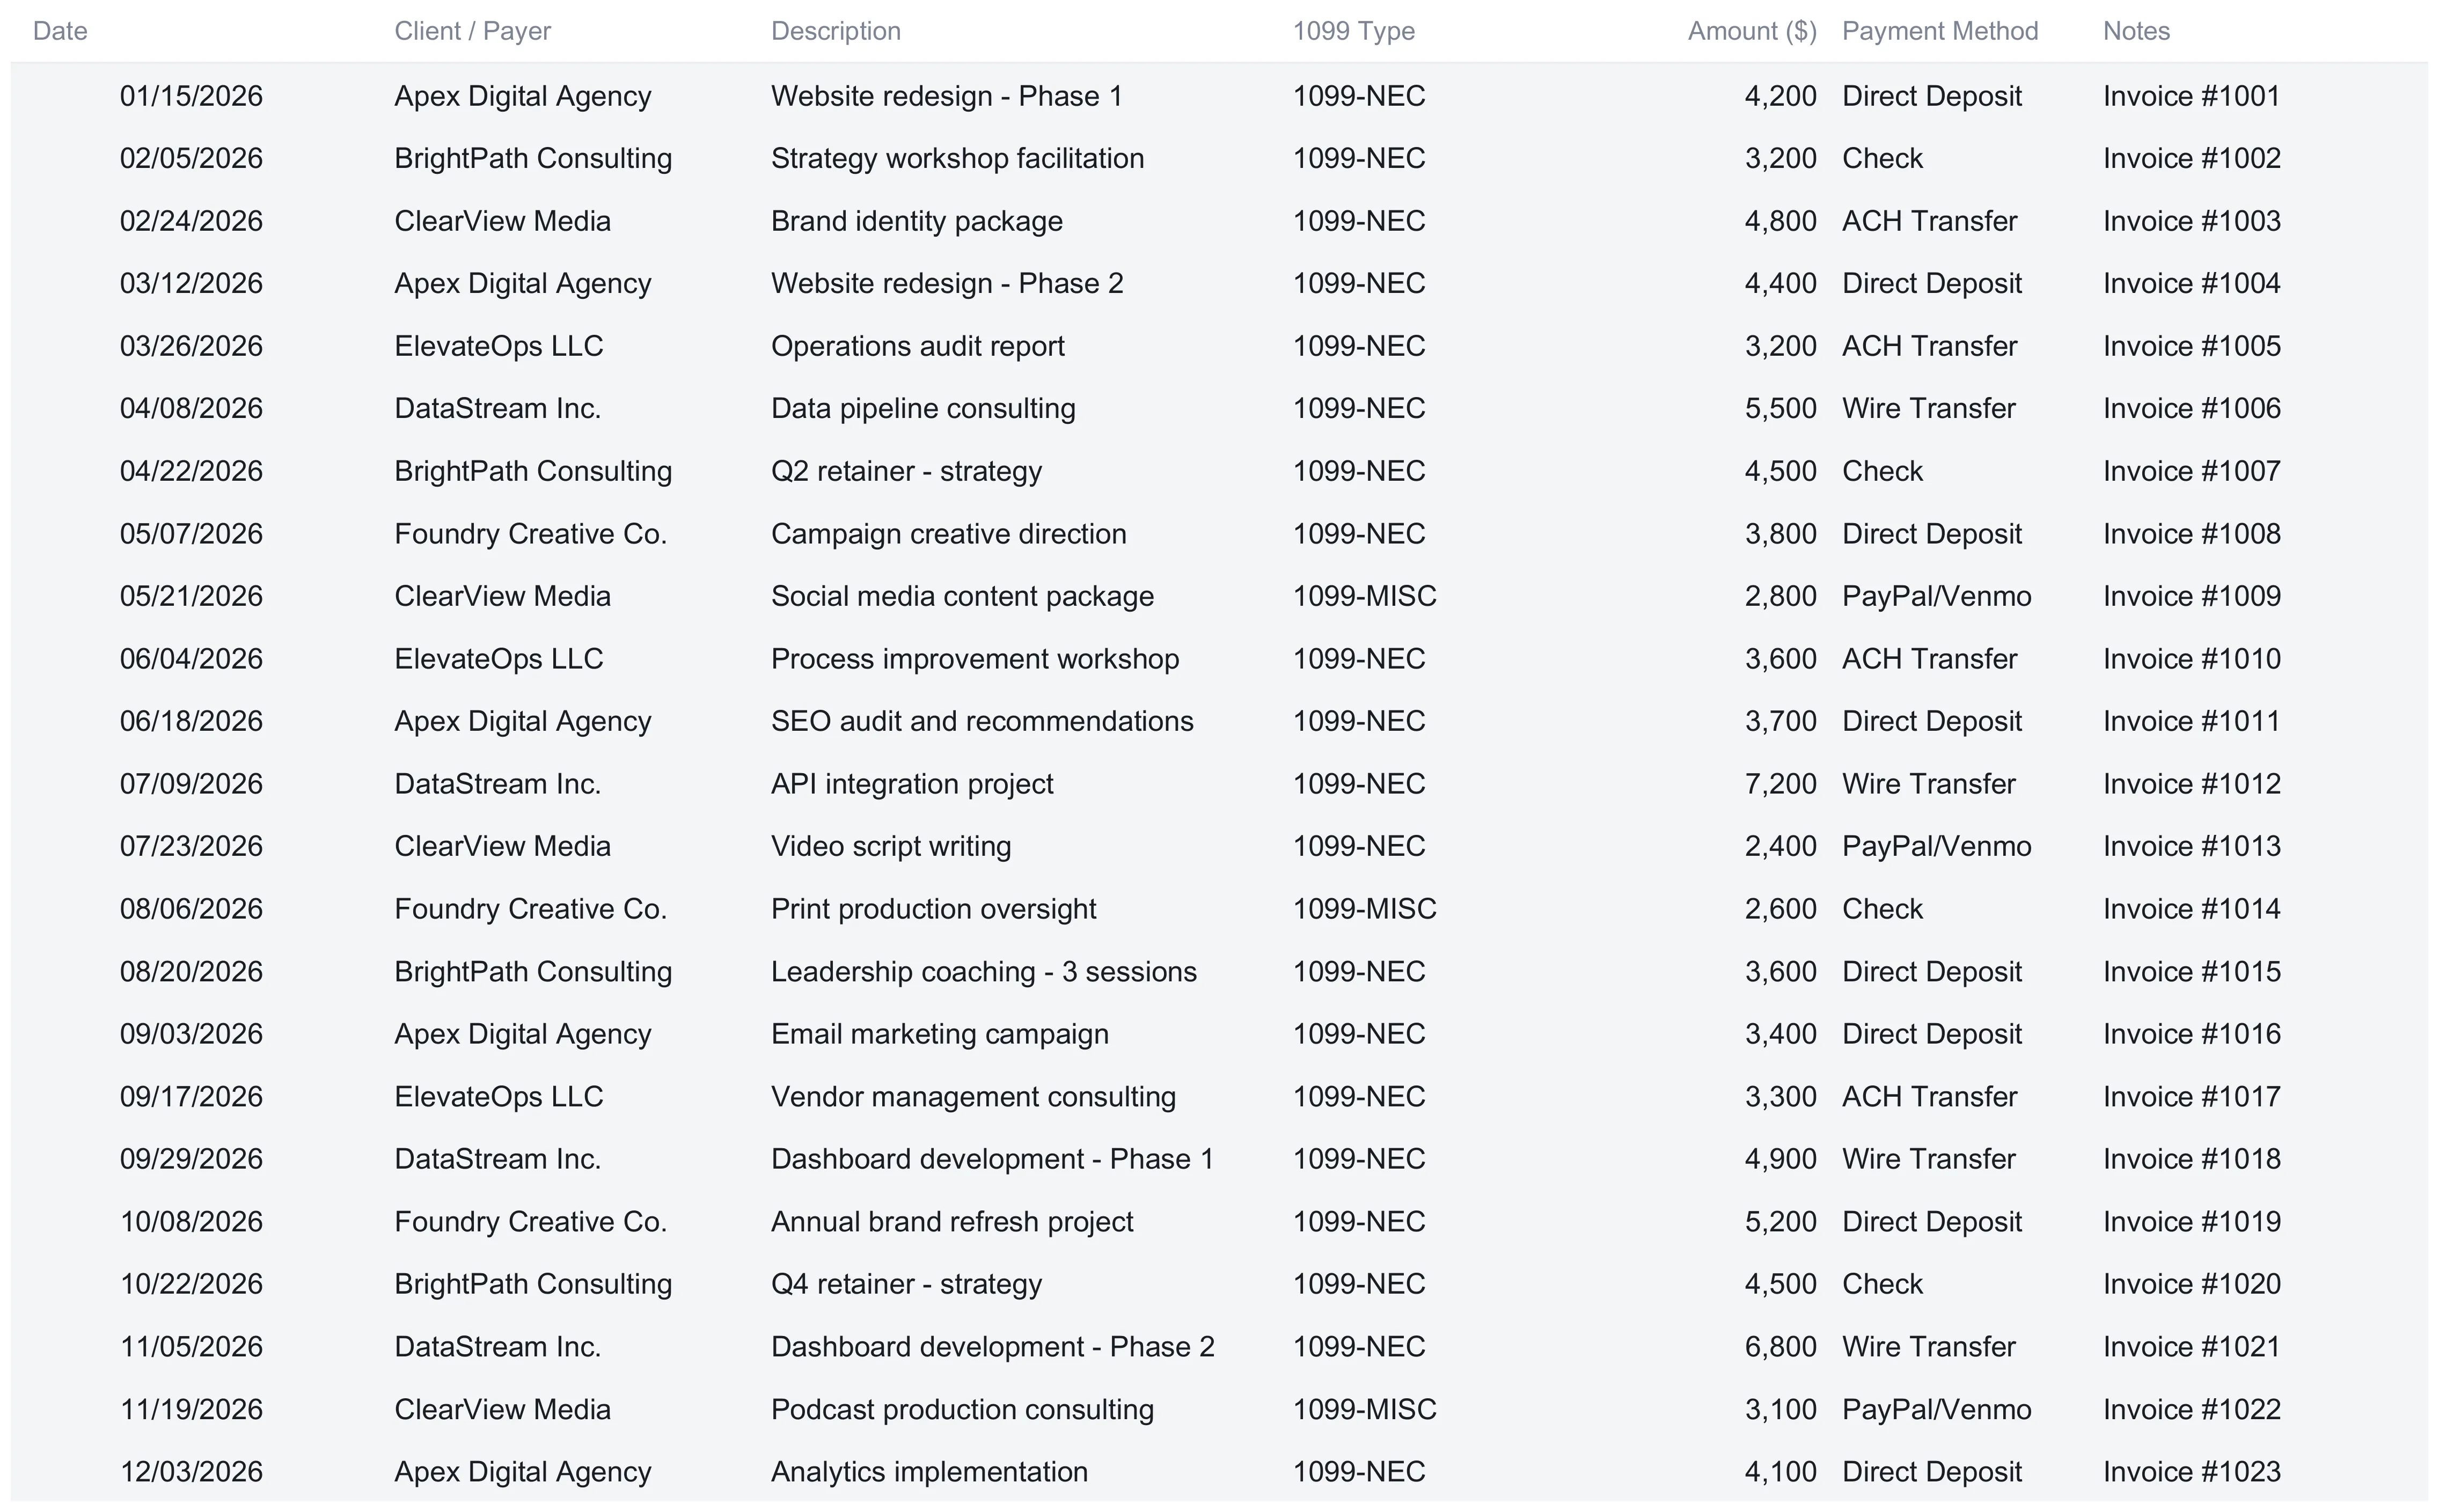
The Income Log is the ledger the whole file reads from. It holds up to 100 rows, and each row is a payment received: a date, the client or payer, a description, the 1099 type, the amount, a payment method, and a notes field. In the sample year there are 25 payments totaling $101,700, and a totals row at the bottom counts the entries and sums the amount so the figure is always live.
Five of the seven columns are yours to type; two are dropdowns that keep the data clean. The 1099 Type dropdown offers NEC for services, MISC for miscellaneous payments, K for payment platforms, INT for interest, and DIV for dividends. The sample uses NEC for most rows and MISC for a few, such as a social media content package and a print production job. The type is a label on the row for your own reference. It does not change how the amount is totaled; every row rolls into the same $101,700 whatever its form type. The Payment Method dropdown offers Direct Deposit, Check, ACH Transfer, PayPal/Venmo, Zelle, Wire Transfer, and Other. The sample uses five of them, so you can see at a glance which payments arrived through a platform.
Below the entry rows the sheet carries two things worth understanding, because everything downstream leans on them.
The reporting threshold cell. One cell holds a threshold figure, and it ships with a sample of 2,000. The note beside it is short: it is a sample figure, and you set it to the threshold that applies where and when you were paid. The Client Summary’s threshold notes carry the rest of the reasoning, that the figure differs by tax year and by country, and that payments routed through a payment platform are often reported on a different form under a threshold of their own. It is not a rule the sheet enforces on your behalf; it is an input you own.
The Income by Client block. Six payer names sit in a small block, each with a formula that sums the log for that name and counts how many payments it represents. A fourth column compares the payer total against the threshold cell and prints either “Yes - Form Expected” or “Below the threshold.” Because each subtotal reads the name in its own row, typing your own payer over one of the samples re-totals that row automatically. This block is the record of what you were paid per payer, and the Client Summary’s notes are direct that it is a record, not a statement of what any payer is required to file.
What the log does not do is fill itself. There is no connection to an invoicing tool and no payment import, so every payment is a typed row. At 25 payments a year that is a couple of minutes a month; the trade is that every formula is visible and the file lives on your machine rather than in a vendor’s cloud. This is the same manual-versus-connected trade covered in the freelancer cash flow spreadsheet walkthrough, which builds a three-sheet invoices-and-payments system by hand for the same reason.
Keep costs on their own sheet: the Expense Log
Business costs live on a separate log, also 100 rows, and the reason to keep them apart from income is that they feed a different total and a different tax line. Each row has a date, a description, a Schedule C category, an amount, a deductible percentage, a computed deductible amount, a Yes/No receipt marker, and a notes field. The sample holds 20 expenses.
The category is chosen from a dropdown of Schedule C names (Advertising, Car & Truck, Insurance, Legal & Professional, Office Expense, Rent or Lease, Supplies, Travel, Utilities, Wages, and Other), and using those exact names is what lets the Schedule C prep sheet total them correctly later. The one column that does the quiet work here is the Deductible %. The deductible amount in column F is not typed; it is the amount times that percentage. Most sample rows sit at 100 percent, but two show the shape of a partial claim: a client lunch logged under Travel at $145 is claimed at 50 percent, so $72.50 flows through, and an internet-and-phone bill of $1,200 is claimed at 75 percent for the business share, so $900 flows through. The gross spend across the 20 rows is $8,027.86, and the deductible portion the sheet carries forward is $7,655.36.
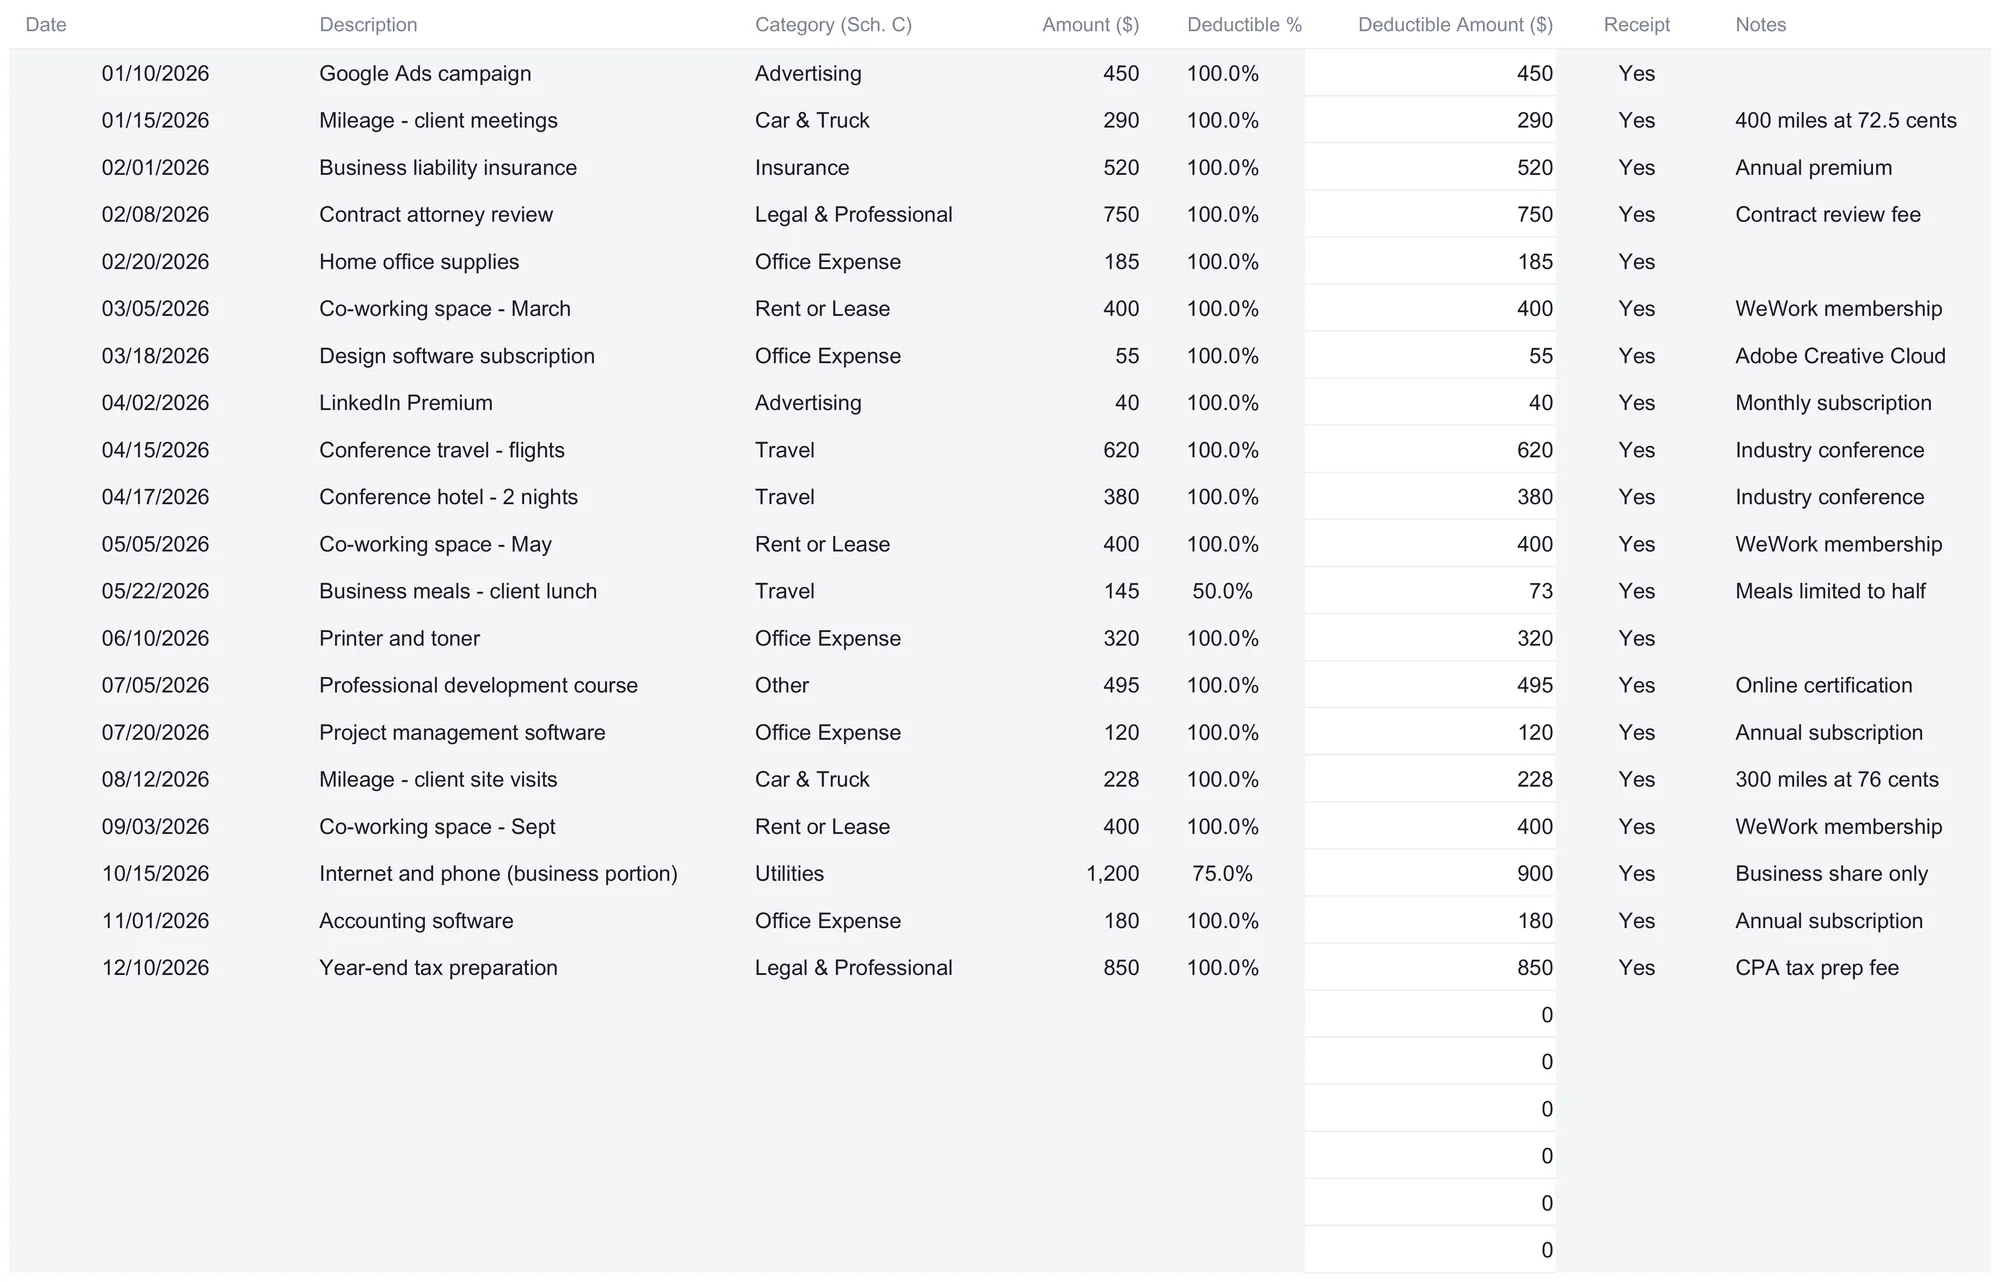
Two sample rows log mileage as a dollar figure with a note recording the miles and a per-mile amount. The sheet does not compute mileage for you; it takes the dollar amount you enter, so the note is just a reminder of how the figure was reached. Below the entry rows, a category summary sums the deductible column per Schedule C category, which is the block the prep sheet reads. In the sample that summary reads Advertising $489.99, Car & Truck $518, Insurance $520, Legal & Professional $1,600, Office Expense $859.87, Rent or Lease $1,200, Travel $1,072.50, and Utilities $900, with Other at $495 and Supplies and Wages at zero. The total deductible expenses figure of $7,655.36 matches the log total, so the two views can never quietly disagree. A separate tracker built purely around maximizing and categorizing write-offs is a job of its own; the Tax Deduction Tracker Ultimate Spreadsheet Template ($29) does exactly that, with a schedule breakdown and a tax-impact view, and pairs naturally with this one.
Read the year by payer: the Client Summary
The Client Summary carries one row per payer, and the payer names in its first column are the only cells on the sheet you type. Each row pulls that payer’s total from the Income Log by name, counts the payments, checks the total against the reporting threshold cell, and works out the payer’s share of the year.
In the sample the six payers, ordered highest first, are DataStream Inc. at $24,400 across 4 payments, Apex Digital Agency at $19,800 across 5, BrightPath Consulting at $15,800 across 4, Foundry Creative Co. at $14,800 across 4, ElevateOps LLC at $13,800 across 4, and ClearView Media at $13,100 across 4. The grand total is $101,700 across 25 payments, and the shares run from 24.0 percent down to 12.9 percent. Every payer clears the sample threshold, so each reads “Yes - Form Expected.”
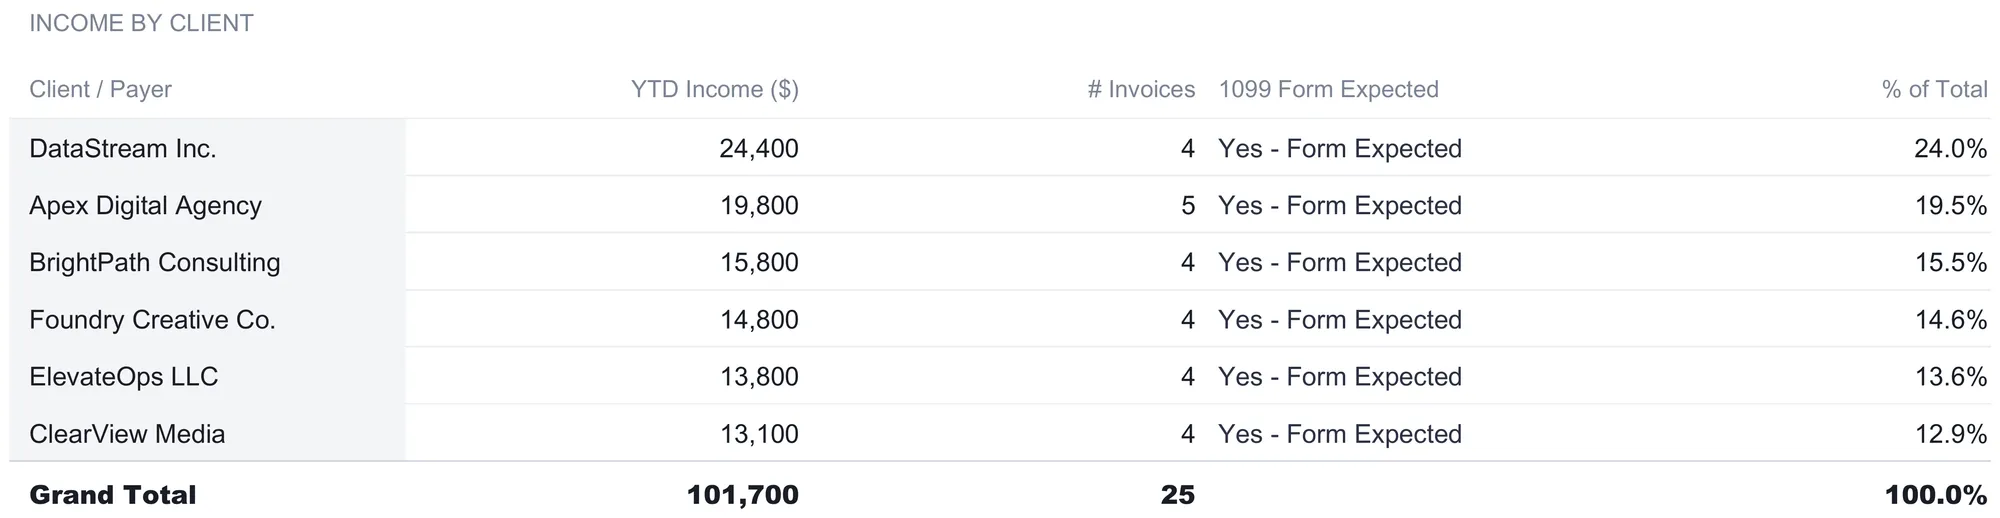
Two habits are built into this sheet. First, the rows ship highest-first from the sample, but nothing re-sorts them as your own numbers change, so the ordering is yours to maintain if it matters to you. Second, renaming a payer here also renames it on the Dashboard’s top-clients table and in the income-by-client chart, because both read these same labels. The workbook frames the sheet as a year-end reconciliation tool: it is where you check the forms that actually arrive in the mail against your own record of what each payer paid, which is a different and usually more complete list than the forms alone.
Estimate the quarters: the Quarterly Estimates sheet
This is the sheet that turns income and costs into a tax picture, and it is the one to read most carefully, because most of what it produces rests on assumptions you set rather than on anything fixed. It has four parts: the payment due dates, a Tax Assumptions block, a federal bracket table, and a quarterly breakdown.
The due dates read from a single Tax year cell. With that cell set to 2026 in the sample, the four dates compute to April 15, 2026, June 15, 2026, September 15, 2026, and January 15, 2027, which is the standard four-period schedule the IRS uses for estimated taxes. The workbook notes that a date landing on a weekend or holiday moves to the next business day, and points to IRS Form 1040-ES for determining actual payments.
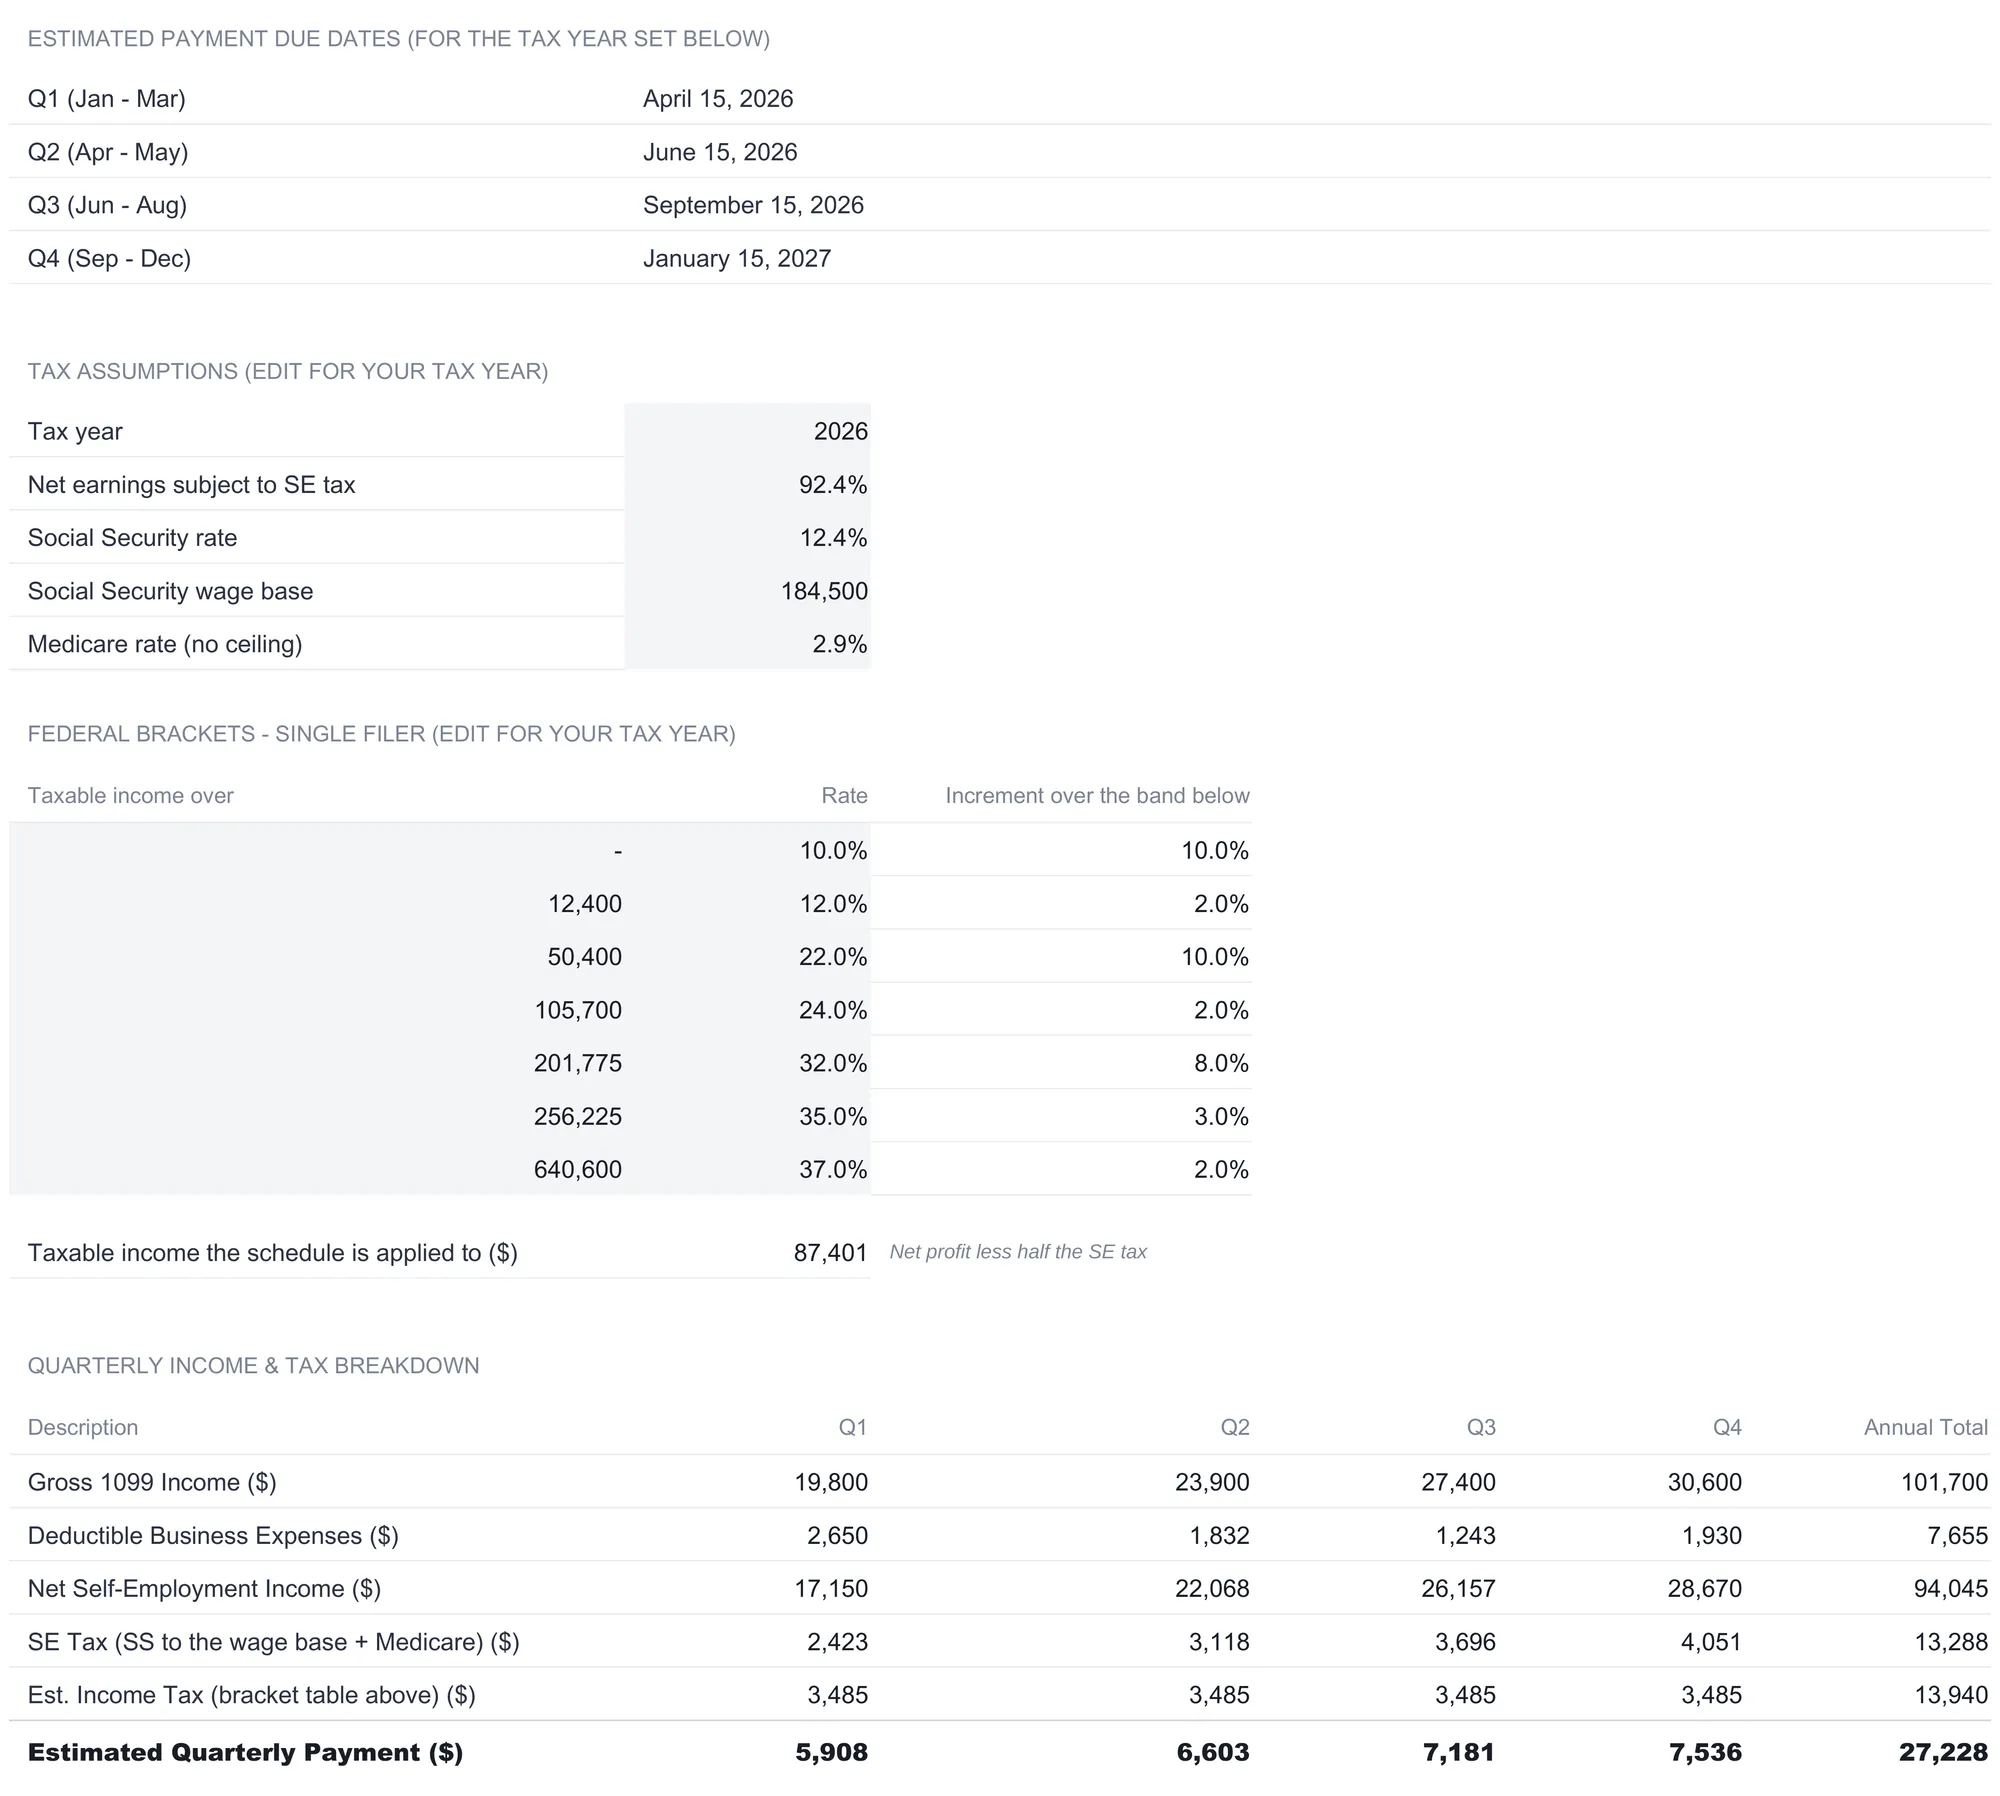
The Tax Assumptions block is the heart of the sheet, and every figure in it is editable and labeled as a sample to set for your own tax year. It ships with a net-earnings factor of 92.35 percent, a Social Security rate of 12.4 percent, a Social Security wage base of $184,500, and a Medicare rate of 2.9 percent with no ceiling. Those two rates are the structural halves of the self-employment tax, which the IRS sets at 15.3 percent overall, split into 12.4 percent for Social Security and 2.9 percent for Medicare. The wage base is the figure that changes year to year, which is exactly why the sheet leaves it in an editable cell rather than hard-coding it; the number in the sample is the workbook’s placeholder, not a claim about any particular year’s official figure, and the actual base for the year you are filing comes from the IRS.
A federal bracket table sits below, and it ships with single-filer figures. The How to Use sheet is blunt that these are wrong for other filing statuses, so a married-filing-jointly or head-of-household user replaces the whole table. The sheet applies those brackets not to the full net income but to net profit less half the self-employment tax, which is the deductible employer-equivalent portion the IRS lets self-employed people subtract, and it labels that intermediate figure “taxable income the schedule is applied to.”
The quarterly breakdown then puts it together. Income and deductible expenses are pulled from the two logs with date filters, giving, for the sample year, first-quarter income of $19,800 against $2,649.99 in expenses, second-quarter income of $23,900 against $1,832.49, third-quarter income of $27,400 against $1,242.88, and fourth-quarter income of $30,600 against $1,930. Net self-employment income for the year works out to $94,044.64. From the assumptions above, the sheet computes a self-employment tax of about $13,288, which is Social Security of roughly $10,769 up to the wage base plus Medicare of roughly $2,519. It adds an estimated income tax of about $13,940, for a total estimated payment of about $27,228 across the year. The quarter cells split unevenly, from about $5,908 in the first quarter to about $7,536 in the fourth, because the self-employment portion follows each quarter’s net while the income tax portion is split into four equal parts. The workbook explains that even split as a consequence of brackets being progressive and applying to the year as a whole.
Every one of those figures is an estimate that rests on the assumptions in the block above it, and the workbook says so directly in its notes: these are estimates only, the income tax line does not account for deductions, credits, or other income, and actual liability depends on your full situation. The sheet’s job is to give you a working number to reason with between filings; determining what you actually owe is a matter for IRS Form 1040-ES or a tax professional. For a plain-terms tour of how the 15.3 percent is built, the older self-employment tax calculator walkthrough covers the rate, the wage base, and the deductible half without the spreadsheet around it, and the quarterly estimated tax spreadsheet guide covers the safe-harbor logic behind paying as you go.
Line the numbers up for filing: the Schedule C Prep sheet
The last derived sheet is a reference formatted to mirror IRS Schedule C, Profit or Loss from Business, right down to the line numbers. Every amount on it pulls from the logs, so it follows whatever you record without any re-entry.
Part I carries gross receipts of $101,700 straight from the Income Log total, with returns and allowances and cost of goods sold shipping at zero, leaving gross income of $101,700. Part II lists the expense lines by their Schedule C numbers, each reading its category subtotal from the Expense Log: Advertising on line 8, car and truck on line 9, insurance on line 15, legal and professional on line 17, office expense on line 18, rent or lease of other business property on line 20b, supplies on line 22, travel on line 24a, wages on line 26, other expenses on line 27, and utilities on line 28. Supplies and wages read zero because no sample row uses those categories, and the lines sum to total expenses of $7,655. Tentative and net profit both land at $94,045, the figure the form carries to Schedule 1.
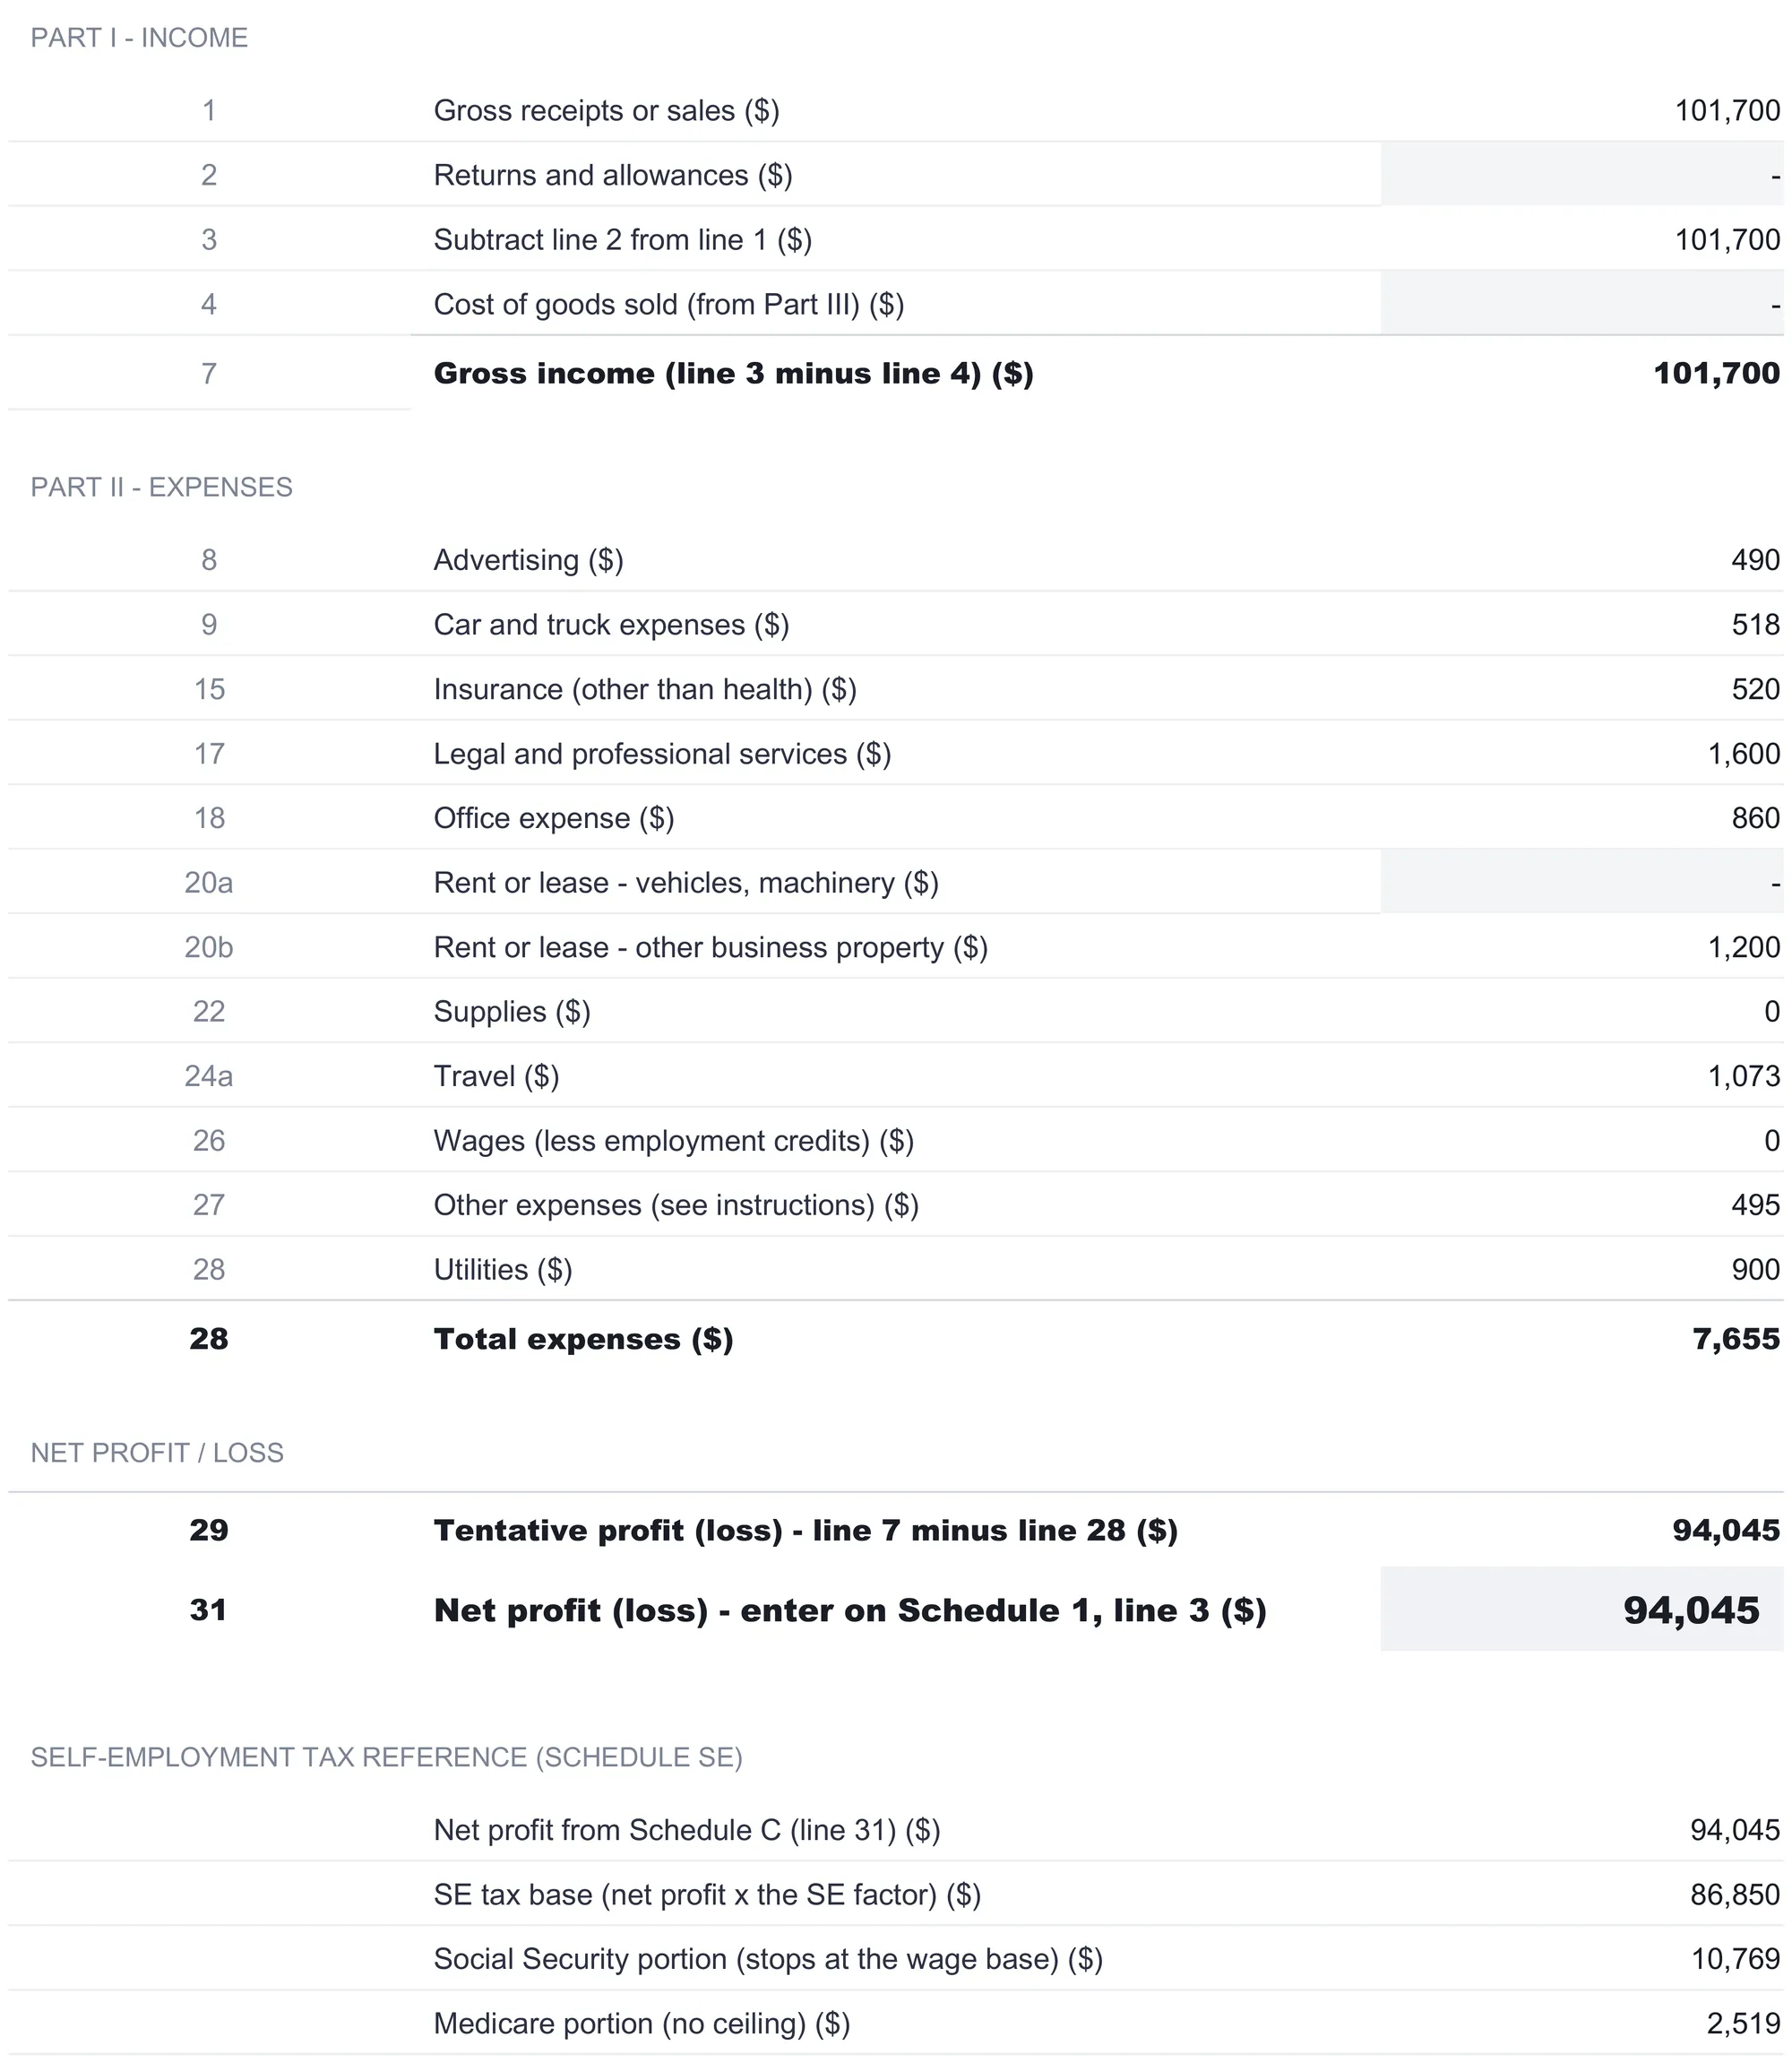
Three lines are left for you to type rather than pulled from a log: returns and allowances, cost of goods sold, and rent or lease of vehicles and machinery, all shipping at zero because a service business often has nothing to put there. Below the form, a Self-Employment Tax Reference section reproduces the Schedule SE math and reads the Quarterly Estimates sheet so the two never disagree: net profit of $94,045, a self-employment tax base of $86,850 (net profit times the net-earnings factor), a Social Security portion of $10,769, a Medicare portion of $2,519, and the resulting self-employment tax and its deductible half. The workbook is careful to call this sheet a reference tool: your actual return still requires Form 1040 and Schedule C themselves. If keeping deductions organized against Schedule C lines is the part you most want to get right, the companion piece on a tax deduction tracker in Google Sheets approaches the same categorization problem from the deduction side.
The dashboard: six numbers and the year at a glance
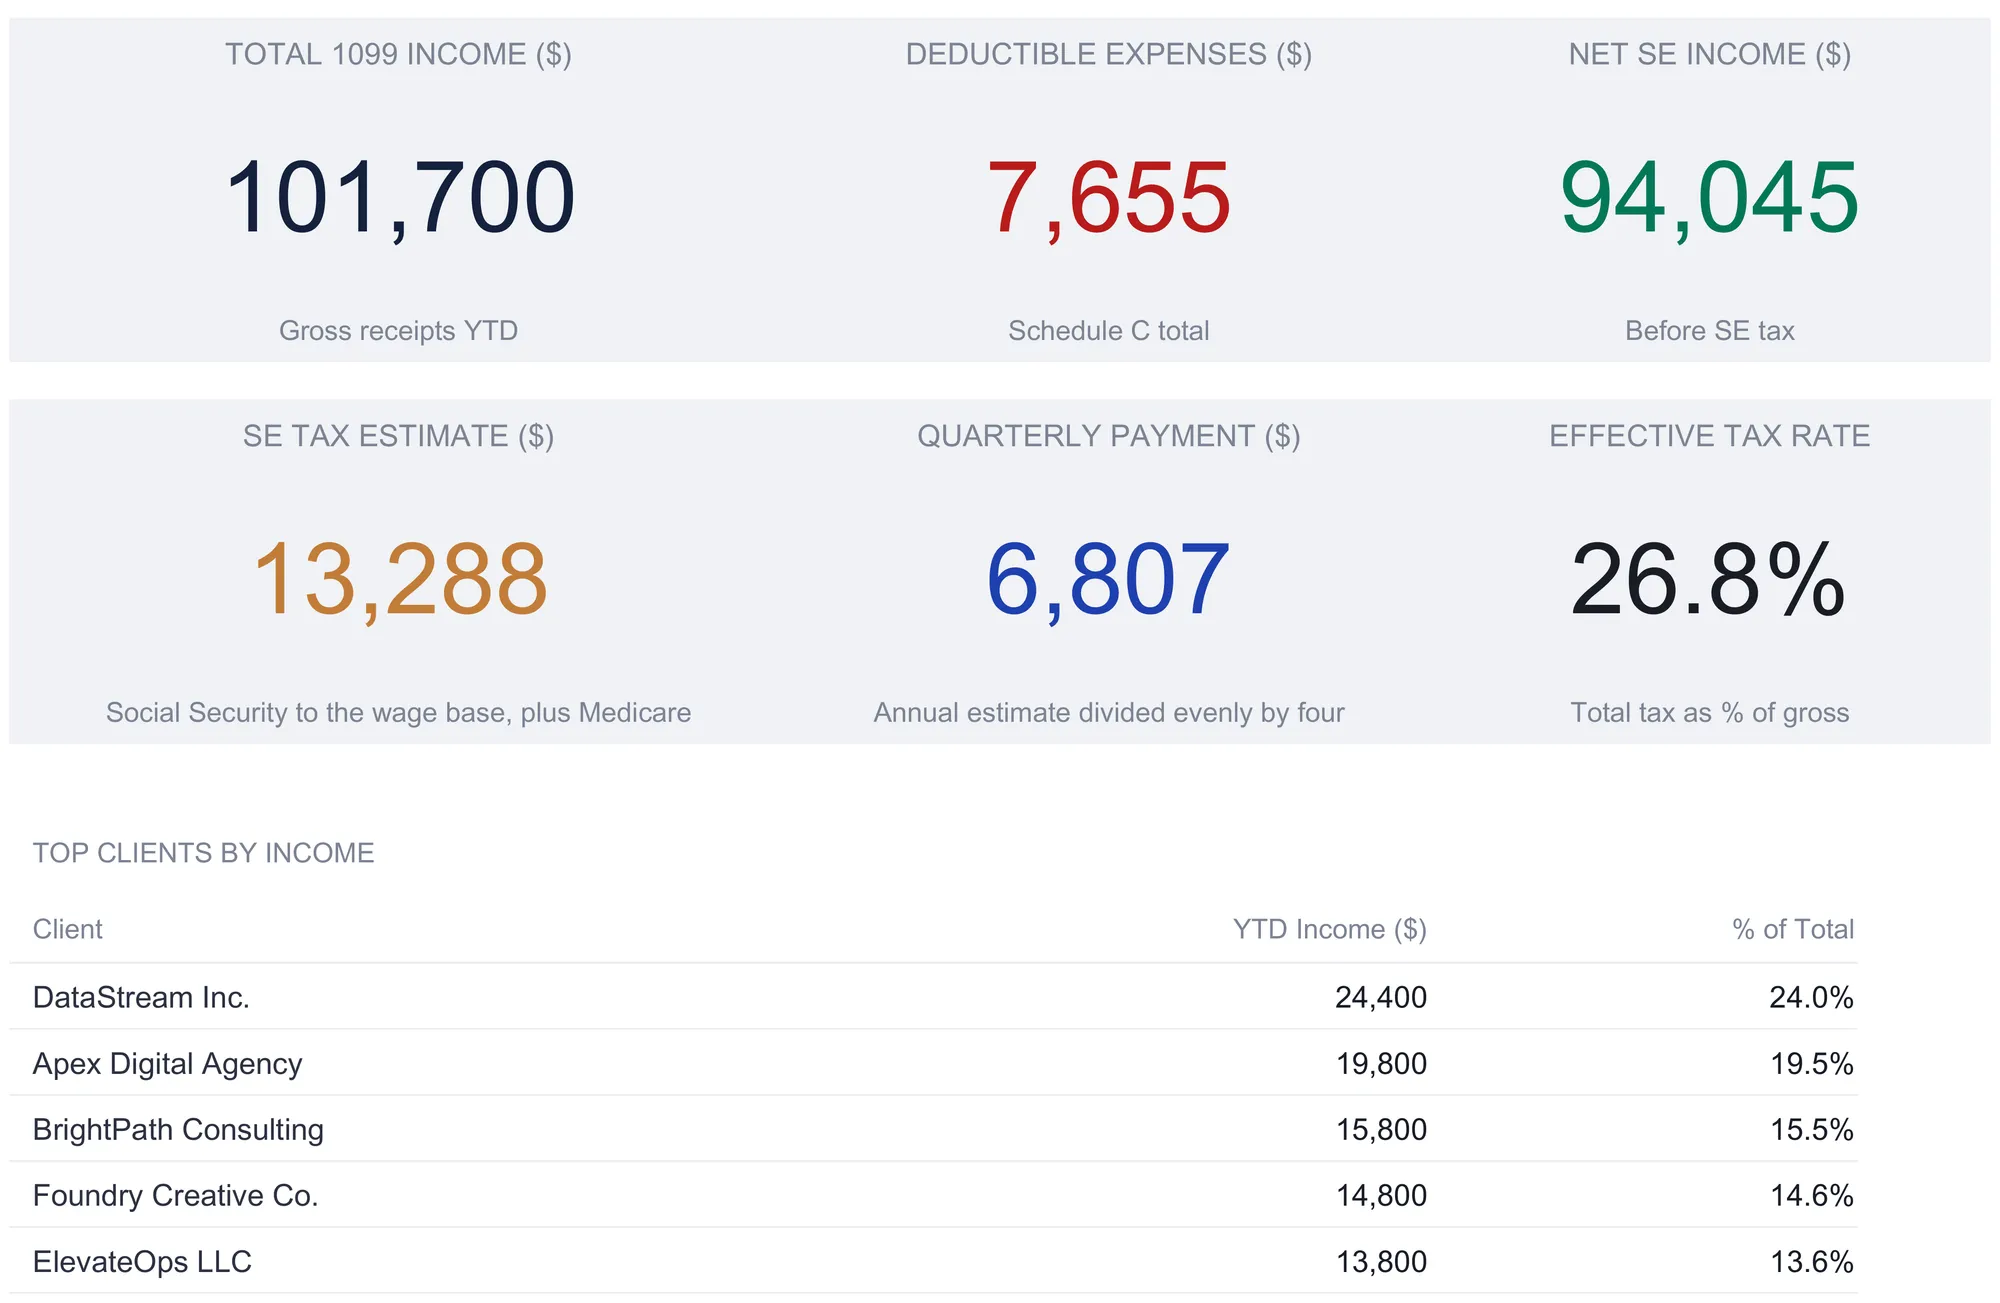
With the two logs filled, the Dashboard computes the year. Six KPI tiles sit across the top:
| Metric | Sample value | How it is derived |
|---|---|---|
| Total 1099 income | $101,700 | Sum of every payment on the Income Log |
| Deductible expenses | $7,655 | Total deductible from the Expense Log |
| Net SE income | $94,045 | Income minus deductible expenses |
| SE tax estimate | $13,288 | Social Security to the wage base plus Medicare |
| Quarterly payment | $6,807 | Total estimated tax divided evenly by four |
| Effective tax rate | 26.8% | Total estimated tax as a percentage of gross income |
The quarterly-payment tile takes the total estimated tax of about $27,228 and divides it into four even parts of about $6,807, which is a simpler view than the uneven per-quarter figures on the Quarterly Estimates sheet; the two answer slightly different questions, one a flat set-aside and the other a quarter-by-quarter estimate. The effective tax rate of 26.8 percent is the total estimated tax measured against gross income. It shows roughly how much of every dollar received is spoken for before it is spendable. Like every tax figure here, though, it is the product of the sheet’s own sample assumptions rather than a statement about your liability.
Below the tiles, a top-clients table repeats the payer ranking from the Client Summary, and two column charts follow it, one ranking income by client and one plotting quarterly income against deductible expenses so the seasonal climb in the sample, from $19,800 of first-quarter income to $30,600 in the fourth, is visible at a glance rather than buried in the log. The currency selector next to the title drives the labels on all of it: choosing one of its 35 symbols relabels every money column and KPI across the workbook, though it only changes the label and does not convert any of the underlying numbers.
Excel or Google Sheets for a 1099 income tracker
The tracker is an .xlsx file built on plain formulas, with no macros, VBA, or add-ins, so it runs the same way in Microsoft Excel, Google Sheets, and LibreOffice Calc. The workbook notes only that the SUMIFS formulas behind the quarterly split need Excel 2007 or later, which any current version clears comfortably. Google Sheets suits a contractor who wants to log a payment from a phone the day it clears; Excel suits one who prefers a local file. The structure described here builds identically in either, and the tinted input cells make it clear which cells are yours to fill and which hold formulas that warn before being overwritten.
Which tracker fits which contractor
- 1099 Income Tracker Ultimate Spreadsheet Template ($29) is the workbook this walkthrough follows: the income log, the Schedule C expense log, income by client, the quarterly estimate, the Schedule C prep sheet, and the six-tile dashboard, ready for a single filer to adapt.
- The free 1099 Income Tracker fits contractors who want a plain payment log and nothing more for now, and the Essentials version ($19) sits between the two on features.
- Tax Deduction Tracker Ultimate Spreadsheet Template ($29) points the other way, at the deduction side: it tracks up to 150 deductions with a schedule breakdown, quarterly summaries, and a tax-impact calculator, which is the natural companion for anyone whose costs are the harder half of the picture.
The broader question of running a whole freelance operation from one file, with projects, invoices, a tax reserve, and a runway figure, is its own build, covered in the how to manage freelance finances in a spreadsheet walkthrough. This tracker is the narrower, tax-shaped slice of that: what came in, what was deductible, and what the quarters look like.
Related
- Self-Employment Tax Calculator for Freelancers - the 15.3 percent rate, the wage base, and the deductible half, without the spreadsheet around it
- Quarterly Estimated Tax Spreadsheet - the pay-as-you-go rhythm and safe-harbor logic behind the quarterly numbers
- How to Manage Freelance Finances in a Spreadsheet - the wider workbook with projects, invoices, and a tax reserve
- 25 Self-Employed Tax Deductions for 2026 - what actually belongs in the expense log’s Schedule C categories
Frequently asked questions
What is the difference between 1099-NEC and 1099-MISC on the Income Log?
They are two of the form types in the 1099 Type dropdown, which also offers K, INT, and DIV. In broad terms, 1099-NEC reports nonemployee compensation for services, 1099-MISC covers other miscellaneous payments, 1099-K is what payment platforms issue, and INT and DIV cover interest and dividends. The tracker treats the type as a label on each row for your own reference; it totals every row the same way regardless of type. Which form a given payment belongs on is a question for the payer and, if you are unsure, a tax professional.
How does the sheet decide a client should send a 1099 form?
The Income by Client block and the Client Summary compare each payer's total against a single reporting threshold cell on the Income Log, which ships with a sample figure of 2,000. Any payer at or above it reads "Yes - Form Expected" and any payer below reads "Below the threshold." The workbook's own note is explicit that this cell is a sample and that the real threshold differs by tax year and by country, and that payments routed through a platform are often reported on a different form under a threshold of their own. The column is a record of what you were paid, not a statement of what any payer is required to file.
Are the quarterly tax numbers what I will actually owe?
No. The Quarterly Estimates sheet runs on assumptions you set yourself in its Tax Assumptions block: a net-earnings factor, a Social Security rate and wage base, a Medicare rate, and a single-filer bracket table that the sheet flags as wrong for other filing statuses. The workbook states plainly that the figures are estimates only and that actual liability depends on your full tax situation. It points to IRS Form 1040-ES or a tax professional to determine actual payments, and that is the right way to settle the real number.
Can one file track more than one currency?
No. The Dashboard holds a single currency dropdown of 35 symbols next to the title, and choosing one relabels every money column header and KPI across the workbook. It changes the label only and does not convert any of the underlying numbers, so the tracker runs in one currency per file.
Does the tracker connect to my bank or payment apps?
No. There is no bank feed and no import from any invoicing or payment tool. Every payment and every expense is typed into its log, and the summaries, the Schedule C prep sheet, and the dashboard all read from those rows. That is the trade a spreadsheet makes: no automation, but every formula is visible and editable and the file stays on your own machine.
Sources
- Self-employment tax (Social Security and Medicare taxes) - Internal Revenue Service
- Estimated taxes - Internal Revenue Service
About this article
Template sheets, inputs, formulas and sample figures checked on 2026-09-10 against the shipped 1099 Income Tracker Ultimate workbook (Dashboard, Income Log, Expense Log, Client Summary, Quarterly Estimates, Schedule C Prep, How to Use). Self-employment tax structure and estimated-tax references checked against the live IRS self-employment tax and estimated taxes pages at writing time. Last reviewed September 2026.