
A tax deduction tracker in Google Sheets is a spreadsheet with one row per deductible expense, columns for date, category, amount, payee, and receipt link, and categories that mirror IRS Schedule A so year-end totals roll straight into your return. The number that decides everything is whether those totals beat the 2026 standard deduction ($16,100 single, $32,200 married filing jointly); below it, itemizing does not help. This guide maps each Schedule A category to a row and shows the comparison formula.
Most people only think about deductions in March. By then you’re rummaging through a year of bank statements, trying to remember whether that $184 Best Buy charge was a work monitor or a birthday gift for your brother. A tax deduction tracker in Google Sheets fixes that by turning a once-a-year scramble into ten minutes a week.
This guide walks through the exact columns a working deduction tracker needs, how the categories map to IRS Schedule A, and why the threshold math (itemized vs. the 2026 standard deduction) matters more than the raw deduction total. If you want to skip straight to a working template, our Annual Tax Planner logs deductions by category, totals each category on its dashboard, and multiplies the combined total by a deduction tax benefit rate you set, so you see roughly what those deductions take off the bill.
What a tax deduction tracker needs to do
A good deduction tracker records each eligible expense as it happens, categorizes it in a way the IRS accepts, and totals each category so you can decide whether to itemize or take the standard deduction. Everything else is polish.
You want three behaviors built in:
- Single-entry logging. One row, one expense. No double booking across sheets.
- Category totals that update automatically. The year-to-date total for medical, charitable, state tax, and so on should always be current.
- A live comparison against the standard deduction. If your category totals don’t beat the 2026 standard deduction of $16,100 single or $32,200 married filing jointly, itemizing won’t help and you can stop worrying about receipts.
That last piece is the one most templates miss. Logging every eligible expense is wasted effort if you’re going to take the standard deduction anyway, and you won’t know that until your categories are tracked.
The seven columns every row needs
Here’s a minimal, working schema. The Annual Tax Planner’s Deductions sheet is a shorter version of it: category, description, amount, date and a receipt/notes column, with no separate subcategory or payee field.
| Column | Example value | Why it matters |
|---|---|---|
| Date | 2026-03-14 | Establishes tax year and ordering |
| Category | Medical | Maps to Schedule A line |
| Subcategory | Prescription | Supports audit trail inside a category |
| Description | CVS, metformin | Plain language for future you |
| Amount (USD) | 42.30 | The number that matters |
| Payee | CVS Pharmacy | Matches bank statement |
| Receipt link | gdrive.com/… | Photo or PDF in Drive |
Seven columns. That’s it. Anyone who sells you a 40-column deduction tracker is solving the wrong problem.
Schedule A categories mapped to rows
IRS Schedule A has six sections in 2026. Here’s how each maps to a spreadsheet category dropdown.
Medical and dental expenses (Line 1 through 4)
Only the portion above 7.5 percent of your adjusted gross income counts. For someone with an AGI of $80,000, that’s a $6,000 floor. Anything logged below that total is padding.
Typical rows: out-of-pocket doctor visits, prescription drugs, dental work, eyeglasses, mileage to medical appointments (20.5 cents per mile for the first half of 2026, 23.5 cents for the second half), long-term care premiums up to the age-based limit.
Taxes you paid (Line 5 through 7)
The SALT (state and local tax) deduction is capped at $40,400 combined for 2026 ($20,200 married filing separately), up from the old $10,000 limit after the 2025 tax law raised it. The cap phases down for very high incomes but never below $10,000. It covers state income tax or general sales tax, real estate tax, and personal property tax on vehicles.
One row per property tax bill, one per quarterly state estimate, one per annual vehicle registration where applicable.
Interest you paid (Line 8 through 10)
Primarily mortgage interest from Form 1098 and investment interest. Each Form 1098 becomes one row at year end. Don’t forget points paid at closing if you bought or refinanced a primary residence.
Gifts to charity (Line 11 through 14)
Cash gifts go on one line; non-cash on another; carryover from a prior year on a third. Track each donation at the time you give it, not in December when you’re reconstructing. Non-cash gifts over $500 need Form 8283.
Typical rows: weekly tithe, one-off disaster relief, Goodwill drop-offs with itemized lists, donor-advised fund contributions.
Casualty and theft losses (Line 15)
Only federally declared disaster areas qualify. Most years, most filers have zero in this category. Leave the row schema in place; it costs nothing.
Other itemized deductions (Line 16)
Narrow category. Gambling losses up to winnings, certain unrecovered pension investments, casualty losses from a federally declared disaster that weren’t fully covered by insurance. If you’re entering rows here regularly, you likely need a tax professional, not a spreadsheet.
The formula that does the real work
The single most useful cell in a deduction tracker is the one comparing your itemized total to the standard deduction. In Google Sheets it looks like this:
=IF(SUMIF(Category, "<>", Amount) > 32200, "Itemize", "Standard")That’s for married filing jointly in 2026. For single filers, swap 32200 for 16100. For head of household, use 24150.
The logic is simple: if your total deductions beat the standard, itemize. If not, take the standard and stop logging. This one cell tells you whether the spreadsheet is worth your time this year.
One caveat: this raw sum overstates the itemizable total, because medical only counts above the 7.5 percent AGI floor and SALT is capped. Enter each category’s already-allowed amount (post-floor, post-cap) if you want the comparison to be apples to apples. The Annual Tax Planner totals each category on its dashboard and multiplies the combined deduction total by a benefit rate you set, so you get an approximate tax value alongside the raw spend.
A worked example
Sarah is married filing jointly, AGI $120,000. Here are her 2026 category totals logged by category in the spreadsheet.
| Category | Raw total | Allowed | Notes |
|---|---|---|---|
| Medical | $11,400 | $2,400 | 7.5 percent AGI floor = $9,000 |
| SALT (state income + property + vehicle) | $13,200 | $13,200 | Under the $40,400 SALT cap |
| Mortgage interest | $8,400 | $8,400 | Full amount |
| Charitable cash | $6,000 | $6,000 | Under 60 percent AGI limit |
| Charitable non-cash | $900 | $900 | Form 8283 not required |
| Casualty | $0 | $0 | No qualifying event |
| Total itemized (allowed) | $30,900 |
$30,900 is below the $32,200 standard deduction for MFJ. Sarah takes the standard and doesn’t itemize this year. Without the tracker, she’d have spent three weekends in March pulling receipts to arrive at the same conclusion.
The spreadsheet turned a losing itemization bet into a 30-second decision. One approach some filers use here is “bunching”: concentrating charitable giving into alternating years so the itemized total clears the threshold in the years they give, and taking the standard deduction in between.
Where the tracker lives in the Annual Tax Planner
The Annual Tax Planner is a seven-sheet workbook. Three of those sheets carry the deduction work:
- Deductions. The row-by-row entry sheet, with a category dropdown, a description, an amount, a date, and a receipt/notes column.
- Dashboard. Totals each deduction category with SUMIF, then multiplies the combined total by a deduction tax benefit rate you set, so you see an approximate dollar value alongside the tax due on your income.
- Quarterly. Four rows, one per quarter, with the estimated-payment due dates already filled in and columns for estimated income, estimated tax and the amount paid. The paid total feeds the dashboard’s total-paid figure.
The remaining sheets are an income log, a documents checklist, an exchange-rate table for foreign income, and instructions.
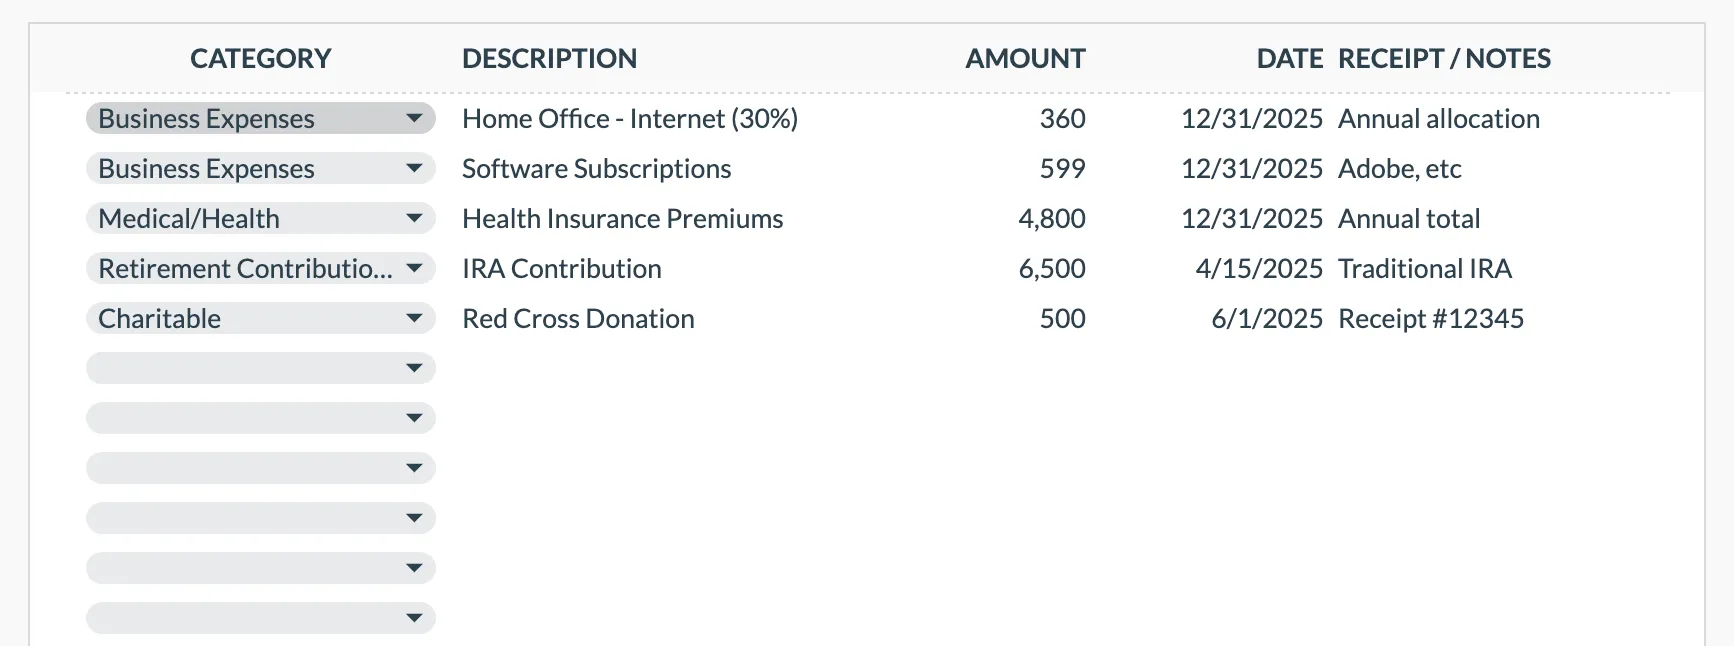 The Annual Tax Planner’s Deductions sheet (Premium tier): one row per expense, with the category set from a dropdown.
You can set up the log manually using the schema above, or buy the template for $29 and skip the setup. Its dropdown ships with eight categories (business expenses, medical/health, retirement contributions, charitable, education, housing/mortgage, insurance, other), and that list sits on the dashboard, so you can rename the rows to the Schedule A lines you actually file.
What to add after a year of tracking
Three things that turn out to matter more than they first appear.
A notes column on each row for “why I think this qualifies”. By October you’ve forgotten whether the $340 Airbnb was the business trip or the family weekend. A one-line note at entry saves hours at filing.
A “pending docs” flag. Some deductions (donor-advised fund contributions, medical reimbursements pending from an HSA) don’t resolve until weeks after the spend. A flag column keeps you from double-counting.
A year-over-year comparison column on the dashboard. Your charitable giving history matters for bunching strategy. Your medical spending pattern matters for deciding whether to elect an HSA next year. Once you’ve tracked two years, the comparison is the most useful number on the page.
How to start if you don’t have a template yet
- Open a blank Google Sheet.
- Paste the seven column headers from the schema above.
- Add a Data Validation dropdown on the Category column with the six Schedule A lines.
- In a summary cell above row 1, write
=SUMIF(B:B, "Medical", E:E)and clone it for each category. - In another cell, write the IF comparison against the standard deduction.
- Start logging.
Thirty minutes of setup. Eight or nine minutes a week of entry during the year. Zero scrambling in March.
If you’d rather not build from scratch, the Annual Tax Planner is $29, with the Deductions sheet, a dashboard that totals each category and applies a deduction tax benefit rate to the combined total, a documents checklist, and a quarterly payments sheet. It ships in both Google Sheets and Excel.
If your deductions are mostly business ones, the income tax calculator guide shows how a deduction lowers the bill at your marginal rate, the self-employment tax calculator walks through the numbers behind quarterly estimates, and if you’re weighing where to build this, our tax-planning comparison covers Google Sheets versus Excel.
Related
- Annual Tax Planner ($29) - Deduction log, category dashboard, and quarterly payments in one workbook.
- Tax Deduction Tracker Ultimate ($29) - Adds a schedule breakdown and a tax-impact calculator that estimates savings by bracket.
- Income Tax Calculator: Understanding Your Tax Bill - How deductions and brackets combine into what you owe.
- Google Sheets vs Excel for Tax Planning - Which tool fits a year-round tax spreadsheet.
Frequently asked questions
Does a deduction tracker replace tax software?
No. It replaces the shoebox. Your tax software still needs the final numbers, but pulling a single category total from a spreadsheet is much faster than reconstructing from bank statements in March.
Do I need a separate tracker for business expenses?
Yes. Business expenses go on Schedule C or Schedule E and use a different category list (rent, advertising, meals, supplies, vehicle, home office, etc.). A single spreadsheet can hold both with a "tax context" column that tags each row as personal or business.
What if I take the standard deduction every year?
You can skip the tracker. Some people still keep a light log because a changed situation (home purchase, large medical year, significant charitable gift) can push them over the threshold in a year they did not expect. Running it year-round takes about ten minutes a week.
Do I log the full medical bill or only the deductible portion?
Log the full amount as you spend it, then apply the 7.5 percent AGI floor once at year end. Only the total above 7.5 percent of your adjusted gross income counts, so a single large medical row rarely changes anything until the category total crosses that floor.
Is the SALT cap per person or per return?
Per return. The state and local tax deduction is capped at $40,400 combined for 2026 ($20,200 married filing separately), not per taxpayer, and it phases down for very high incomes though never below $10,000.
Can the tracker calculate the actual tax savings from each deduction?
Yes, roughly. Multiply your marginal tax bracket (22 percent, 24 percent, 32 percent) by the deduction amount. The Annual Tax Planner does a simplified version of this on the dashboard: it multiplies your combined deduction total by a benefit rate you set, then subtracts the result from the gross tax figure.
Is my data private if I use Google Sheets?
The file lives in your own Google Drive. FinancialAha and no other third party has access. For people uncomfortable with cloud storage entirely, the template also opens in Excel, and you can keep it local.
Sources
- Rev. Proc. 2025-32: Tax Year 2026 Inflation Adjustments - Internal Revenue Service
- Topic No. 502, Medical and Dental Expenses - Internal Revenue Service
- Topic No. 503, Deductible Taxes - Internal Revenue Service
- Standard Mileage Rates - Internal Revenue Service
- About Schedule A (Form 1040), Itemized Deductions - Internal Revenue Service
About this article
Standard deduction, medical floor, SALT cap, and mileage figures checked against IRS Rev. Proc. 2025-32 and IRS tax topics 502 and 503. Annual Tax Planner sheets, inputs and outputs checked on 2026-09-10 against the shipped workbook (Dashboard, Income, Deductions, Quarterly, Documents Checklist, Exchange Rates, Instructions). Last reviewed September 2026.