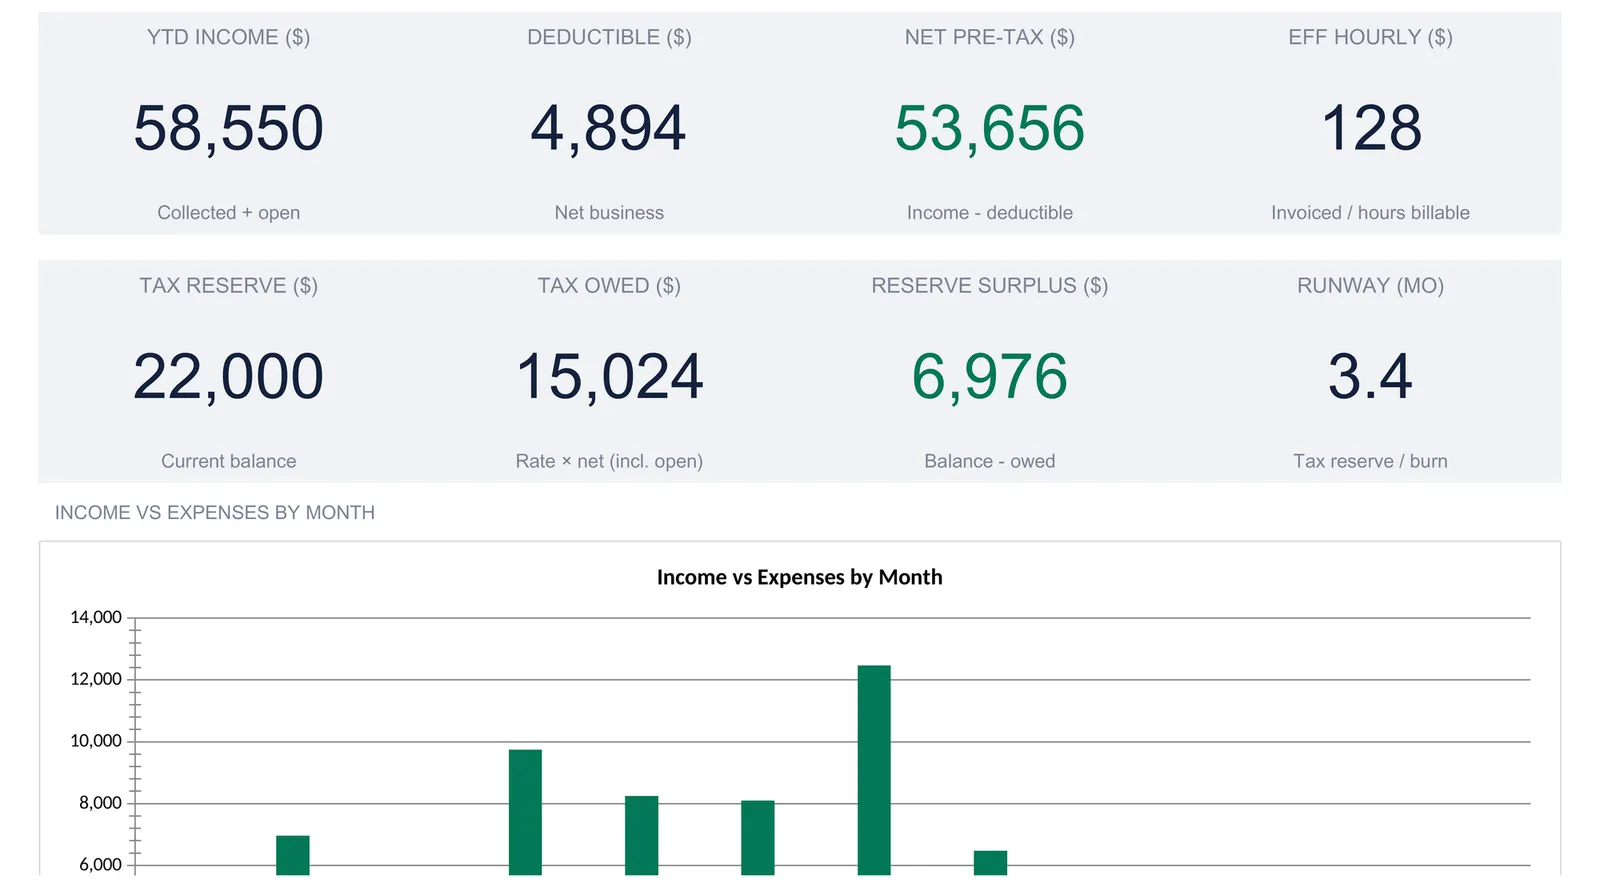
A freelancer finance suite pulls project revenue, client invoices, deductible expenses, and a tax reserve into one workbook, then derives a dashboard from them: YTD income, net before tax, effective hourly, tax owed, reserve surplus, and runway. This walkthrough follows the whole structure with a worked example, a studio with $58,550 invoiced, $4,894 deductible, $53,656 net before tax, and a $6,976 reserve surplus. Our Freelancer Finance Suite ($39) ships it ready-made for Excel and Google Sheets.
Freelance income arrives in bursts, and the paperwork behind it arrives in three separate streams that never quite line up. There is the work itself, measured in hours and rates. There are the invoices, which go out on their own schedule and get paid on someone else’s. And there are the costs, some of them fully for the business and some of them only partly. On top of all that sits a fourth question most people would rather not think about until spring: how much of this money is not actually yours because it is owed in tax. A single freelancer finance suite keeps those four streams in one file and lets the answers fall out of them.
The examples below come from our Freelancer Finance Suite Spreadsheet Template ($39), which ships the whole structure ready-made for Excel and Google Sheets. The layout is reproducible by hand if you would rather build your own; what matters is how the pieces connect.
What a freelancer finance suite has to hold
Behind the dashboard there are only a handful of kinds of data, each on its own sheet:
- Constants. The business name, the currency, the fiscal year, the tax setaside rate, the current reserve balance, and a monthly personal burn figure. These live on Settings and drive everything downstream.
- Project records. What each engagement earned: rate, hours logged, hours billable, status, and the revenue that follows.
- Client invoices. What was billed and when it was paid, which separates money collected from money still owed to you.
- Business expenses. Each cost, its category, and the business-use share the sheet uses to compute a deductible portion.
- A tax reserve. The setaside target implied by income and expenses, checked against what has been put aside.
- Derived metrics. The dashboard’s eight tiles and two charts. Nothing here is typed; it is all calculation.
The workbook gives each of these its own sheet (Settings, Projects, Income, Expenses, and Tax Reserve) with a Dashboard on top and a How to Use sheet carrying the instructions. Following the order the How to Use sheet lays out, the constants come first.
Start with the constants: the Settings sheet
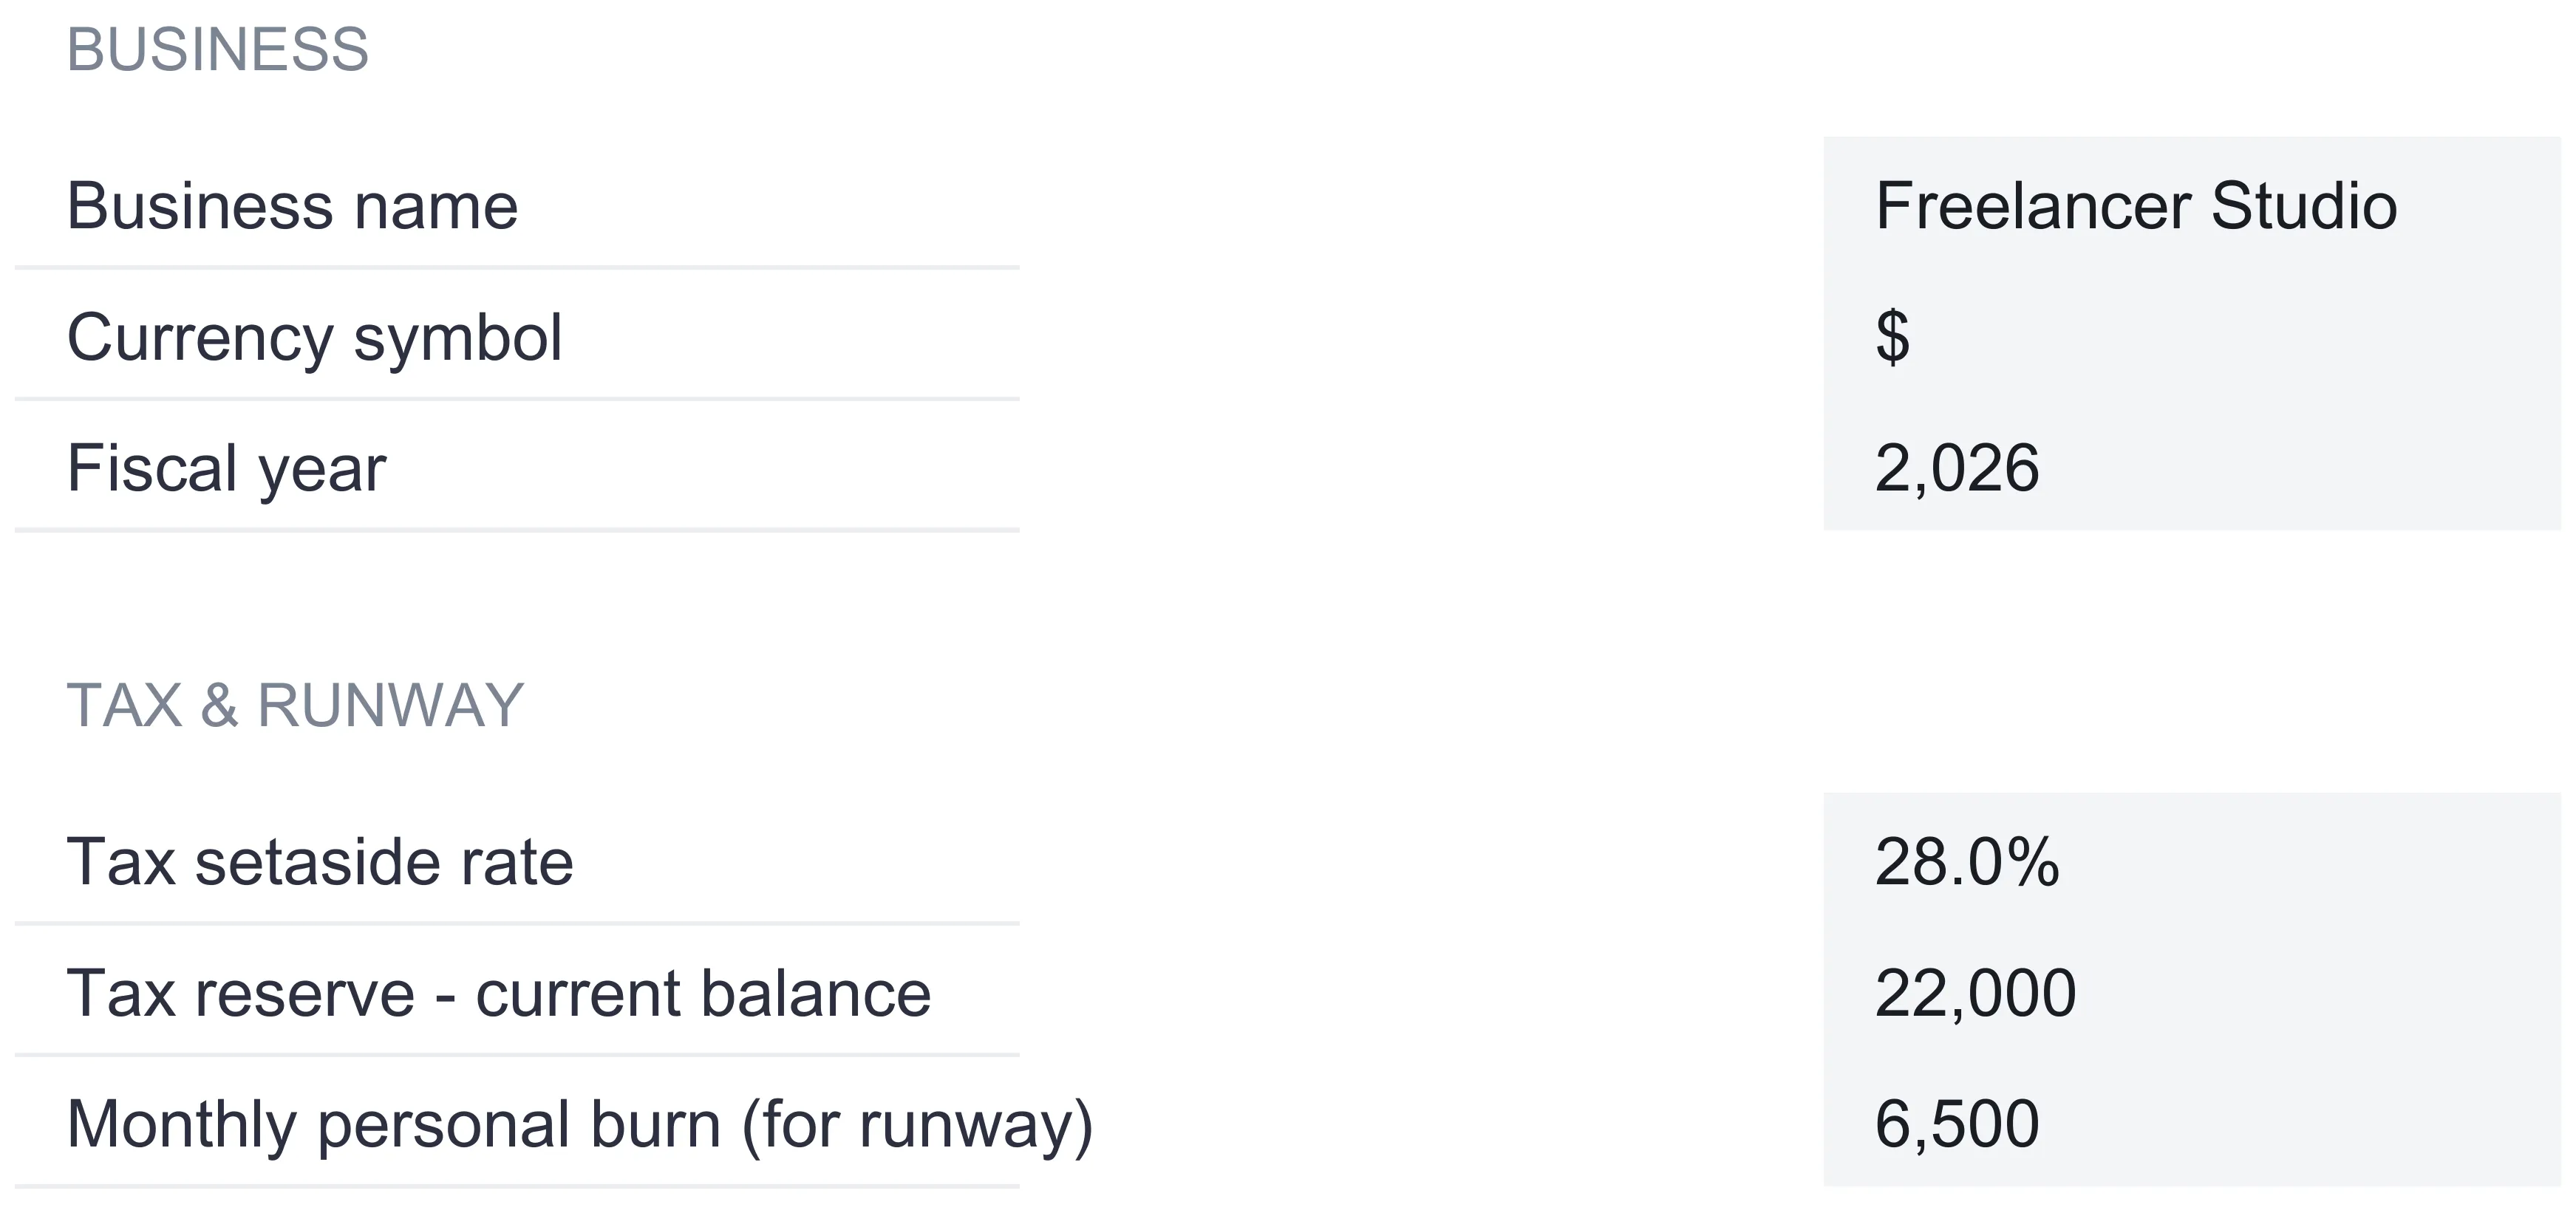
Six inputs on Settings feed the rest of the file, so they are worth getting right before any data goes in.
Business name, currency, and fiscal year are the identity of the file. The sample uses Freelancer Studio, a dollar symbol, and fiscal year 2026. The currency symbol is a dropdown of 35 options, and changing it relabels every money column and KPI header across the workbook. It relabels only; the underlying numbers are never converted. The fiscal year scopes the monthly chart, which reads only the income and expense dates that fall inside the year set here.
Tax setaside rate is the single percentage the suite uses to size the reserve. The sample uses 28 percent. This is a placeholder you choose, not a calculation of your actual bill, and the tax section below returns to why that distinction matters.
Tax reserve, current balance is what you have moved into a reserve account. The sample holds $22,000.
Monthly personal burn is what the business owner spends in a typical month, $6,500 in the sample. It exists for one purpose: the runway figure on the dashboard.
Log what the work earned: the Projects sheet
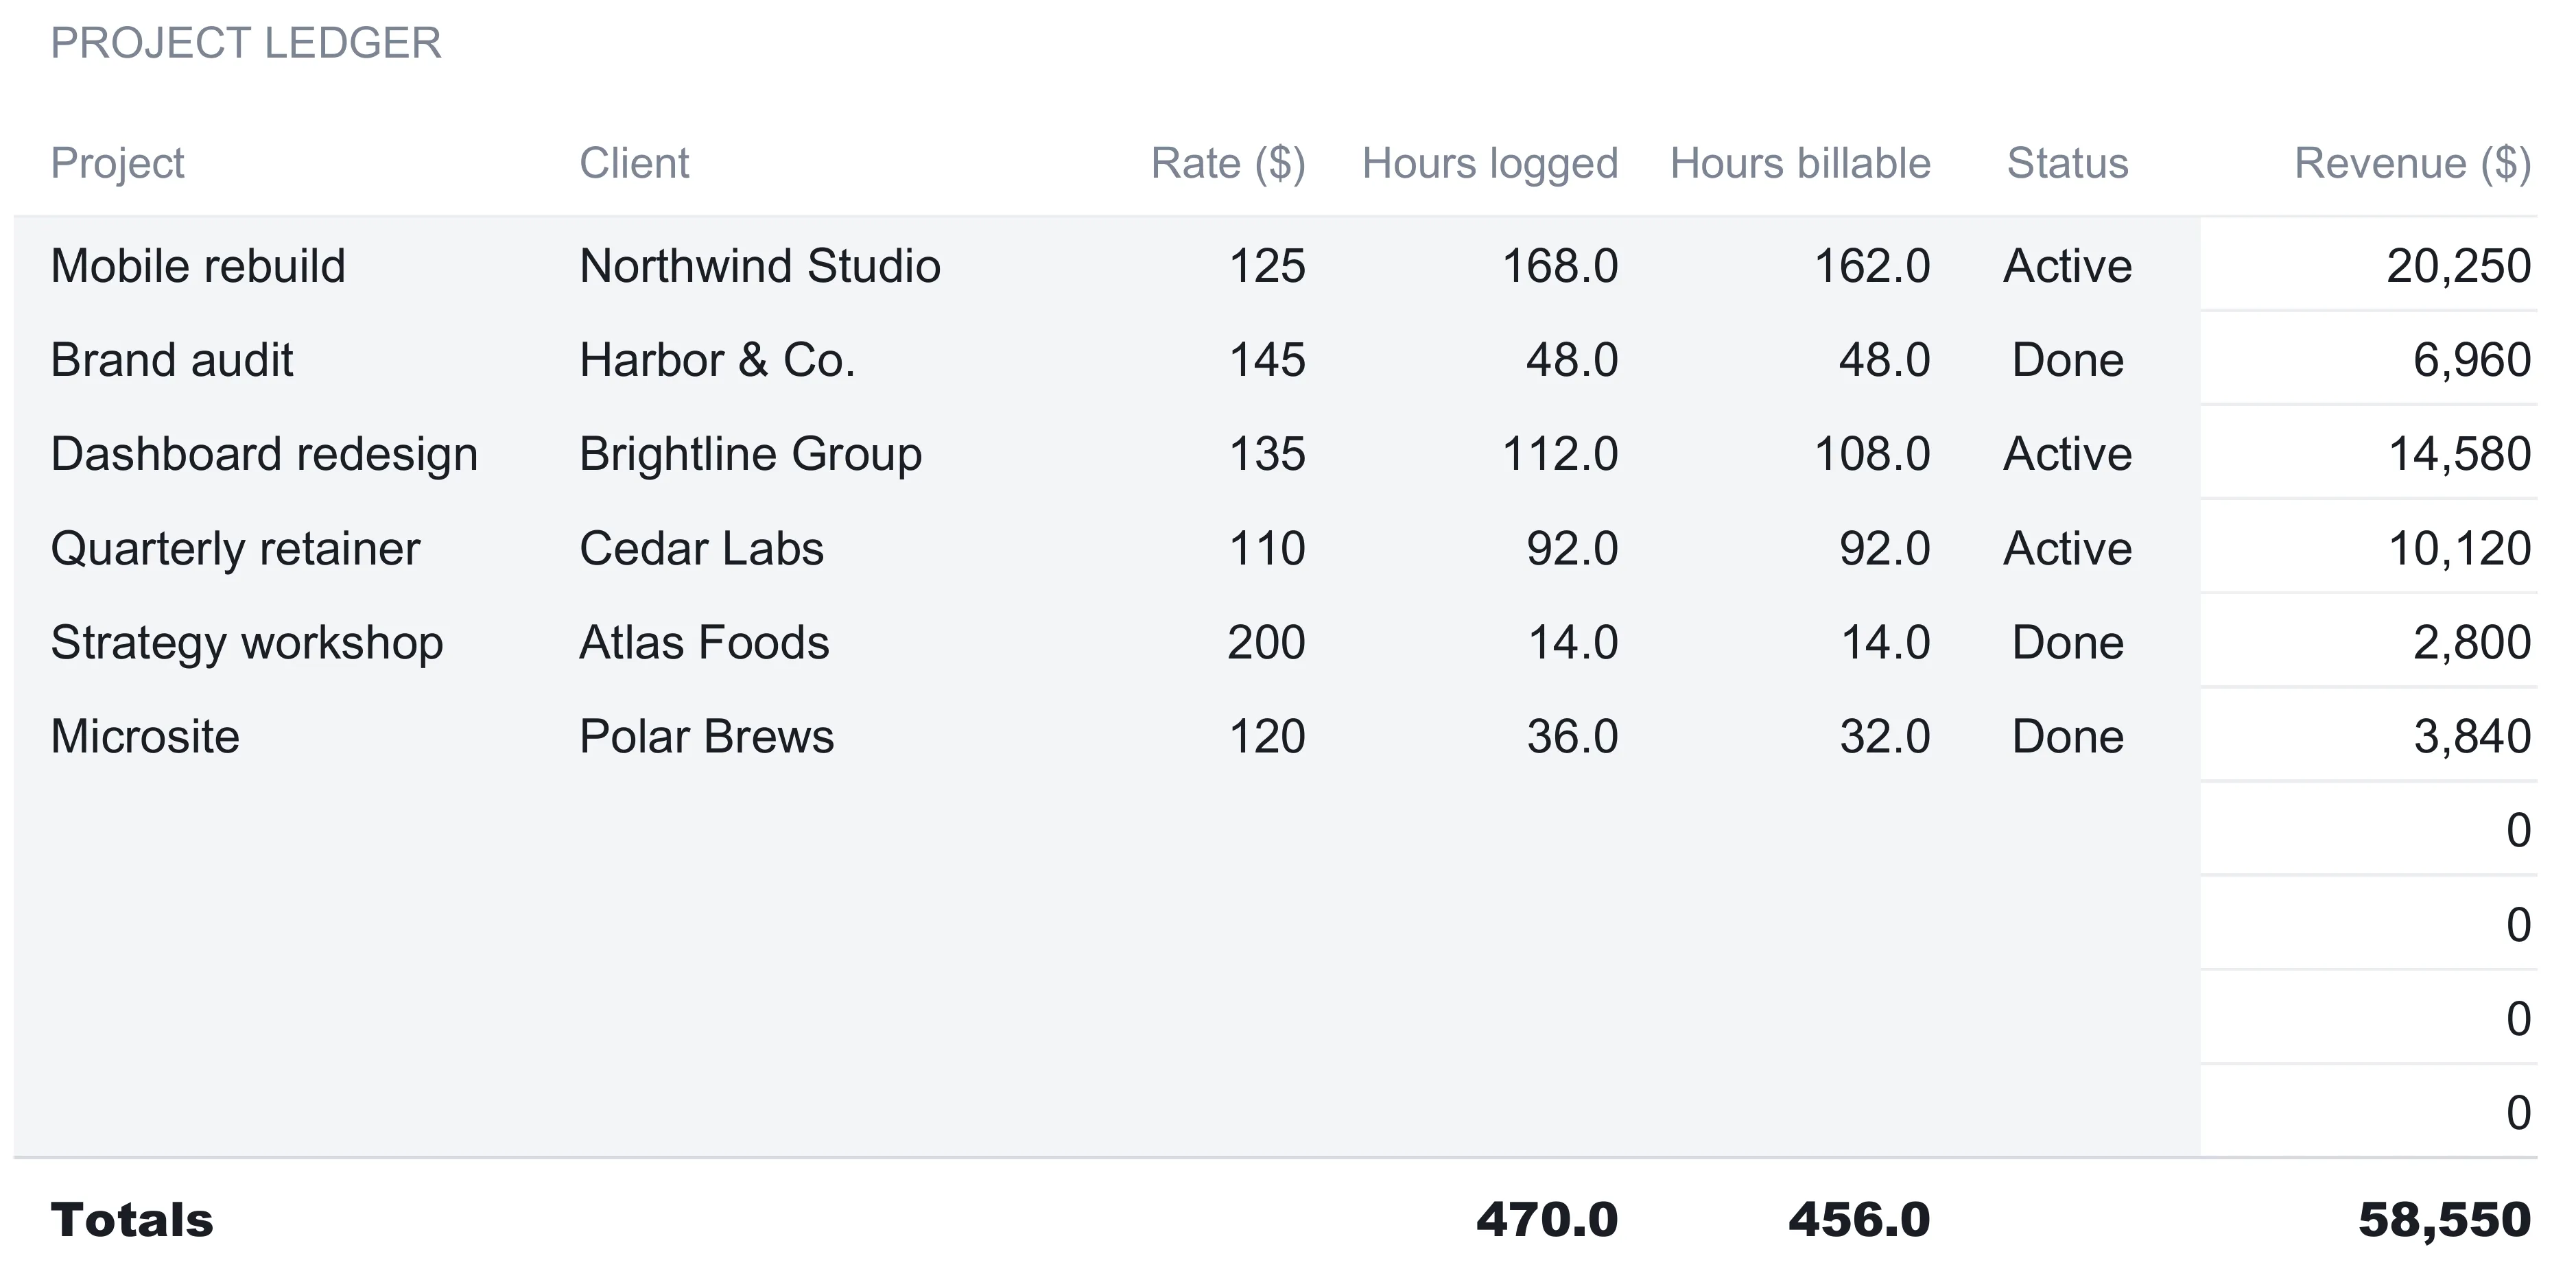
The Projects sheet is the project ledger, and it answers a question invoicing never does: what did each engagement actually earn per hour of billable time? Each row carries the project name, the client, the rate, hours logged, hours billable, a status, and a revenue figure.
Only one of those is a formula. Revenue equals rate multiplied by hours billable, not hours logged. That gap is deliberate. Hours logged is everything the clock recorded; hours billable is the slice the client is actually charged for, after meetings, admin, and rework are stripped out. The sample makes the split visible. The Mobile rebuild for Northwind Studio logged 168 hours but bills 162, at $125 an hour, for $20,250 of revenue. The Microsite for Polar Brews logged 36 and bills 32.
Six projects fill the sample ledger:
| Project | Client | Rate ($) | Hours logged | Hours billable | Status | Revenue ($) |
|---|---|---|---|---|---|---|
| Mobile rebuild | Northwind Studio | 125 | 168 | 162 | Active | 20,250 |
| Brand audit | Harbor & Co. | 145 | 48 | 48 | Done | 6,960 |
| Dashboard redesign | Brightline Group | 135 | 112 | 108 | Active | 14,580 |
| Quarterly retainer | Cedar Labs | 110 | 92 | 92 | Active | 10,120 |
| Strategy workshop | Atlas Foods | 200 | 14 | 14 | Done | 2,800 |
| Microsite | Polar Brews | 120 | 36 | 32 | Done | 3,840 |
| Totals | 470 | 456 | 58,550 |
The totals row sums to 470 hours logged, 456 billable, and $58,550 of revenue. The billable-hours total is what feeds the effective-hourly card on the dashboard, which divides invoiced income by it, and the individual project figures feed the revenue-mix chart. As the sheet’s own note puts it, this is what the work earned, while Income is what was invoiced for it.
Below the last project the ledger keeps several blank rows that already carry the revenue formula and already sit inside the totals, the effective-hourly card, and the revenue chart. A new engagement goes on the first free row and everything updates; there is nothing to drag down and no range to extend. The status column, Active or Done, is a plain label rather than a formula, so it is free to describe where a project stands without changing any of the math.
Log what was billed: the Income sheet
The Income sheet is the invoice ledger, and it is where freelance income and expenses start to become a picture of cash rather than effort. Each row is a client invoice: date, client, project, amount, and a paid date. The status column is a formula. When an amount is present, the row reads Paid if a paid date has been entered and Open if it has not. Leaving the paid date blank is the entire mechanism for marking an invoice as still owed.
The sample carries ten invoices. Eight have paid dates and read Paid; two are recent and still Open. Three totals sit below the ledger:
- Total sums every invoice raised, at $58,550.
- Collected adds only the rows with a paid date, at $48,320.
- Open is the total minus collected, at $10,230.
That $10,230 is the sum of the two unpaid invoices, a $6,480 dashboard redesign for Brightline Group dated 2026-08-18 and a $3,750 mobile rebuild for Northwind Studio dated 2026-09-04. Splitting collected from open is the difference between knowing what you have banked and knowing what you have earned but are still waiting on, and a spreadsheet keeps both numbers in view at once.
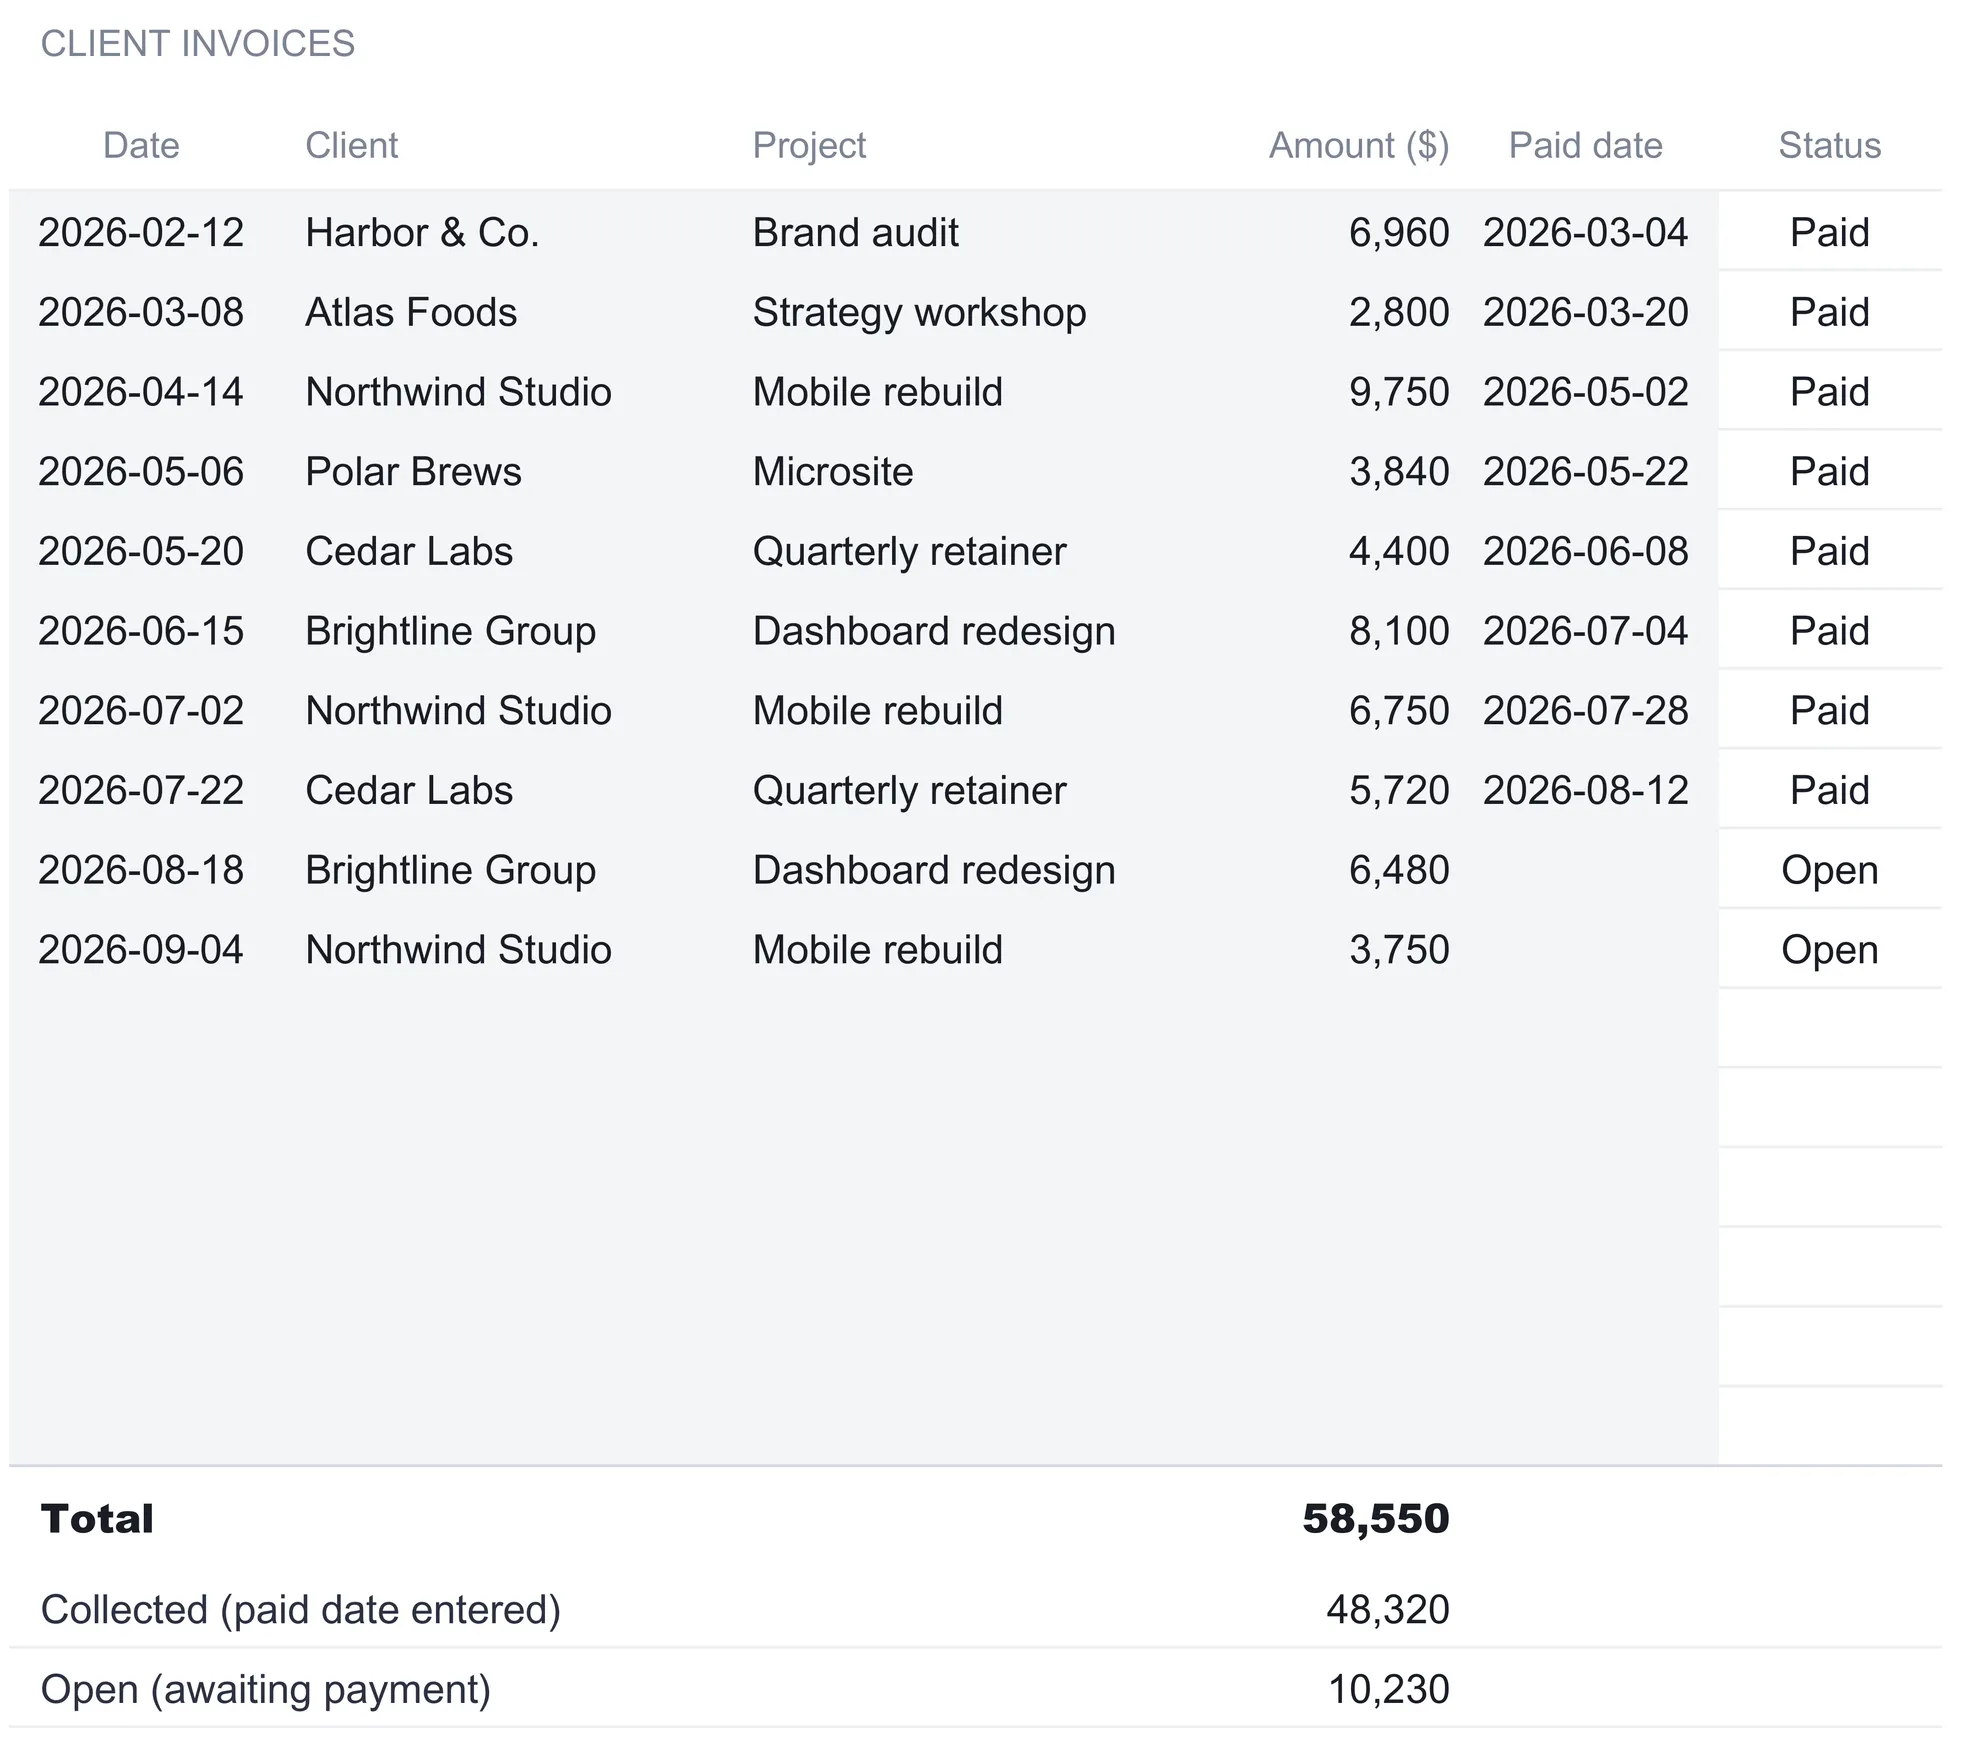
Two details are worth copying into any hand-built version. First, the Total counts every invoice raised, collected or not, and the tax reserve is figured on that whole figure. Income that is still open is income you have earned, so the suite reserves tax against it rather than waiting for the payment to land. Second, the status column costs nothing to maintain: because it reads the paid-date cell rather than asking you to type Paid or Open by hand, an invoice can never sit marked paid while its date is blank. As on the Projects sheet, the rows beneath the last invoice are spare and already inside the Total, the dashboard cards, and the monthly chart, so logging a payment is a matter of typing a date into the row that already exists.
Split the mixed costs: the Expenses sheet
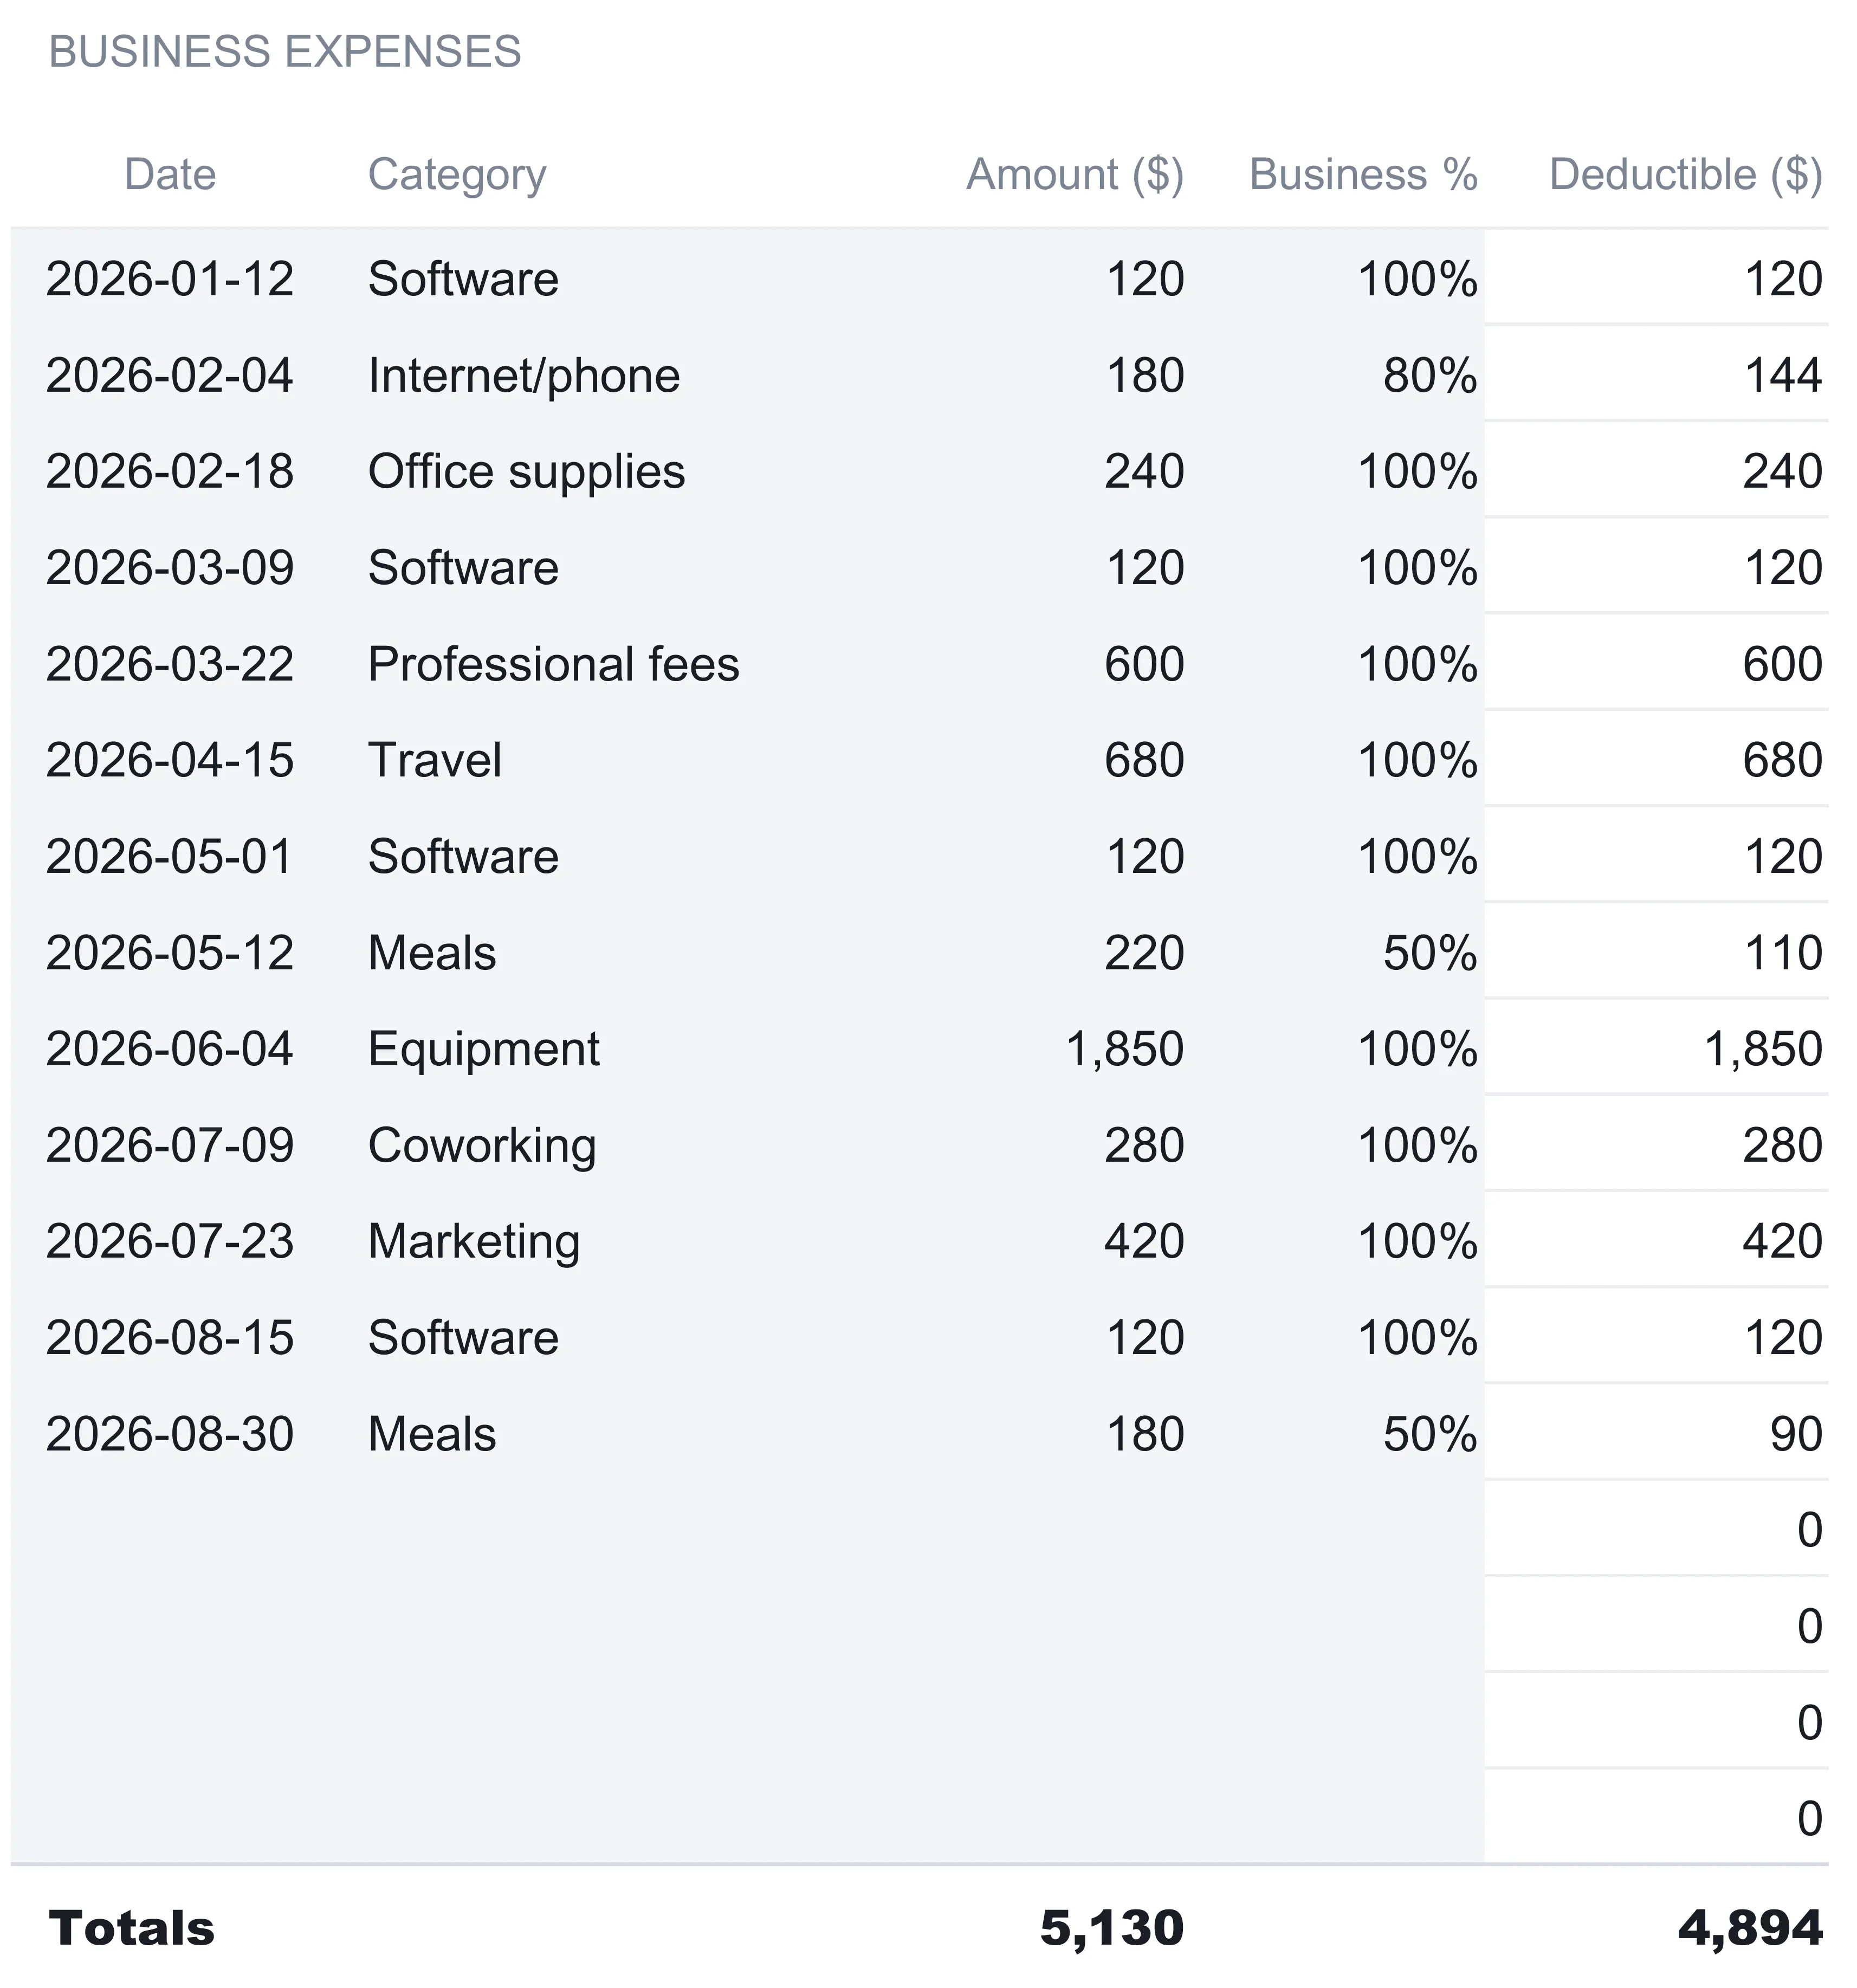
Business expenses live on their own sheet, and the column that makes it more than a receipt list is Business percent. Each row records a date, a category, an amount, and the share of that amount that is genuinely for the business. Deductible equals amount multiplied by business percent. For a cost that is entirely for the business the share is 100 percent and the deductible equals the amount. For a mixed cost it is not.
The sample shows the split doing real work. An internet and phone bill of $180 is set to 80 percent, so $144 counts as deductible. Two client meals, $220 and $180, are set to 50 percent, dropping to $110 and $90. A $1,850 equipment purchase and a $600 professional fee are fully for the business and pass through at their full amounts.
| Date | Category | Amount ($) | Business % | Deductible ($) |
|---|---|---|---|---|
| 2026-01-12 | Software | 120 | 100% | 120 |
| 2026-02-04 | Internet/phone | 180 | 80% | 144 |
| 2026-02-18 | Office supplies | 240 | 100% | 240 |
| 2026-03-09 | Software | 120 | 100% | 120 |
| 2026-03-22 | Professional fees | 600 | 100% | 600 |
| 2026-04-15 | Travel | 680 | 100% | 680 |
| 2026-05-01 | Software | 120 | 100% | 120 |
| 2026-05-12 | Meals | 220 | 50% | 110 |
| 2026-06-04 | Equipment | 1,850 | 100% | 1,850 |
| 2026-07-09 | Coworking | 280 | 100% | 280 |
| 2026-07-23 | Marketing | 420 | 100% | 420 |
| 2026-08-15 | Software | 120 | 100% | 120 |
| 2026-08-30 | Meals | 180 | 50% | 90 |
| Totals | 5,130 | 4,894 |
The two totals matter to different readers. The amount total, $5,130, is what actually left the account. The deductible total, $4,894, is the part the workbook subtracts from income to reach net before tax, and it is that figure, not the raw spend, that flows into the tax reserve. Keeping the business share on each row rather than guessing at year-end is what lets the deductible total stay honest. The same spare-row pattern applies here: the rows below the last expense already carry the deductible formula and already feed the totals, the deductible card, and the monthly chart, so a new cost is one more line rather than a round of formula maintenance.
The category column is free text, so the sample’s mix of Software, Meals, Travel, Equipment, and the rest is a starting vocabulary rather than a fixed list. What the sheet cares about is the pairing of an amount with its business percentage; how finely the categories are cut is left to the person filing.
Size the setaside: the Tax Reserve sheet
The Tax Reserve sheet is short, and every line on it is computed from numbers already entered elsewhere. It walks from income to a setaside target in five steps:
| Line | Sample value ($) | Where it comes from |
|---|---|---|
| YTD income (collected + open) | 58,550 | Income sheet total |
| YTD deductible expenses | 4,894 | Expenses sheet deductible total |
| Net before tax | 53,656 | Income minus deductible |
| Tax owed (rate × net) | 15,024 | Net times the setaside rate |
| Current reserve balance | 22,000 | The balance from Settings |
| Surplus / (Shortfall) | 6,976 | Balance minus tax owed |
The worked path is straightforward. Income of $58,550 less deductible expenses of $4,894 leaves $53,656 net before tax. At the 28 percent setaside rate from Settings, the tax owed estimate is $15,024 (53,656 × 0.28 rounds to that on the sheet). Against a reserve balance of $22,000, that leaves a surplus of $6,976. A negative figure here would read as a shortfall, meaning the reserve sits below the setaside target.
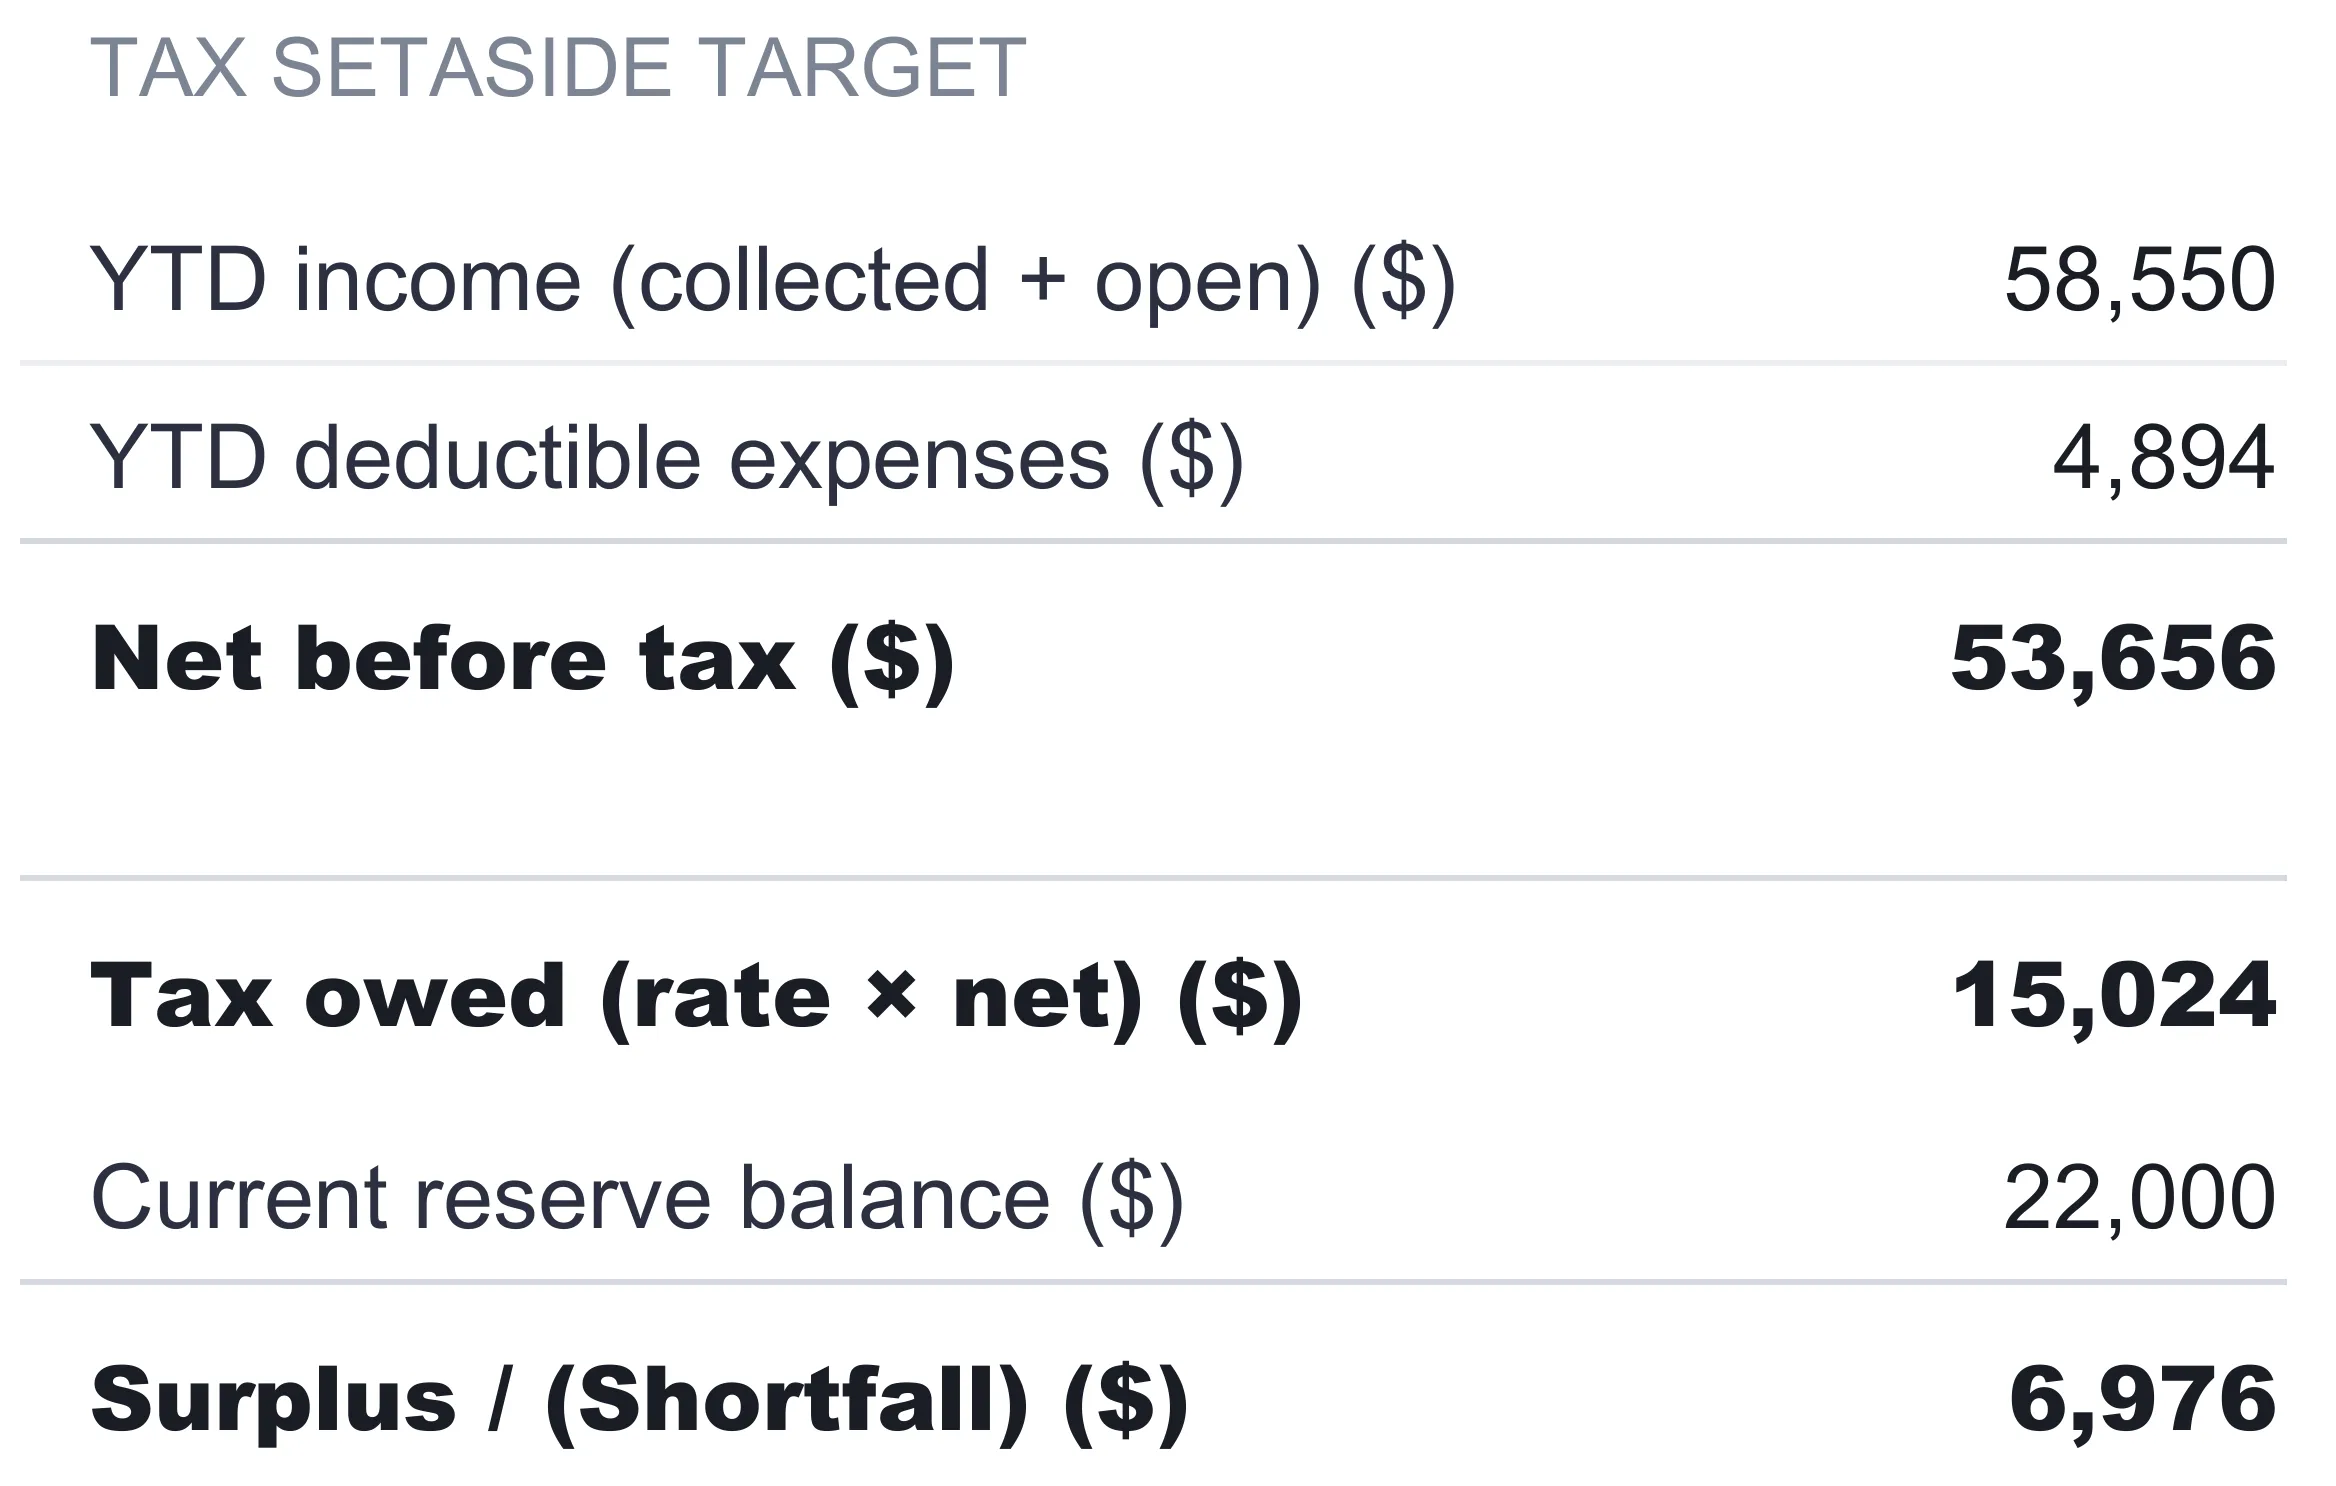
This is the sheet to be careful about, because it touches tax and the template is not a tax calculator. The 28 percent is a rate you type in, and it stands in for whatever mix of federal, state, and self-employment tax you expect to face. It is not an estimate of your real liability. In the US, the self-employment tax alone is a defined figure: the IRS puts the self-employment tax rate at 15.3 percent, made up of 12.4 percent for Social Security and 2.9 percent for Medicare, and income tax sits on top of that. The IRS also notes that people in business for themselves generally need to make estimated tax payments across four payment periods rather than settling up once a year. What rate belongs in that Settings cell, and how the reserve maps onto those payment periods, is a question for a tax professional who knows your circumstances. The suite’s job is only to hold the arithmetic once you have a rate to give it.
How the sheets connect
Before the dashboard, it helps to see the flow, because the whole point of a suite over four separate files is that the sheets read one another. Nothing on the dashboard or the Tax Reserve sheet is typed twice.
Settings sits at the top. Its currency symbol and fiscal year ripple out to every header and every dated calculation, and its tax rate, reserve balance, and burn figure feed the reserve and runway math directly. From there, the three ledgers that hold typed data, Projects, Income, and Expenses, become the sources everything else pulls from. The Income total flows into the Tax Reserve sheet as YTD income and into the dashboard as the YTD income tile. The Expenses deductible total flows into the reserve as the deduction and into the dashboard as the deductible tile. The reserve sheet subtracts one from the other, applies the rate, and hands the dashboard its tax-owed and surplus figures. The Projects billable-hours total meets the Income total to produce effective hourly.
The monthly chart adds one more piece of wiring worth understanding. It does not read a hand-kept monthly summary; it totals the Income and Expenses ledgers month by month using the dates on each row, and it counts only the rows whose dates fall inside the fiscal year set on Settings. Change the fiscal year and the chart repopulates from whichever rows now qualify. The project revenue chart, separately, reads straight from the Projects ledger. Because every summary traces back to a single typed source, the sheets cannot quietly drift out of agreement the way two hand-updated tabs eventually do.
The dashboard: eight numbers and a status line
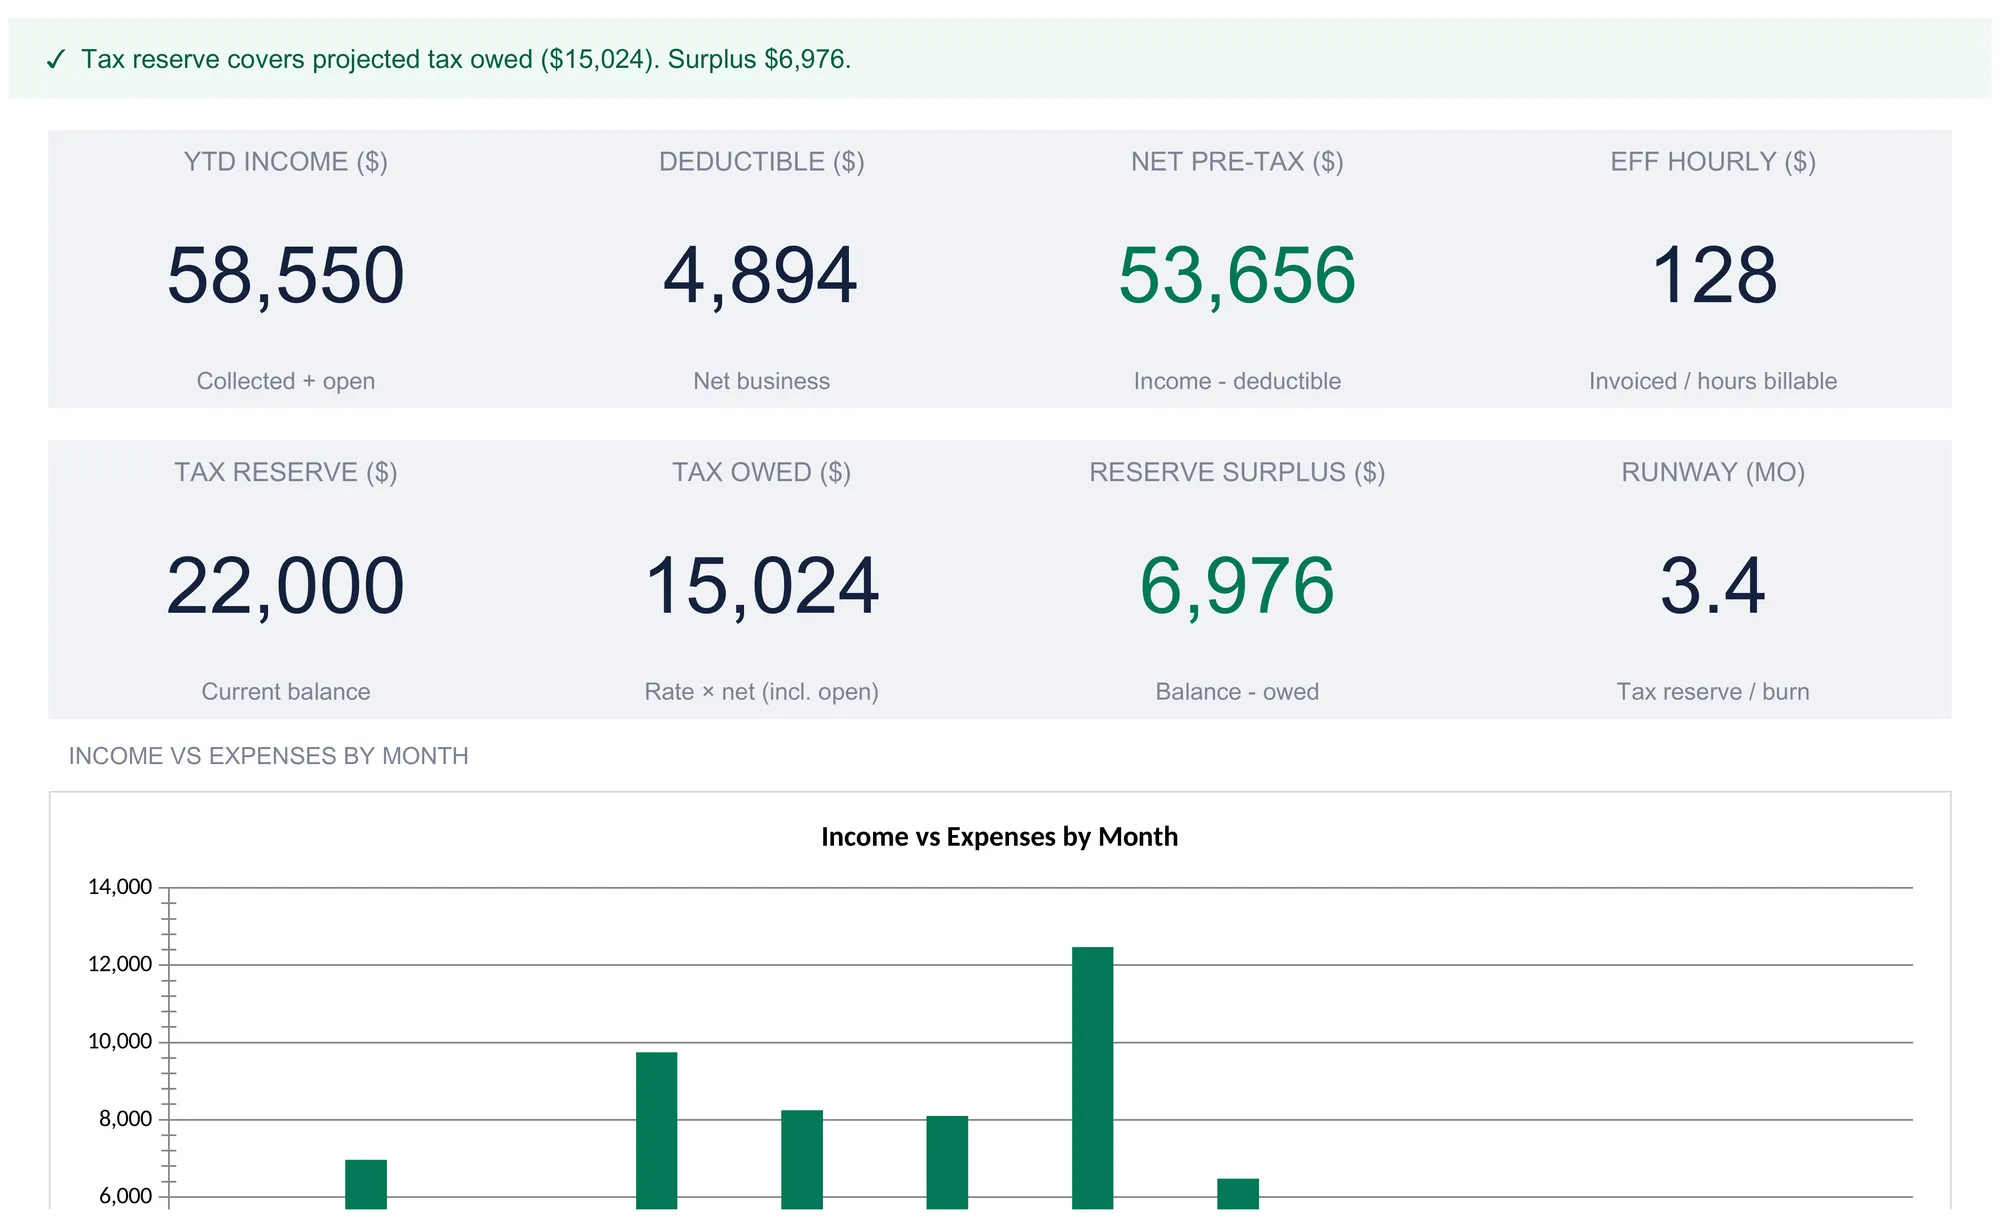
With the ledgers filled, the dashboard computes the year across eight tiles:
| Tile | Sample value | How it is derived |
|---|---|---|
| YTD income | $58,550 | Income sheet total, collected plus open |
| Deductible | $4,894 | Expenses deductible total |
| Net pre-tax | $53,656 | Income minus deductible |
| Effective hourly | $128 | Invoiced income ÷ billable hours |
| Tax reserve | $22,000 | Reserve balance from Settings |
| Tax owed | $15,024 | Setaside rate × net, including open invoices |
| Reserve surplus | $6,976 | Reserve balance minus tax owed |
| Runway | 3.4 mo | Tax reserve ÷ monthly personal burn |
Six of the tiles read a single cell from the sheets already covered, three of them straight off the Tax Reserve sheet. The other two, effective hourly and runway, are divisions the dashboard works out itself, and the section below unpacks them in plain terms.
Above the tiles, a status line states the reserve position in one sentence. In the sample it reads that the tax reserve covers projected tax owed of $15,024 with a surplus of $6,976, and it flips to a warning the moment the reserve falls below the setaside target. It is the one line on the file that reads as plain language rather than a number, and it is deliberately the first thing visible when the workbook opens.
Below the tiles, two charts do the visual work: an income-versus-expenses bars view by month, and a project revenue mix. The monthly chart is where the sample’s uneven cadence shows, with income clustered from spring through midsummer and the biggest single month, July, above $12,000, while expenses stay low and flat except for the June equipment purchase. That shape, feast-then-famine income against steady costs, is the pattern a freelancer feels but rarely sees laid out, and it is the reason a reserve and a runway figure earn their place on the same screen. The revenue-mix chart, meanwhile, shows how much of the year leaned on a handful of engagements, with the Mobile rebuild and Dashboard redesign together accounting for well over half the total.
Effective hourly and runway in plain terms
Two of the dashboard figures carry a little jargon, and both are just divisions of numbers the ledgers already hold.
Effective hourly ($58,550 ÷ 456 = about $128) is what a billable hour earned across the whole year. It will usually land below your top project rate, because the average is dragged down by lower-rate retainers and by hours logged that never became billable. Watching it over time is a cleaner read on pricing than any single quote.
Runway ($22,000 ÷ $6,500 = about 3.4 months) is how many months of personal spending the reserve could absorb. On its own it flatters the picture, because the reserve is also the pot the tax bill comes out of. Reading it alongside the surplus tile keeps it honest.
Neither number is one a bank statement shows, and neither exists in the invoicing tools that only track what has been billed. They are the payoff for keeping the four ledgers in one file: once the work, the invoices, the costs, and the reserve all live together, ratios that cross them become a single division.
Excel or Google Sheets for freelance finances
The suite is an .xlsx file built on plain formulas, with no macros and no add-ons, so it runs the same way in Microsoft Excel and in Google Sheets after upload. Google Sheets suits a freelancer who wants to log an invoice from a phone the day it goes out and reach the file from any machine. Excel suits someone who prefers a local copy and heavier formula work. The structure described here behaves identically in both, and the currency dropdown, the auto status column, and the charts all carry over.
Which template fits which freelancer
- Freelancer Finance Suite Spreadsheet Template ($39) is the all-in-one workbook this walkthrough follows: projects, income, deductible expenses, a tax reserve, and the eight-tile dashboard, in a single file for one business.
- Solo Consultant Rate & Capacity Spreadsheet Template ($29) sits one step earlier in the same story. Where the suite records the hours and rates you have already worked, the rate-and-capacity model works forward from utilization and available hours to the rate a solo practice needs to charge. It is the planning companion to the suite’s tracking.
Related
- How to Track Airbnb Income and Expenses in a Spreadsheet - the same one-ledger-feeds-everything structure applied to a short-term rental
- Self-Employment Tax Calculator for Freelancers - the arithmetic behind the setaside rate the Tax Reserve sheet asks you to type in
- QuickBooks vs Wave for Freelancers - the connected-app side of the automation-versus-visibility trade a spreadsheet makes
Frequently asked questions
What is the difference between the Projects sheet and the Income sheet?
They answer two different questions. Projects records what the work earned: billable hours times rate, whether or not an invoice has gone out. Income records what was actually invoiced, with a paid date that flips each row to Paid or Open. In the sample both happen to total $58,550, but they can diverge whenever work is done ahead of billing or billed ahead of the hours logged. The workbook keeps them as separate ledgers on purpose.
How does the tax reserve figure work?
The Tax Reserve sheet takes YTD income (collected plus open), subtracts deductible expenses to get net before tax, then multiplies that net by the tax setaside rate on Settings to estimate tax owed. It compares that estimate against the reserve balance you enter and shows the surplus or shortfall. The rate is a single placeholder you set yourself, not a calculation of your actual liability, so a tax professional is the right person to confirm what rate fits your situation.
What does effective hourly measure here?
Effective hourly divides invoiced income by billable hours, crossing the Income and Projects sheets. In the sample that is $58,550 over 456 billable hours, about $128. It is a sanity check on rate: because billable hours can be lower than hours logged once meetings and admin are stripped out, the effective figure often sits below any single project's headline rate.
Can one workbook track more than one currency?
No. Settings holds a single currency symbol chosen from a dropdown of 35, and picking one relabels every money column and KPI across the workbook. It changes the label only and does not convert any numbers, so the suite runs in one currency per file.
Does the workbook connect to my bank or invoicing tool?
No. There is no bank feed and no import. Every project, invoice, and expense is typed into its ledger, and the totals, cards, and charts read from those rows. That is the trade a spreadsheet makes: no automation, but every formula is visible and editable and the file stays on your own machine.
Sources
- Self-employment tax (Social Security and Medicare taxes) - Internal Revenue Service
- Estimated taxes - Internal Revenue Service
About this article
Sheets, inputs, formulas, sample figures, and dashboard tiles checked on 2026-09-10 against the shipped Freelancer Finance Suite workbook (Dashboard, Projects, Income, Expenses, Tax Reserve, Settings, How to Use), the exact file customers download. Self-employment tax rate and estimated-tax references checked against the live IRS pages at writing time. Last reviewed September 2026.