
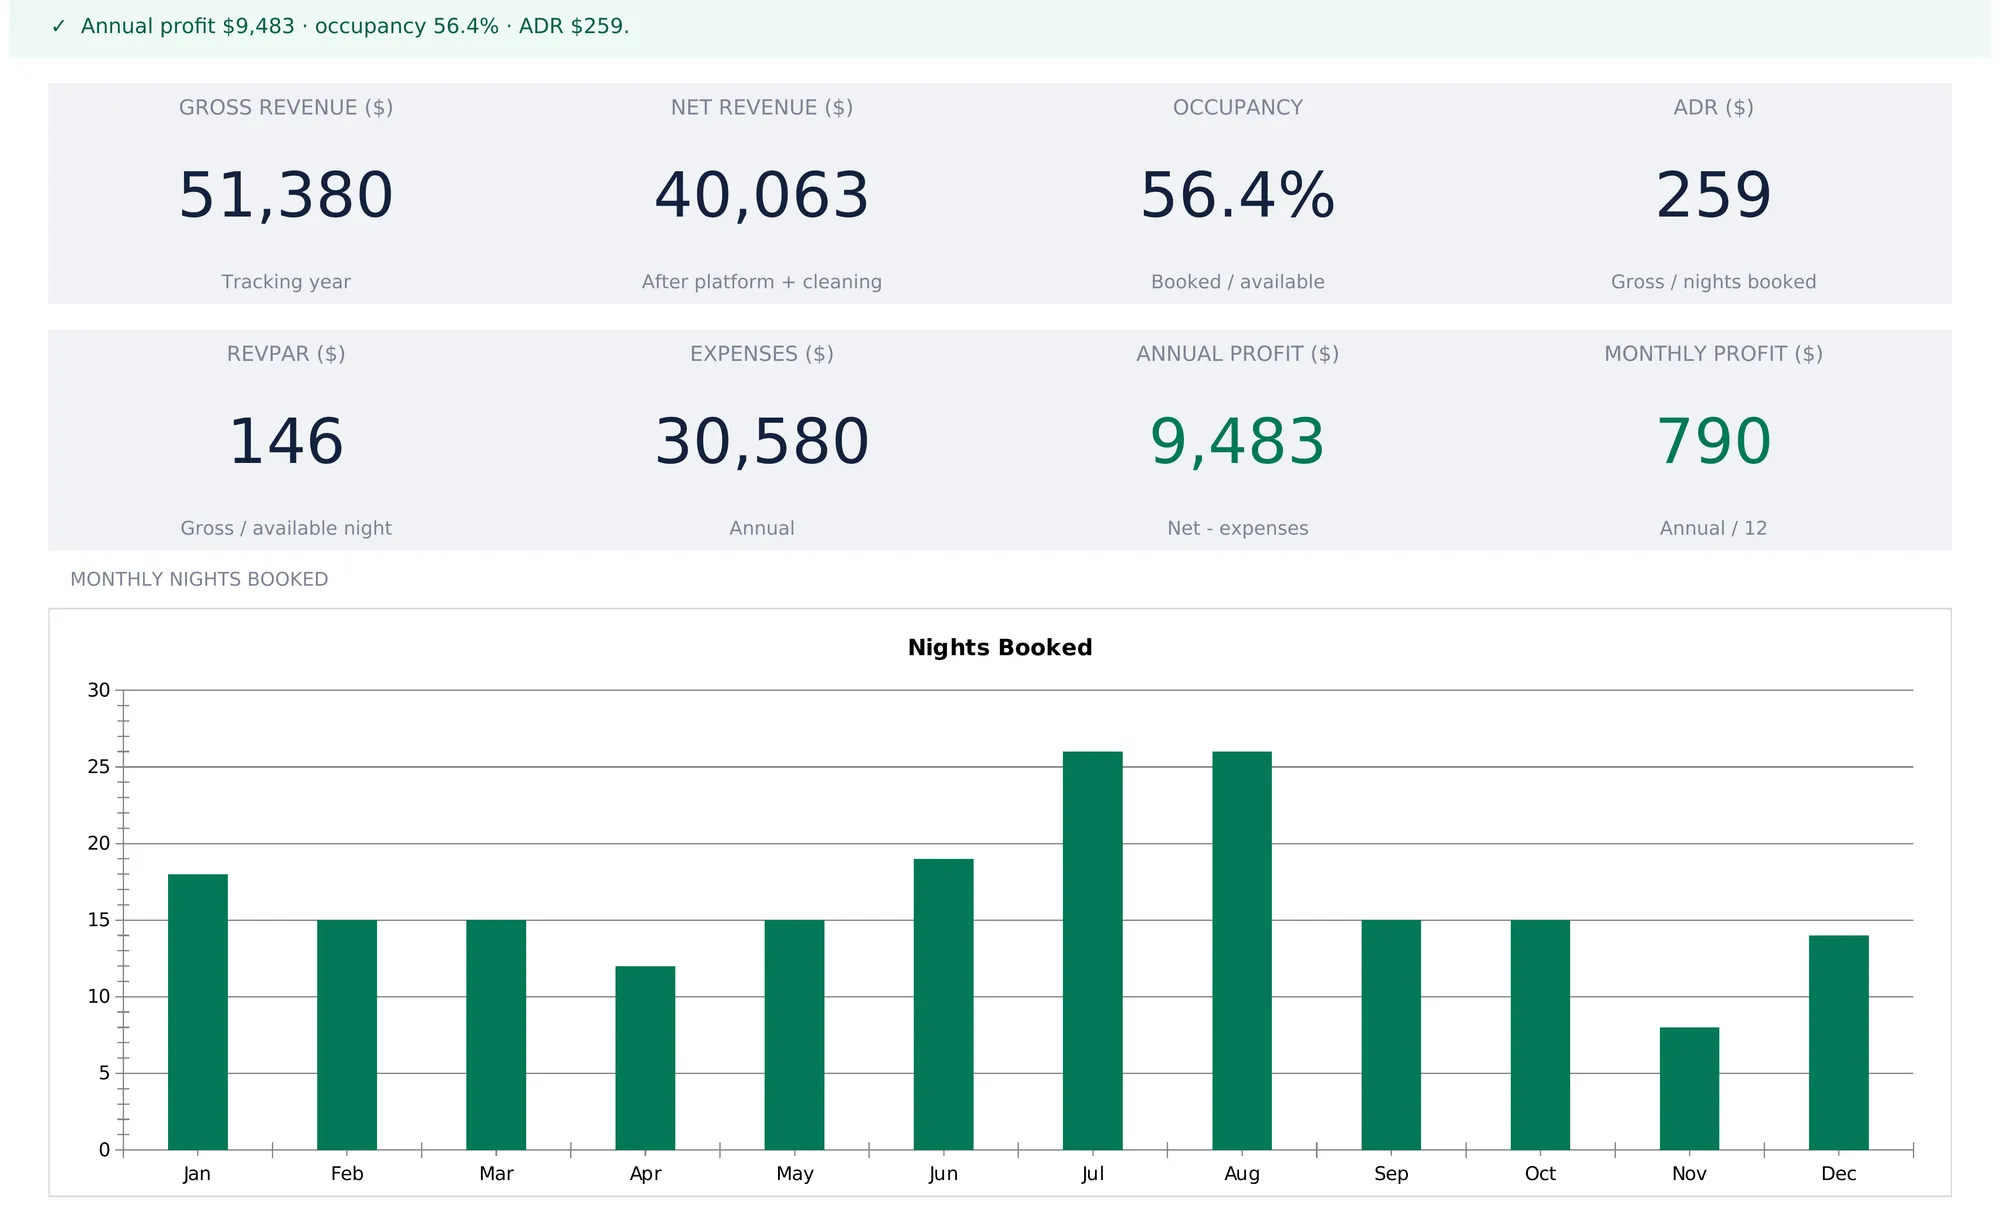
An Airbnb tracking spreadsheet keeps every stay in a single bookings ledger and derives everything else from it: monthly occupancy, average daily rate, RevPAR, and annual profit after expenses. This walkthrough covers the full structure using a worked example, a cabin with 198 booked nights, $51,380 gross, and $9,483 profit for the year. Our Airbnb / STR Tracker ($39) ships the same structure ready-made for Excel and Google Sheets.
A short-term rental generates a lot of financial data for a one-property business. Dozens of stays a year, each with its own nightly rate, platform fee, and cleaning turnover, sit on top of annual costs that never show up in a payout email. Most hosts can answer “what did Airbnb pay out last month?” Far fewer can answer “what was my occupancy in March, and is my average rate rising?” The difference between those two questions is structure, and a spreadsheet handles it well.
That structure is four pieces: a single bookings ledger, a small set of listing constants, an annual expense list, and the metrics that fall out of them (occupancy, ADR, RevPAR, and profit). The examples below come from our Airbnb / STR Tracker Spreadsheet Template ($39), which ships the whole thing ready-made for Excel and Google Sheets. The layout is reproducible by hand if you’d rather build your own.
What an Airbnb tracking spreadsheet has to hold
Strip away the platform dashboards and there are only four kinds of data:
- Per-stay records. Check-in date, nights, guests, and the nightly rate for every booking. This is the raw material for everything else.
- Listing constants. The numbers that apply to every stay: the platform’s fee percentage, what a cleaning turnover costs, and how many nights the calendar is genuinely open in a year.
- Annual operating costs. Mortgage, property tax, insurance, utilities, and the rest of the bills that arrive whether or not anyone books.
- Derived metrics. Monthly occupancy, average daily rate, RevPAR, and profit. These are calculations, not entries; in a well-built sheet, nothing here is ever typed.
The tracker gives each of these its own sheet (Settings, Bookings, Expenses, and Performance) with a Dashboard on top and a How to Use sheet carrying the instructions.
Start with the constants: the Settings sheet
Three numbers on the Settings sheet drive every calculation downstream, so they come first.
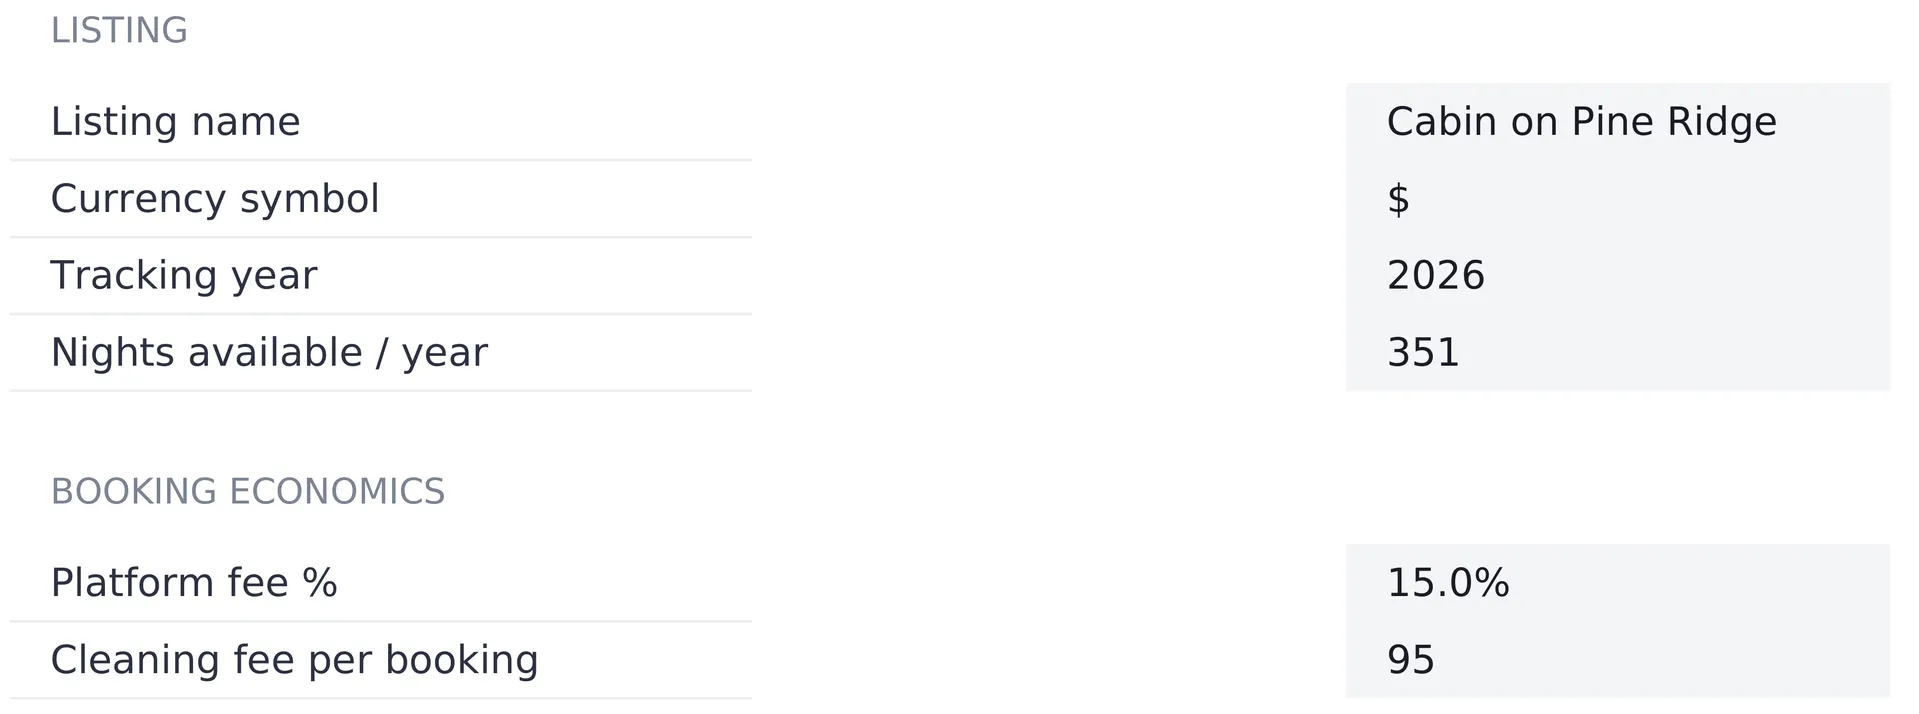
Nights available per year. This is the denominator for occupancy and RevPAR, and it is not automatically 365. The sample listing uses 351, a full calendar minus two weeks of maintenance closures and personal use. Occupancy measured against 365 nights when only 351 are open understates the listing all year.
Platform fee percentage. One percentage, applied to the gross of every stay. The sample uses 15 percent.
Cleaning cost per booking. A flat per-turnover amount, $95 in the sample. Modeling cleaning per booking rather than as an annual lump keeps the net figure honest in months with heavy turnover.
The sheet also holds the listing name, the tracking year that scopes the reporting sheets, and a currency selector with 35 symbols. Changing the symbol relabels every money column across the workbook. It relabels only, with no conversion of the numbers. One listing name means one property per file, so a second listing is a second copy of the workbook.
Log each stay once: the Bookings ledger
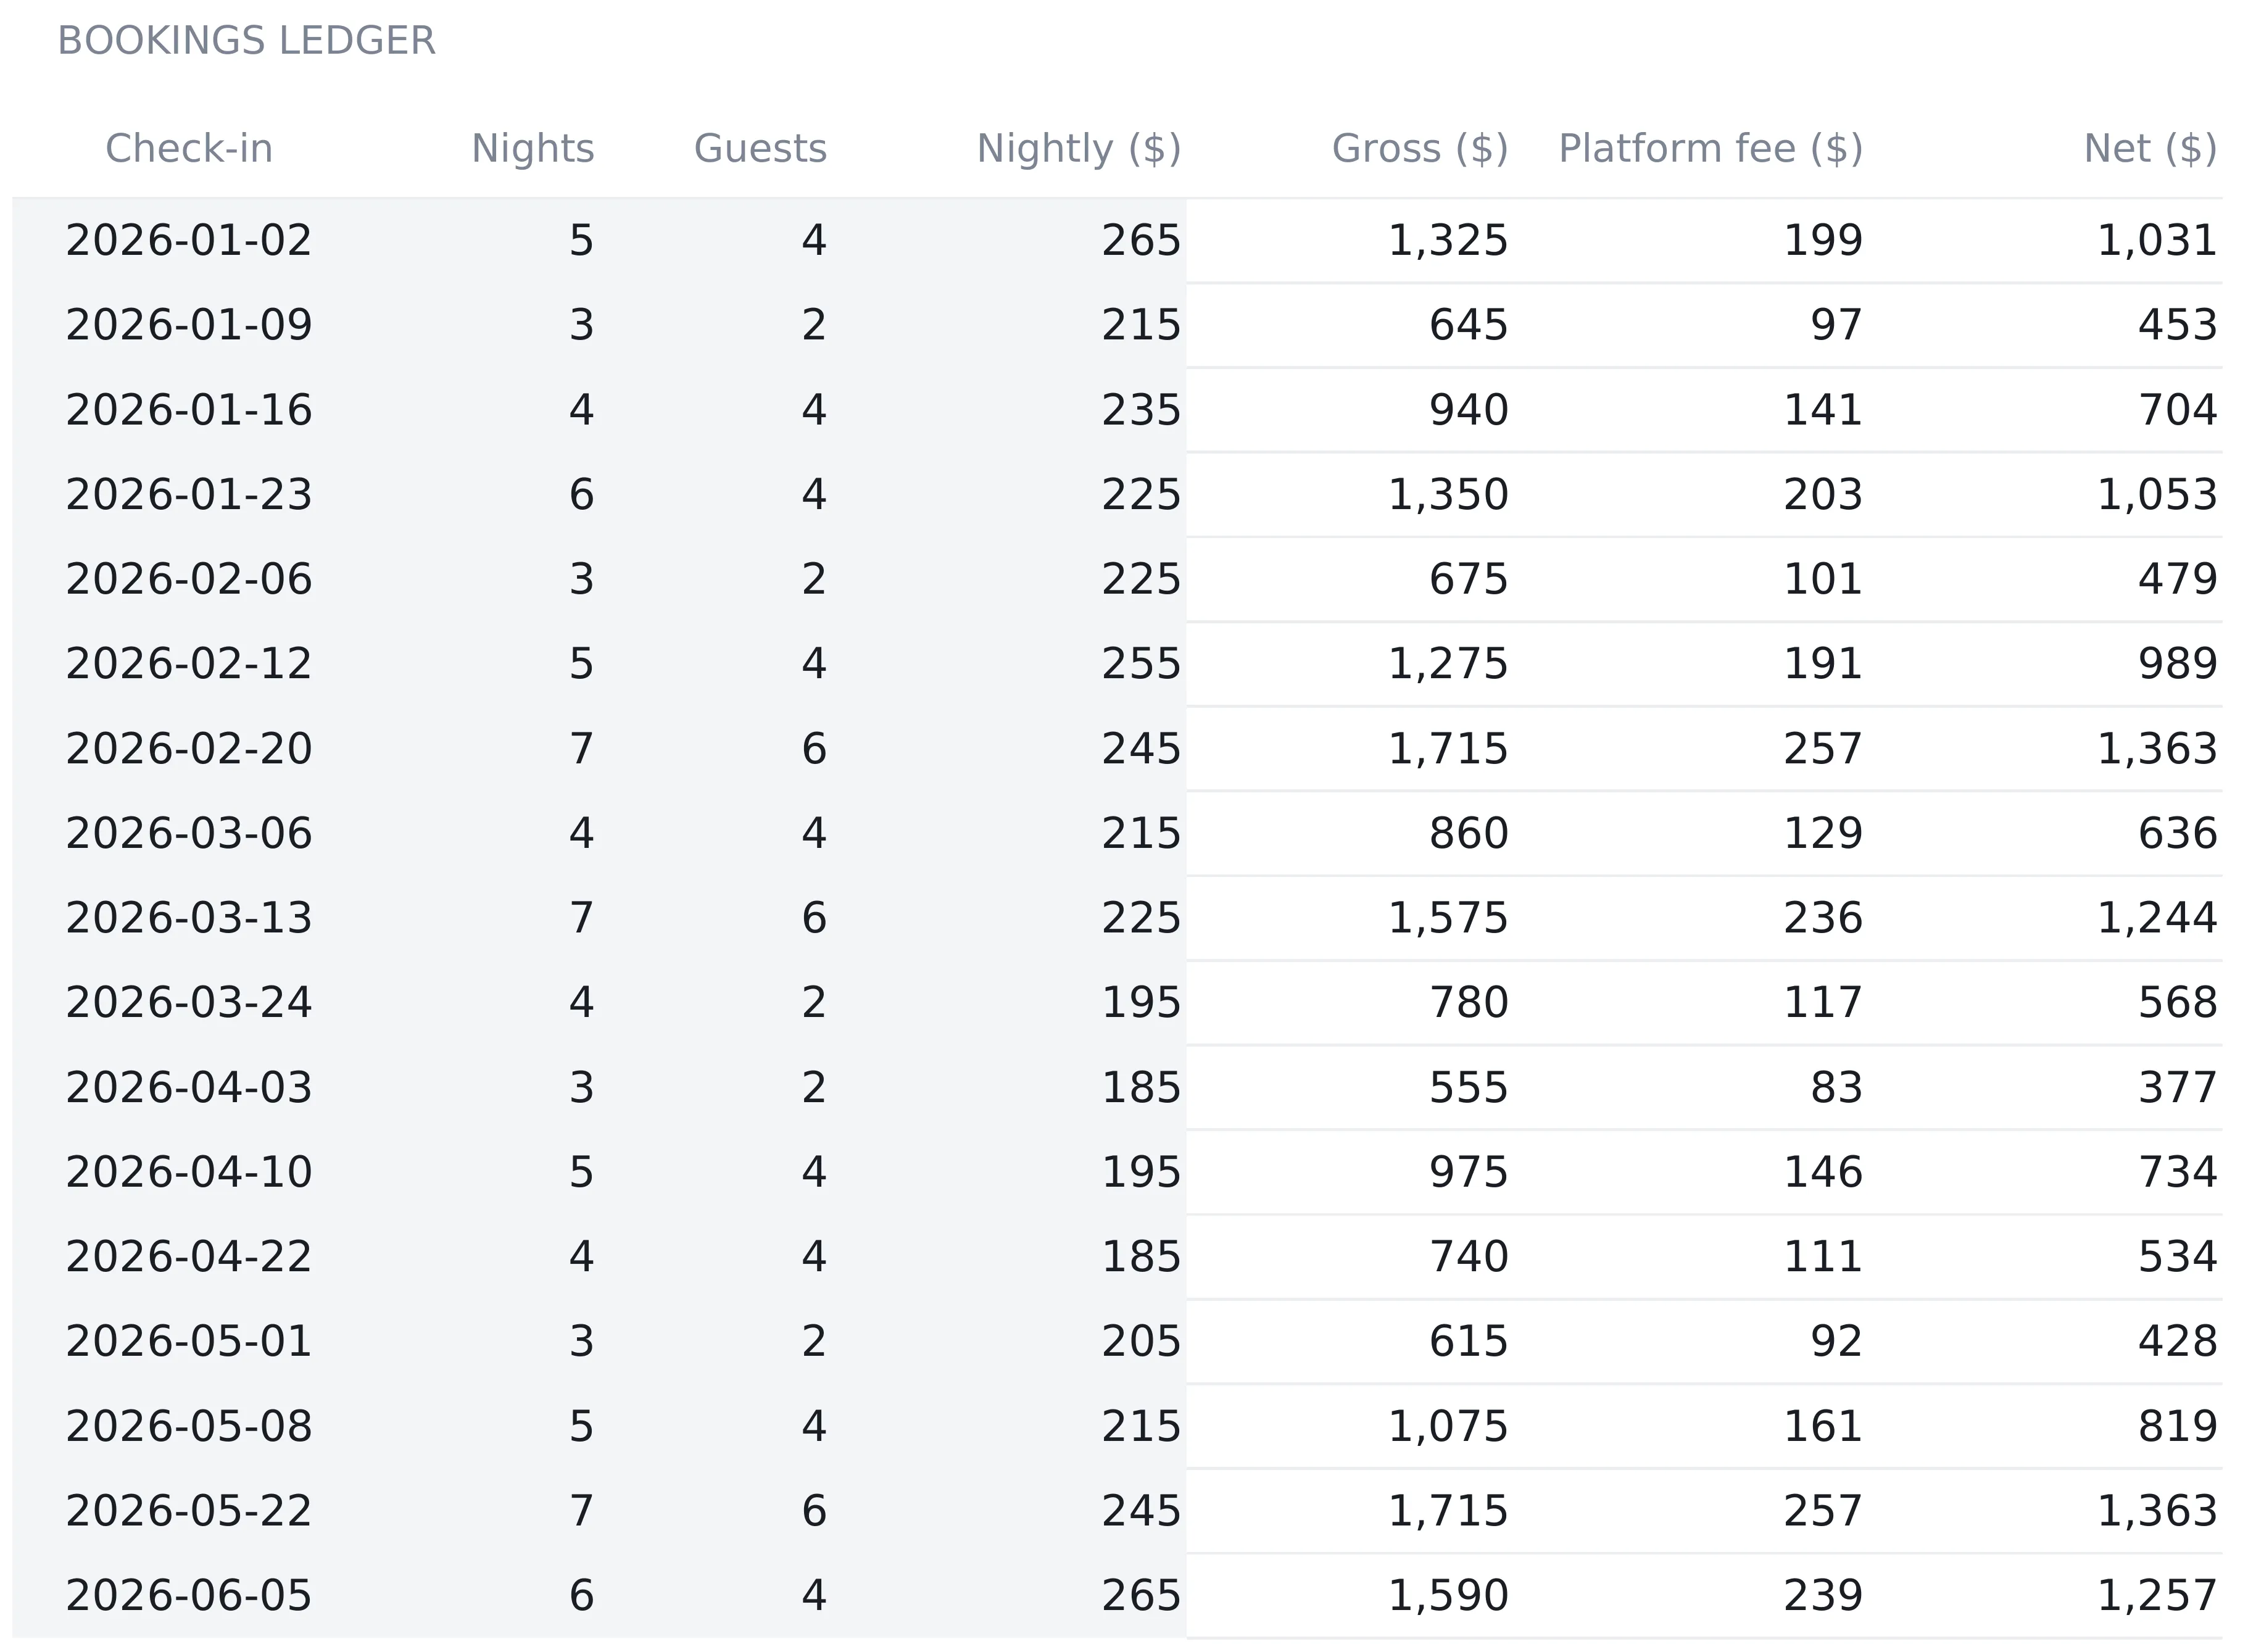
The ledger is the only place a stay is ever typed. Four columns are entries: check-in date, nights, guests, and the nightly rate. Three are formulas:
- Gross = nights × nightly rate
- Platform fee = gross × the fee percentage from Settings
- Net = gross - platform fee - the cleaning cost from Settings
One row from the sample year makes the flow concrete. A five-night stay from January 2 at $265 a night grosses $1,325. The 15 percent platform fee takes $198.75, cleaning takes $95, and $1,031.25 lands as net. Multiply that by a year of stays (38 bookings and 198 nights in the sample) and the ledger totals read $51,380 gross, $7,707 in platform fees, and $40,063 net.
Two design details are worth copying into any hand-built version:
Spare rows are pre-wired. The ledger’s blank rows already carry the gross, fee, and net formulas and already sit inside every total. The next booking goes on the first free row and the whole workbook updates; there is no formula to drag down and no range to extend.
Everything downstream reads this one ledger. The monthly rollup and the dashboard both pull from the same rows, so they cannot drift apart. Spreadsheets that break tend to break exactly here, when a stay gets typed into one summary but not another.
What the ledger does not do is fill itself. There is no connection to Airbnb and no payout import, so every stay is four typed cells. At 38 bookings a year that is a couple of minutes a month. For a host juggling six listings across three platforms it is real work, which is what channel-manager software exists to remove. The trade is automation against visibility. A connected app suits hosts who want the data to arrive on its own. A spreadsheet suits hosts who want to read every formula, change any of them, and keep the file on their own machine.
Read the year by month: the Performance sheet
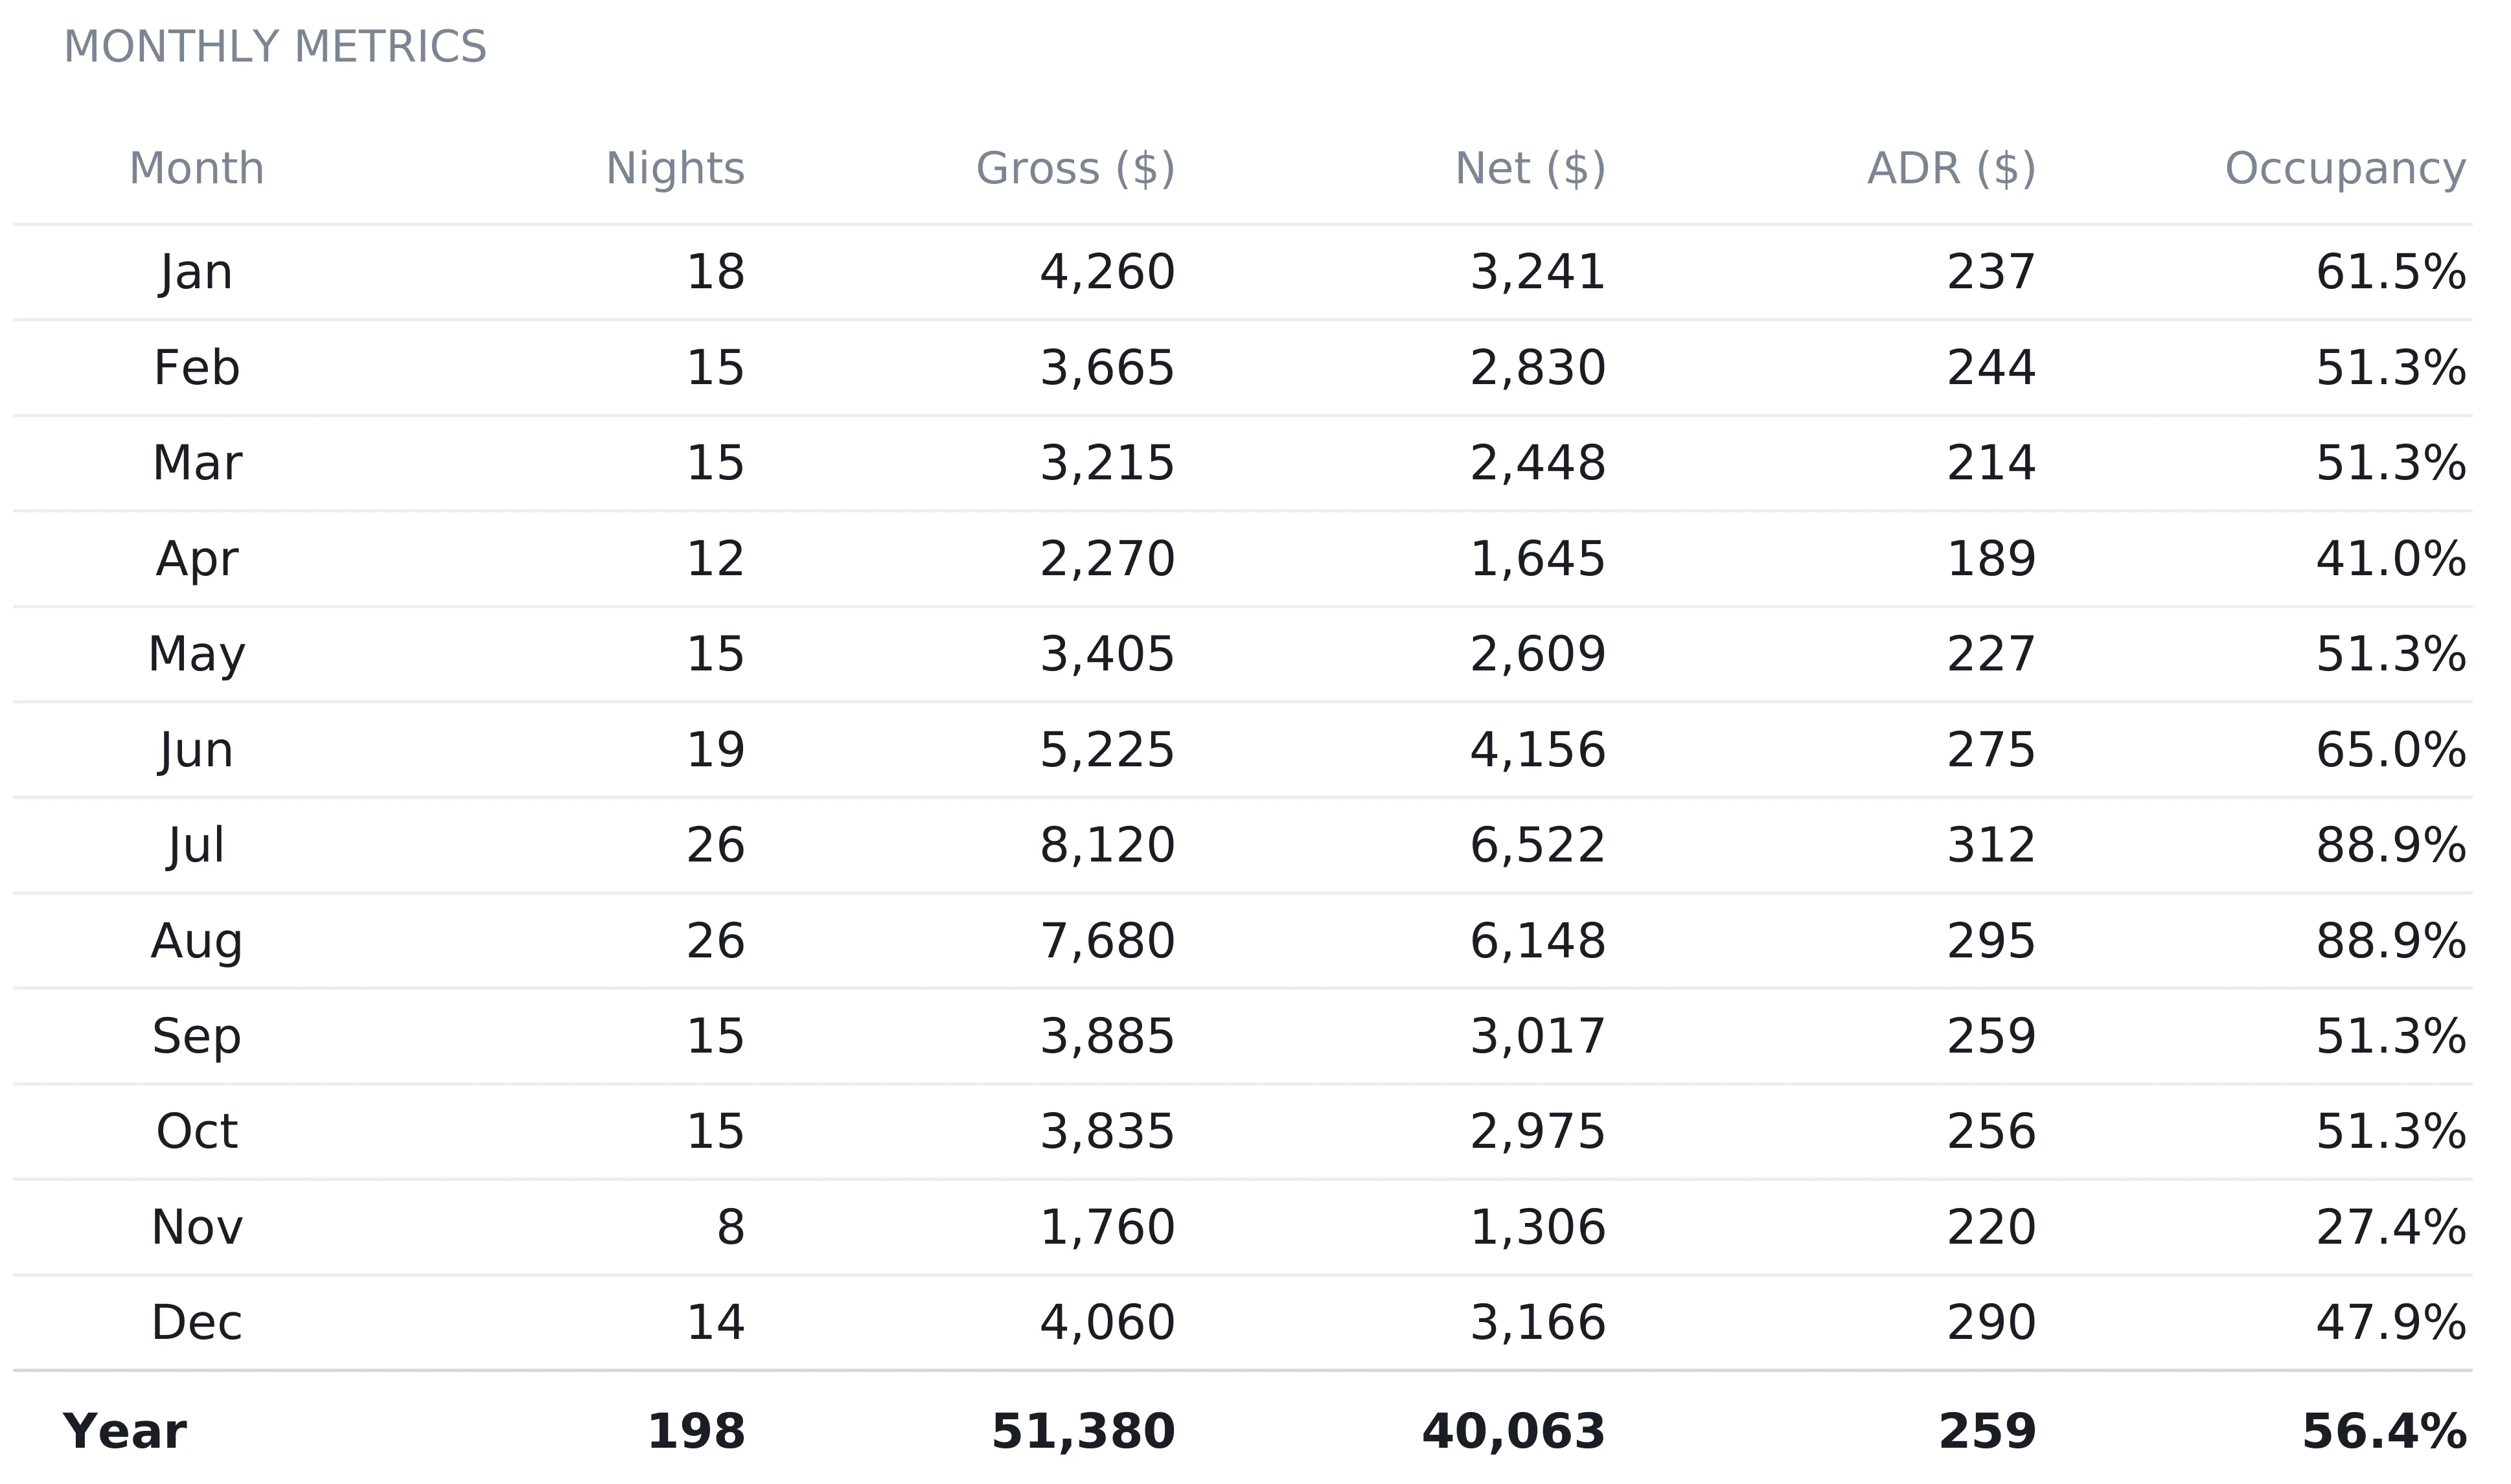
The Performance sheet rolls the ledger up by check-in month: a stay counts in the month it starts, and only if that date falls inside the tracking year set on Settings. Every cell is computed; nothing on the sheet is typed. Each month gets five numbers: nights, gross, net, ADR, and occupancy.
Seasonality jumps out of the sample year. July books 26 nights at a $312 average rate for 88.9 percent occupancy, while November books 8 nights at $220 for 27.4 percent. Those two months differ by a factor of four in gross revenue, $8,120 against $1,760. A spread that size shows up month by month on the chart, rather than only in a January bank balance. Across the whole year the sample lands at a $259 ADR and 56.4 percent occupancy.
A monthly occupancy figure needs a monthly denominator, and the sheet uses an even twelfth of the annual nights available (351 ÷ 12, about 29.25 nights). That is an approximation, but a consistent one, and consistency is what makes month-to-month comparison meaningful.
Keep annual costs separate: the Expenses sheet
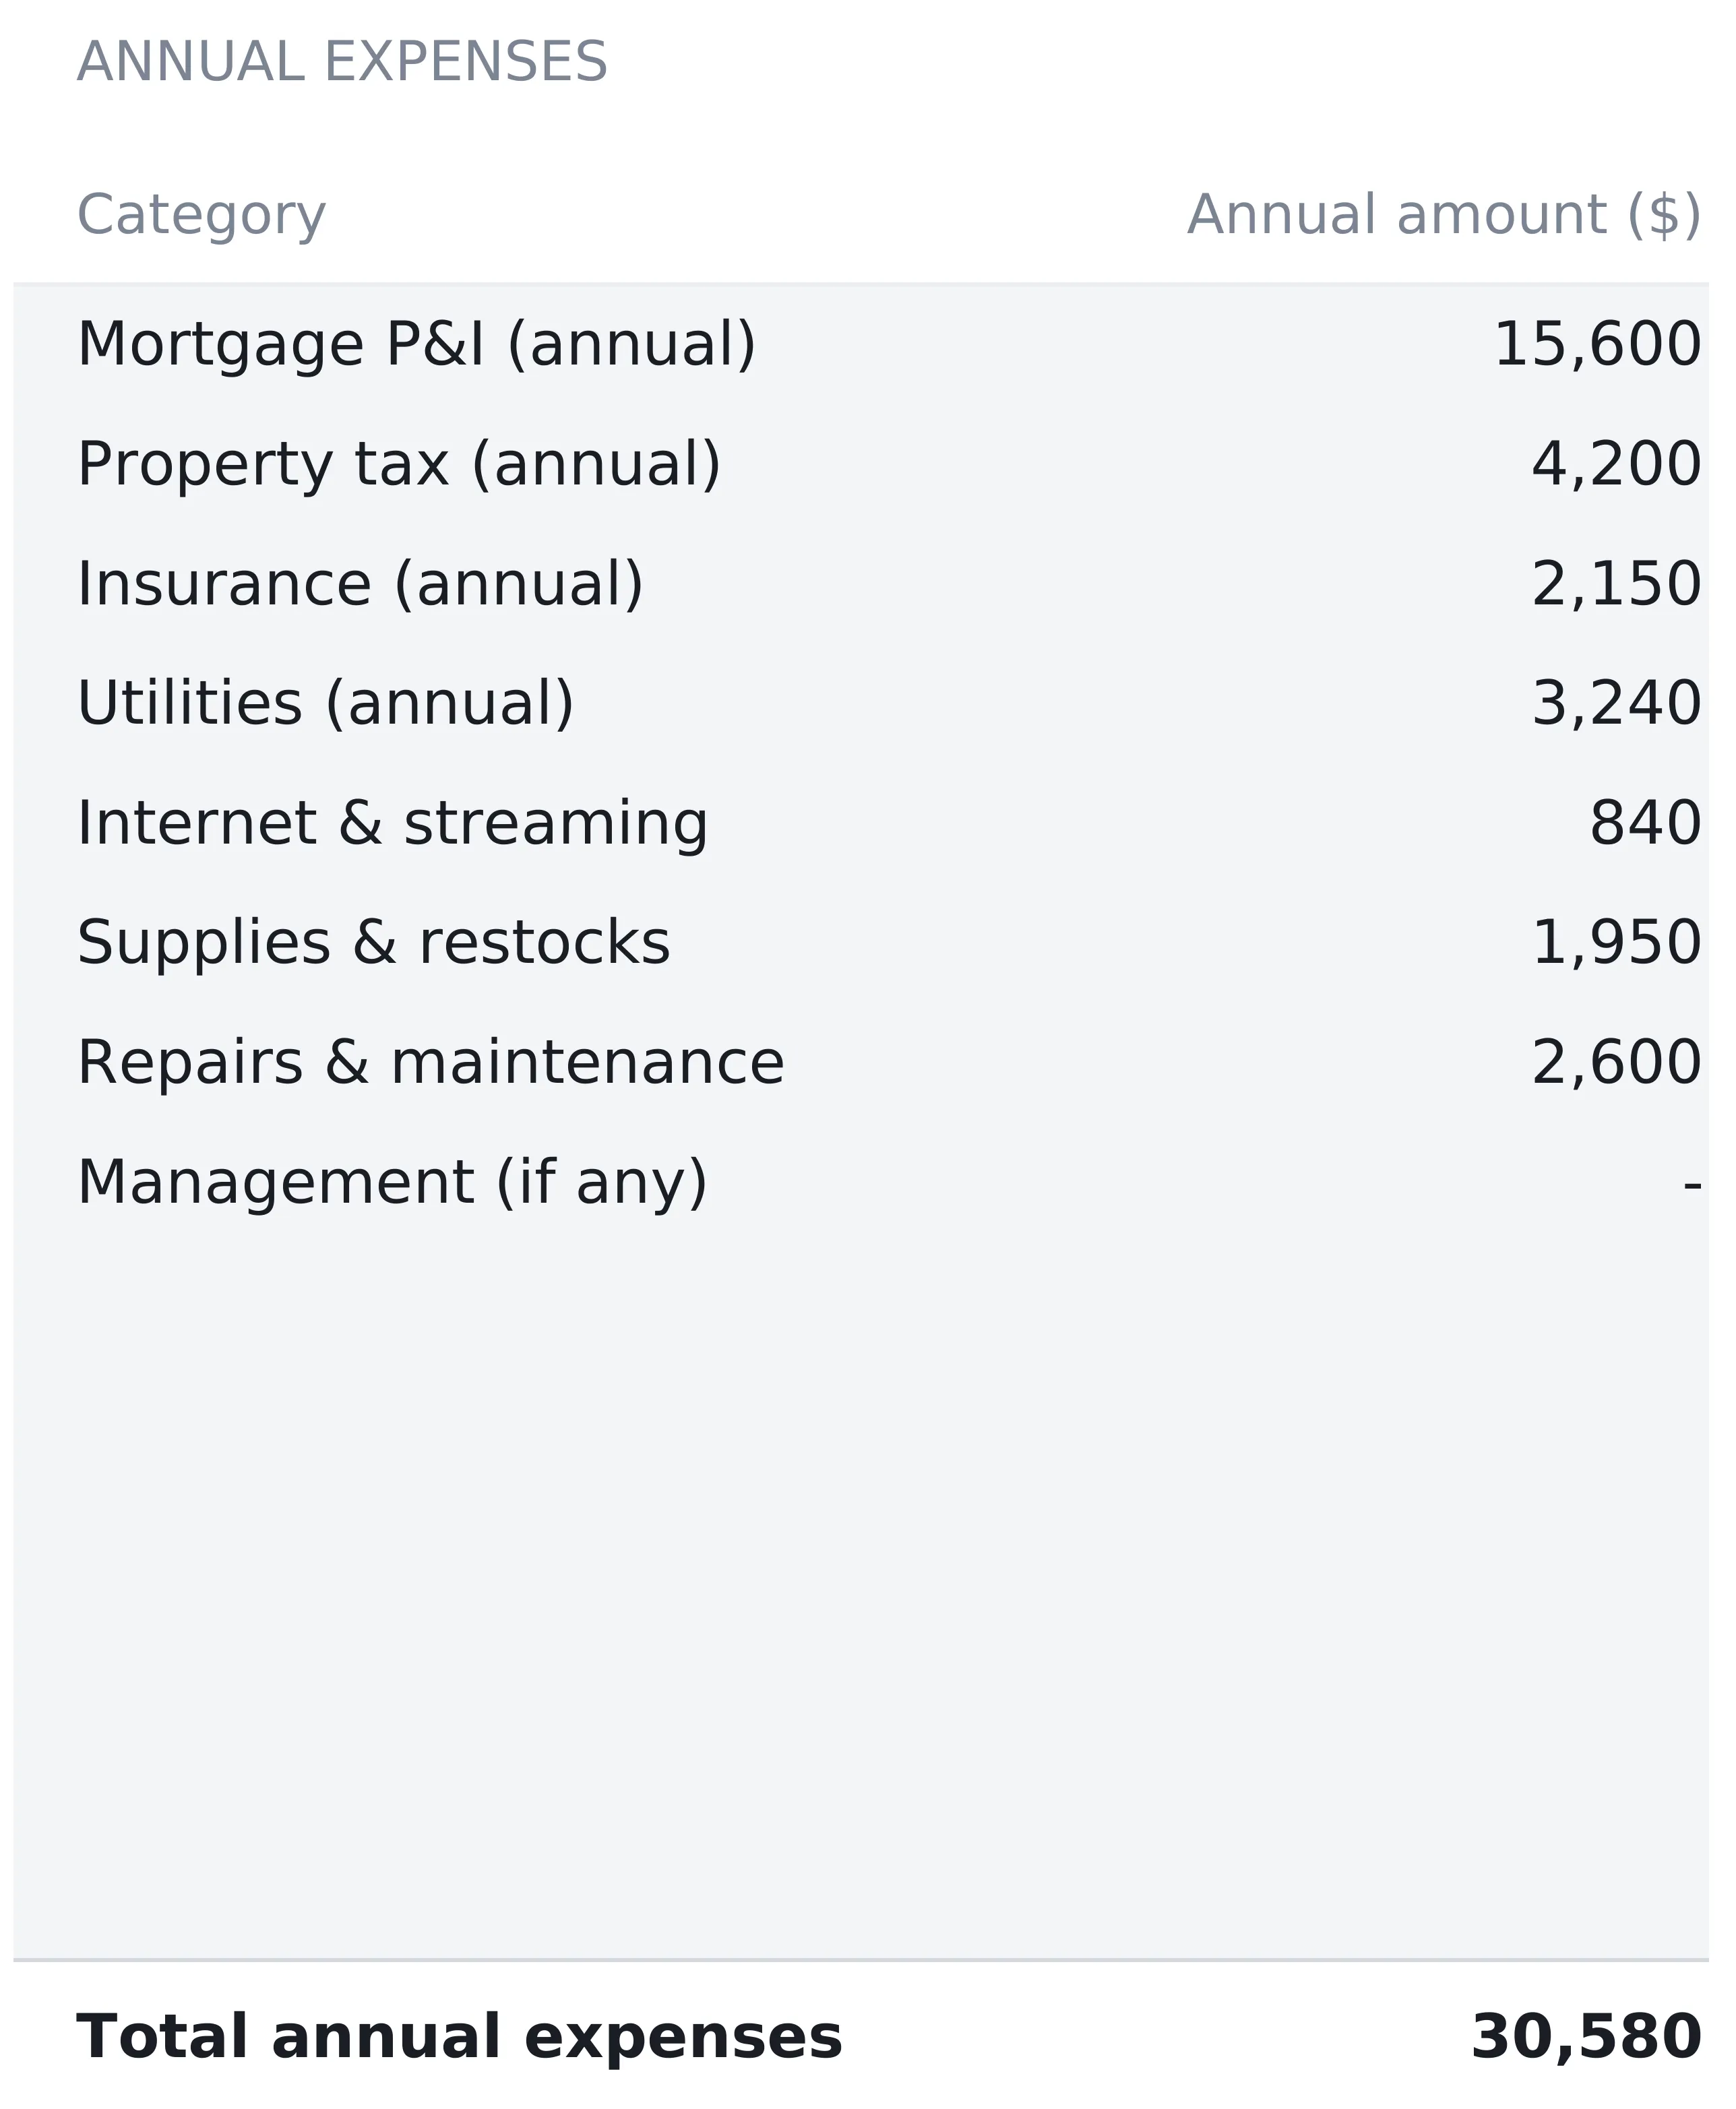
Operating costs live on their own sheet as simple annual amounts, one row per category. The sample cabin’s list:
| Category | Annual amount ($) |
|---|---|
| Mortgage P&I | 15,600 |
| Property tax | 4,200 |
| Insurance | 2,150 |
| Utilities | 3,240 |
| Internet & streaming | 840 |
| Supplies & restocks | 1,950 |
| Repairs & maintenance | 2,600 |
| Management | 0 |
| Total | 30,580 |
Cleaning is deliberately absent: it is a per-booking cost handled on Settings, so listing it here again would double-count it. That split is the habit worth copying. Costs that scale with bookings behave nothing like costs that arrive regardless, and keeping them apart is what lets the sheet show how profit responds to occupancy. As on the ledger, blank rows are spare; naming one puts it straight into the total and the dashboard.
The dashboard: eight numbers and a verdict
With the three input sheets filled, the dashboard computes the year:
| Metric | Sample value | How it is derived |
|---|---|---|
| Gross revenue | $51,380 | Sum of every stay’s gross |
| Net revenue | $40,063 | Gross after platform fees and cleaning |
| Occupancy | 56.4% | Nights booked ÷ nights available |
| ADR | $259 | Gross ÷ nights booked |
| RevPAR | $146 | Gross ÷ nights available |
| Expenses | $30,580 | Annual operating total |
| Annual profit | $9,483 | Net revenue - expenses |
| Monthly profit | $790 | Annual profit ÷ 12 |
A status line above the tiles states the year in one sentence, and it flips to a warning when expenses outrun net revenue. A listing that has slipped underwater says so the moment the file opens. Below the tiles, two charts plot nights booked and gross revenue by month, which is where the July peak and the November trough become visible at a glance.
The profit line is the number no platform dashboard shows. Airbnb reports payouts; it has no idea what the mortgage costs. In the sample, a listing that grossed $51,380 kept $9,483, and seeing those two numbers on the same screen is most of the reason to track any of this.
ADR, RevPAR, and occupancy in plain terms
Three metrics carry the industry’s jargon, and all three are divisions of numbers the ledger already holds.
Occupancy (198 ÷ 351 = 56.4 percent) is how full the calendar was.
ADR, average daily rate ($51,380 ÷ 198 = $259), is what a night earns when it sells.
RevPAR, revenue per available rental night ($51,380 ÷ 351 = $146), is what the calendar earns once the empty nights are counted too.
Because ADR and RevPAR divide the same gross by different night counts, RevPAR always equals ADR times occupancy ($259 × 56.4% ≈ $146). That identity is what makes RevPAR the harder number to flatter. A listing can post a strong ADR by selling peak weekends only, and its RevPAR still carries the quiet months. That is why two listings with opposite pricing strategies compare more cleanly on RevPAR than on either number alone.
Where the data ends up at tax time
For US hosts, the expense categories above map onto tax reporting. Rental income generally lands on Schedule E, while short-term rentals that come with substantial guest services can fall under Schedule C instead. IRS Publication 527 covers residential rental property including vacation homes, and a tax professional can confirm which schedule fits a specific listing. Either way, arriving at year-end with income and categorized expenses already totaled turns filing prep into a copy job rather than a reconstruction.
Excel or Google Sheets for a short-term rental tracker
The tracker is an .xlsx file built on plain formulas, with no macros and no add-ons, so it runs identically in Microsoft Excel and in Google Sheets after upload. Sheets suits hosts who log bookings from a phone between turnovers; Excel suits those who prefer a local file. The structure described here is equally buildable in either.
Which tracker fits which host
- Airbnb / STR Tracker Spreadsheet Template ($39) is the workbook this walkthrough follows: the bookings ledger, settings, expenses, monthly performance, and the eight-metric dashboard, ready to use for a single listing.
- The free Airbnb Rental Tracker fits hosts who want a booking log and nothing else for now, and there is an Ultimate version ($29) in the same family.
- Rental Property Analysis ($59) answers the question that comes before any of this tracking: whether a property pencils out as a purchase, with NOI, cap rate, DSCR, and a 10-year cash flow projection. The ROI math behind that decision is its own walkthrough.
Related
- Rental Property Cash Flow Spreadsheet (Excel, Per-Unit Tabs) - the long-term-tenant version of this structure, with a tab per unit
- How to Calculate ROI on a Rental Property - cash-on-cash return and cap rate before you buy
- Cash Flow Forecast Template for Business - the same monthly rollup applied to a small business
Frequently asked questions
What is the difference between ADR and RevPAR?
Both divide the same gross revenue, but by different night counts. ADR (average daily rate) divides by the nights that sold and answers "what does a sold night earn?" RevPAR (revenue per available rental night) divides by all nights the listing was available and answers "what does the calendar as a whole earn?" Because of that, RevPAR always equals ADR multiplied by occupancy.
Does this work for VRBO or direct bookings?
The structure is platform-agnostic: a stay is a check-in date, a night count, and a nightly rate wherever it was booked. The tracker applies one platform fee percentage from Settings to every stay, so a host mixing platforms with different fee levels would pick a single blended percentage rather than a per-booking one.
Can one spreadsheet track multiple listings?
The tracker runs one listing per file: Settings holds a single listing name, nights-available figure, and fee setup. A second listing is a second copy of the file. Portfolio hosts sometimes keep a separate hand-built summary sheet that collects the annual totals from each file.
Where do guest-paid cleaning fees fit?
The ledger computes gross as nights times nightly rate, and treats cleaning as a per-booking cost set on Settings, which models the host paying a cleaner per turnover. One approach for hosts who charge guests a cleaning fee is to average it into the nightly figure so gross reflects the full payout; the per-booking cost then still captures what the cleaner is paid.
Does Airbnb income go on Schedule E or Schedule C?
In the US it depends on the situation, mainly on whether substantial services are provided to guests (regular cleaning during stays, meals, concierge-style service). Rental income generally goes on Schedule E, while short-term rentals with substantial services can fall under Schedule C. IRS Publication 527 covers residential rental property including vacation homes; a tax professional can confirm which applies to a specific listing.
Sources
- About Schedule E (Form 1040), Supplemental Income and Loss - Internal Revenue Service
- About Publication 527, Residential Rental Property - Internal Revenue Service
About this article
Every figure, column name, formula, and feature description checked on 2026-09-10 against the shipped Airbnb / STR Tracker workbook (Dashboard, Bookings, Performance, Expenses, Settings, How to Use sheets), the exact file customers download. Schedule E and Publication 527 references checked against the live IRS pages at writing time. Last reviewed September 2026.