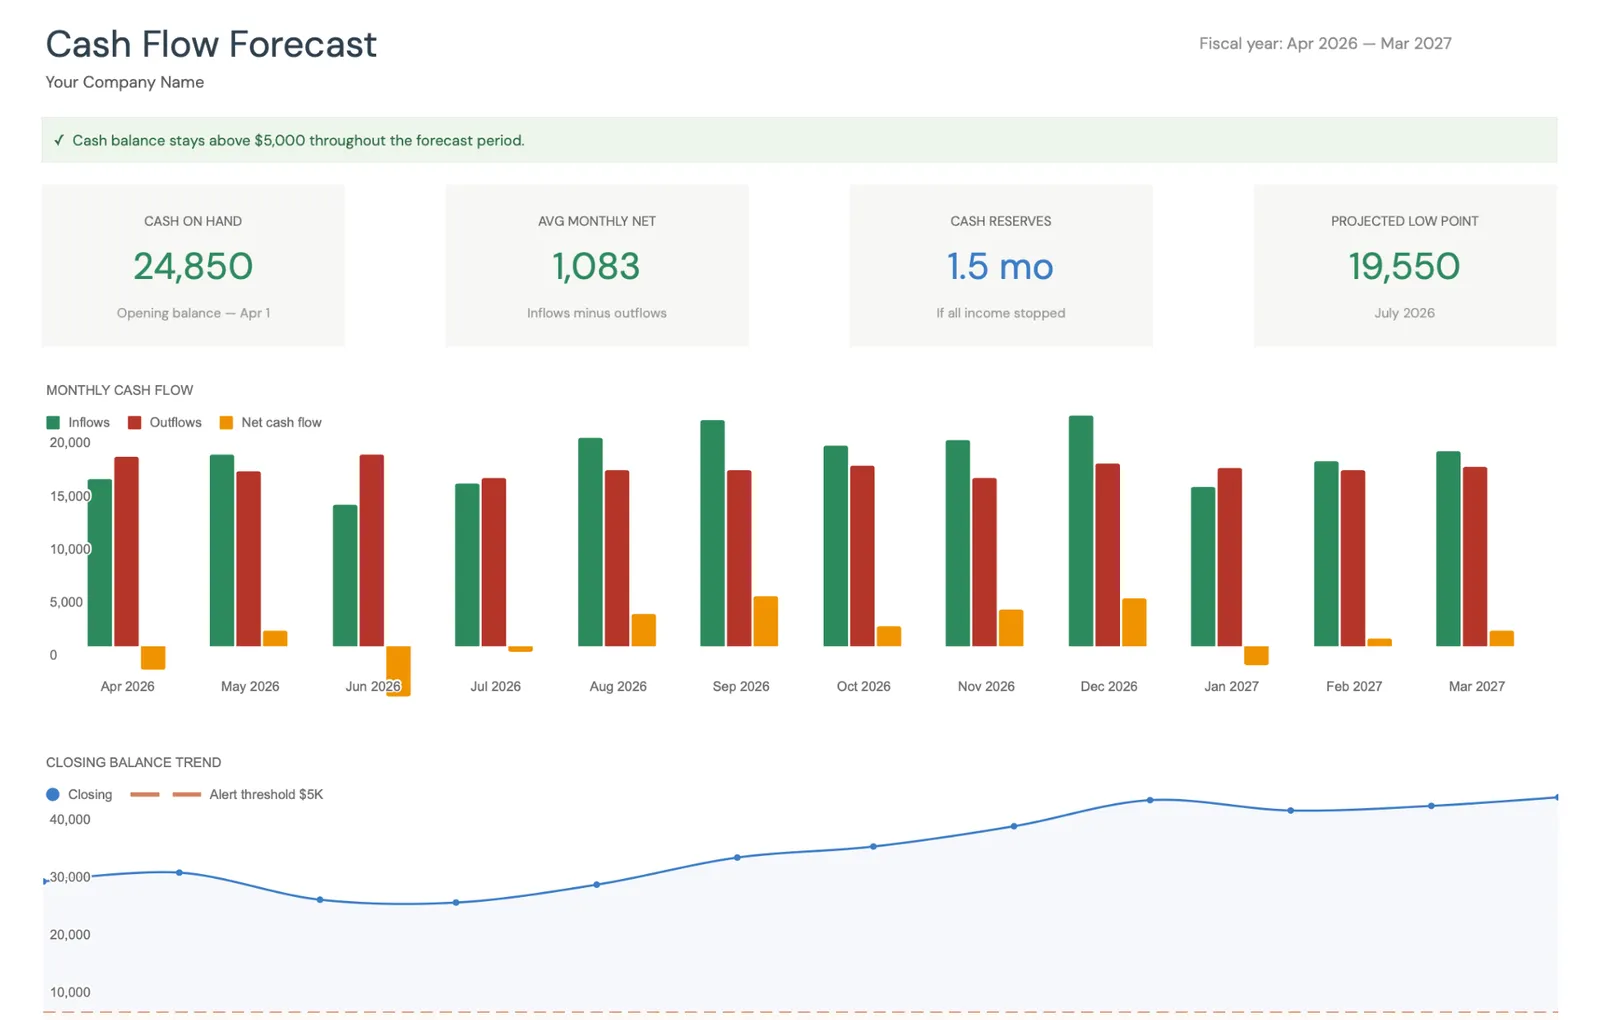
Announcing the Cash Flow Forecast Template - a Google Sheets spreadsheet for projecting 12 months of business cash flow, comparing forecast vs actuals, and stress-testing scenarios.
Most businesses don’t fail because they’re unprofitable. They fail because they run out of cash at the wrong time.
The gap between “profitable on paper” and “can actually pay the bills this month” is where things get uncomfortable, and that gap is exactly what a cash flow forecast is meant to close. The new Cash Flow Forecast Template projects 12 months of business cash flow in Google Sheets, with scenario planning, actuals tracking, and a built-in dashboard.
Why Cash Flow Deserves Its Own Tool
Revenue and expenses tell part of the story. Cash flow tells the rest. When does the money actually arrive? When do the bills actually hit? What happens if that big client pays late?
These aren’t abstract questions. For a seasonal business heading into a slow quarter, or a freelancer waiting on an invoice, or a startup watching its runway - the answers matter right now.
Spreadsheets are the natural home for this kind of thinking. They’re flexible, private, and you own them completely. But building a good cash flow model from scratch takes time and spreadsheet skill that not everyone has, which is why many people start from a ready-made forecast template instead.
That’s what this template is for.
What’s Inside
A dashboard that tells the truth. Cash on hand, average monthly net, months of reserves, projected low point - all on one screen. A chart plots inflows against outflows across the year. No digging through tabs to understand your position.
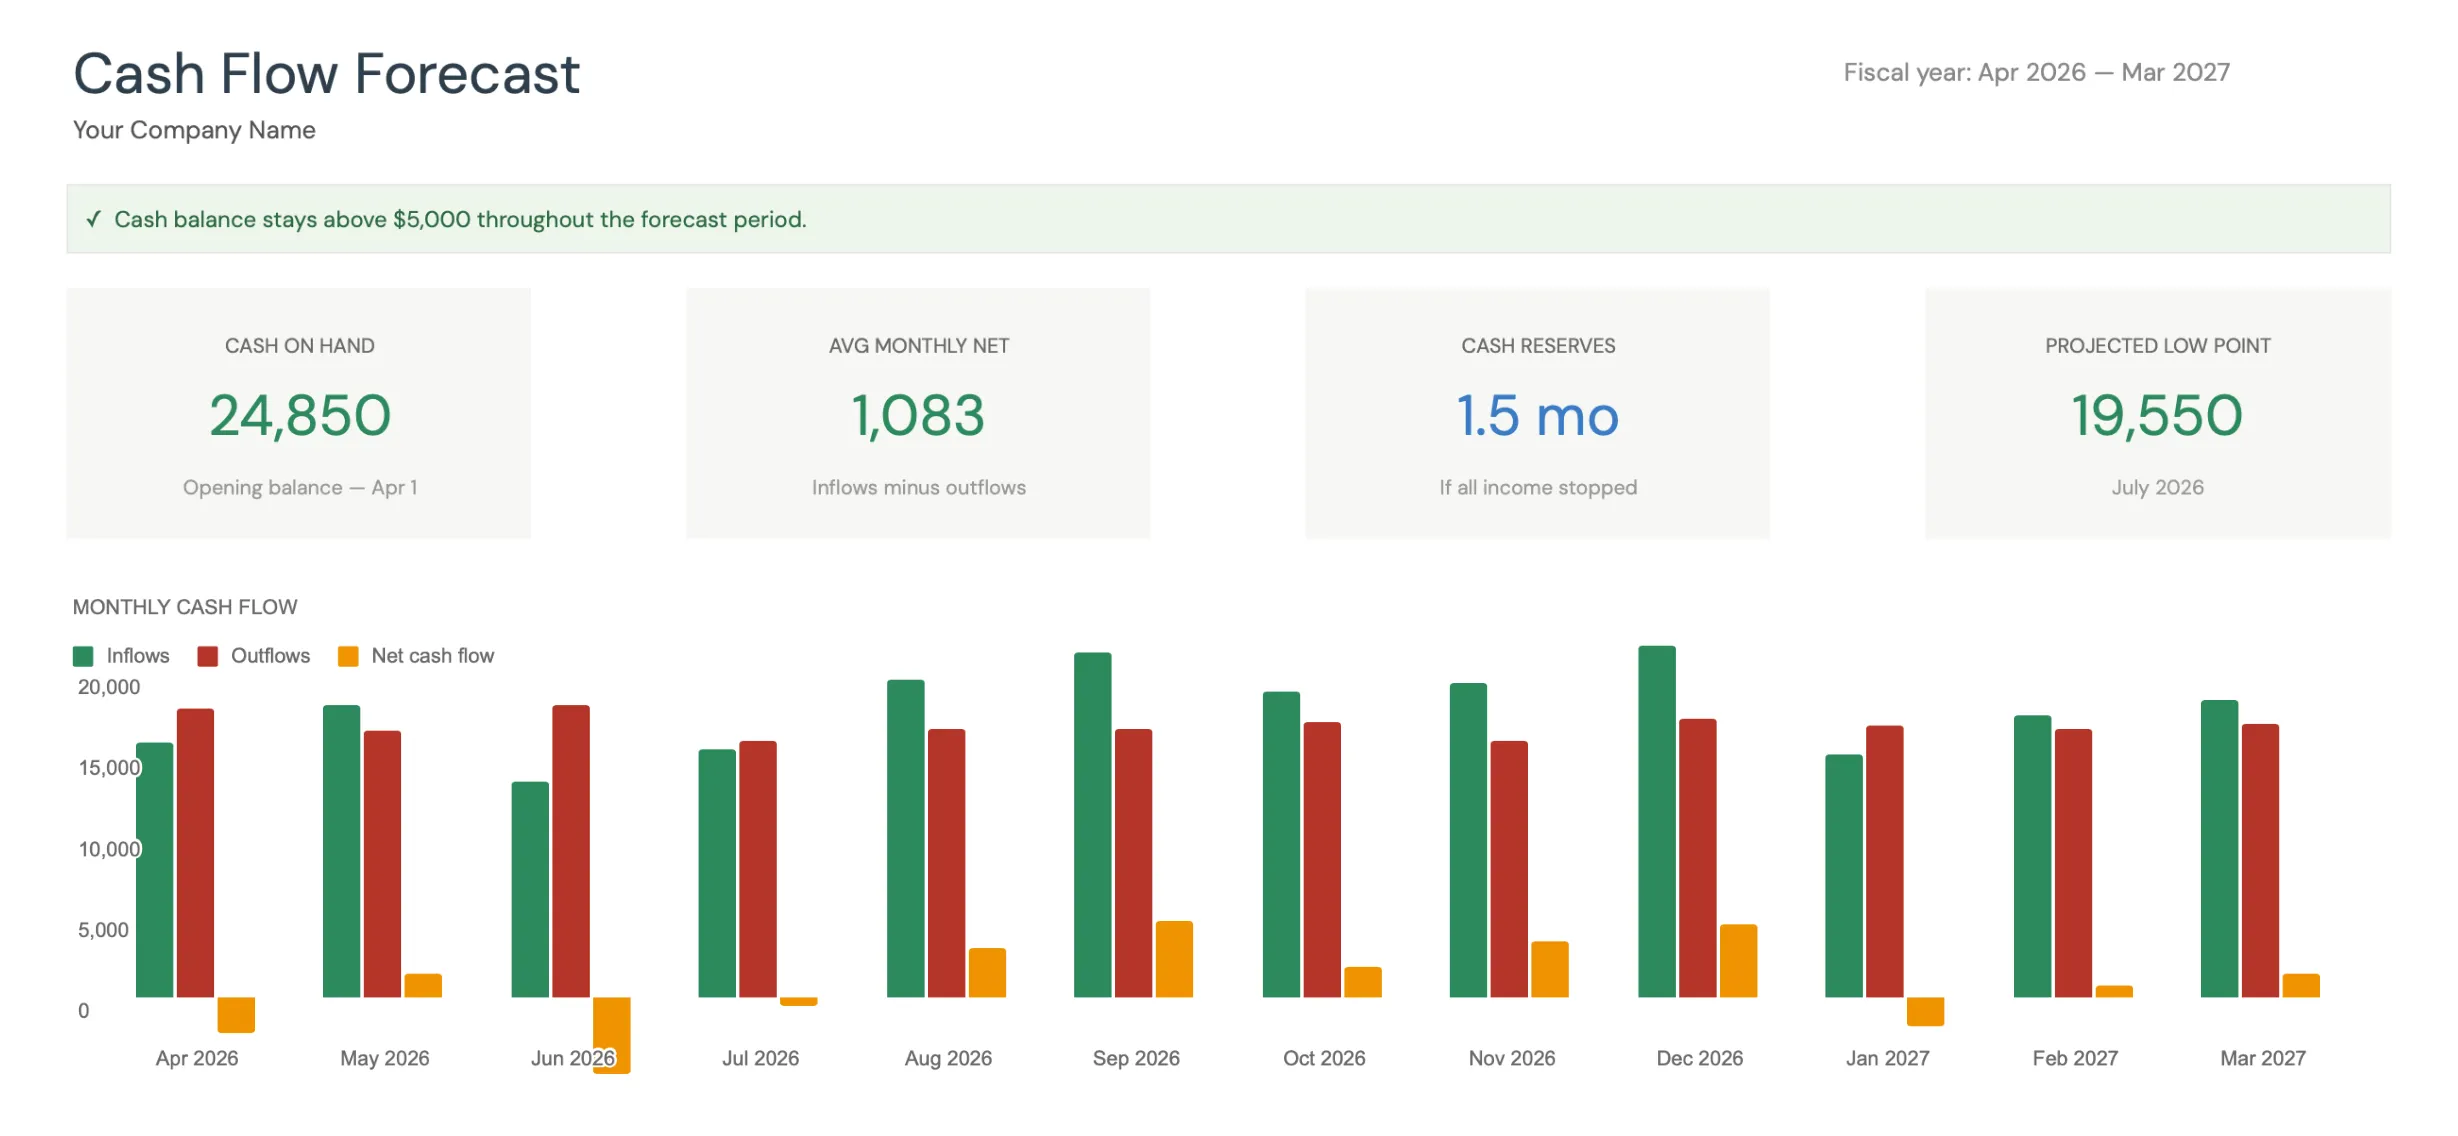
12 months of forecast. Revenue, other income, and categorized expenses - month by month, across your full fiscal year. Net cash flow and closing balances calculate automatically. The point isn’t precision - it’s visibility. Seeing that cash gets tight in August gives you months to prepare, not days.
Actuals that build over time. Each month, you record what actually happened alongside what you projected. Same categories, same layout, instant comparison. Over time, this becomes a real history of how your business actually moves cash - not just what you hoped would happen.
KPIs that keep you honest. Forecast accuracy percentage, cumulative variance, months recorded. A simple way to see whether your projections are getting better or whether something needs rethinking.
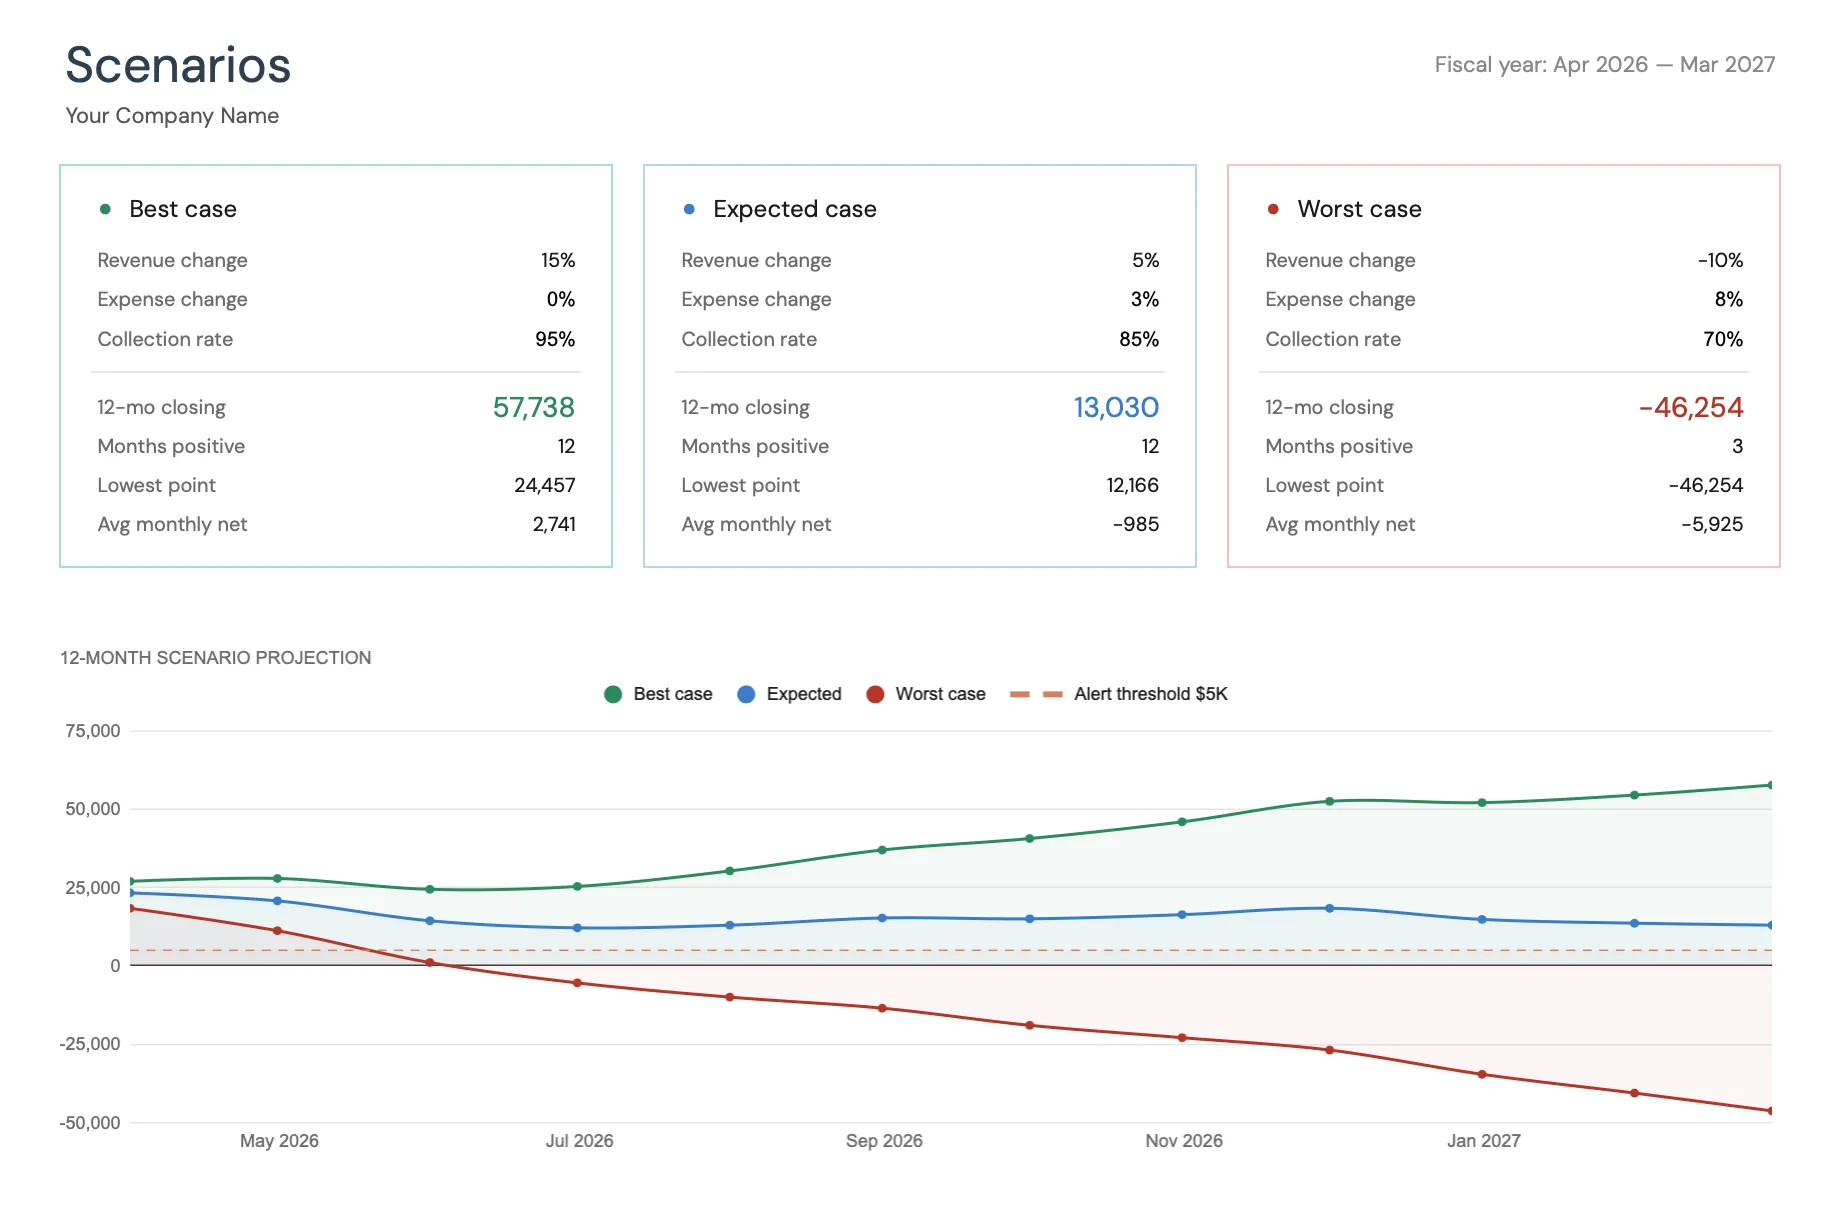
Scenario planning. Best case, expected, worst case - each with your own assumptions for revenue change, expense change, and collection rates. Three projection lines on one chart, with a low-cash alert threshold visible. Useful for answering “what if” questions without building three separate spreadsheets.
Variance breakdown. Where did forecast and reality diverge? The template breaks it down by revenue, other income, and outflows - so you can see whether the gap came from the top line, spending, or both.
Who This Is For
Seasonal businesses. Tourism, retail, landscaping, event planning - if revenue swings month to month, the 12-month view makes slow periods visible long before they arrive.
Freelancers and consultants. When income is project-based, mapping expected revenue against fixed costs gives you a clearer picture of your runway. Knowing you have three months of coverage feels different from guessing.
Early-stage startups. Cash runway is the number that matters most, and a quick estimate of it is easy with our financial runway calculator. Scenario planning then lets you model what happens if revenue ramps slower than expected, or if that funding round takes an extra month to close.
Businesses preparing for financing. Lenders and investors want to see projections. This gives you a structured, presentable format - not a messy spreadsheet you built at midnight.
Side businesses. Even a small operation benefits from knowing when cash might run low. The setup takes about 15 minutes, which makes it practical even when this isn’t your full-time focus.
Businesses in transition. New hires, office moves, equipment upgrades - major expenses land differently when you can see their impact on your cash position across the full year.
Getting Started
- Copy to Google Sheets - instant access after purchase, nothing to install
- Configure your business - fiscal year, opening balance, expense categories, scenario assumptions (about 15 minutes)
- Enter your forecast - projected revenue and expenses, month by month
- Update monthly - record actuals as each month closes
Everything else updates automatically: dashboard, charts, KPIs, and scenario projections.
The Usual FinancialAha Setup
One-time purchase. No subscriptions. Your data stays in your Google account - we never see it. Free updates for life. Works on desktop and mobile.
We put a lot of care into this one. If you run a business and want to see where your cash is headed, take a look.
Get the Cash Flow Forecast Template →
Related
- Cash Flow Forecast Template - Full product page with details
- How to Forecast Cash Flow for Your Small Business - Detailed cash flow forecasting guide
- Cash Flow Forecast Templates for Small Business - How ready-made forecast templates compare
- Google Sheets vs Excel for Business Cash Flow - Which platform fits your workflow
- Personal Budget vs Business Cash Flow Template - When you need one, the other, or both
- QuickBooks vs Wave for Freelancers - Where accounting apps fit against a forecast sheet
- Rental Property Cash Flow Spreadsheet - The same cash flow model applied to a rental
Frequently asked questions
How is this different from a budget template?
A budget tracks planned vs. actual spending. A cash flow forecast projects when cash moves in and out of your business over 12 months, focusing on timing, not just totals.
How long does initial setup take?
About 15 minutes. Enter your opening balance, configure expense categories, set scenario assumptions, and enter your first month's forecast.
Can I use this for a side business or freelance work?
Yes. Inflows are entered on three fixed rows: revenue / sales, other income, and loans / investment. A solo freelancer with project-based income and a larger business with several revenue streams fill in the same grid, with multiple streams combined into the monthly revenue figure.
How often should I update the forecast?
Monthly works well for most businesses. Record actuals as each month closes, review variance, and adjust future projections based on what you've learned.
Does it work for seasonal businesses?
That's one of the primary use cases. The 12-month view makes slow periods visible months in advance, and scenario planning lets you model different revenue assumptions.
Does this work in Excel or only Google Sheets?
It's built for Google Sheets. After purchase you copy it into your own Google account, and the dashboard, charts, and scenario projections work without any add-ons or installs.
What does the low-cash alert threshold do?
You set a cash level you'd rather not drop below, and the scenario chart draws it as a line so you can see which months in the best, expected, and worst case fall under it.
About this article
Template sheets, inputs and outputs checked on 2026-09-10 against the shipped Cash Flow Forecast Google Sheet (Dashboard, Forecast, Actual, Scenarios, Settings, Instructions and Helpers tabs). Google Sheets compatibility verified on 2026-09-10 against FinancialAha product data. Last reviewed September 2026.