
Google Sheets fits freelancers and any business where partners, a bookkeeper, and an accountant share one live view, and it is free. Excel earns its roughly $100-a-year cost when you import bank and accounting data with Power Query or model many what-if scenarios at once. Most small businesses can run cash flow in either, and both open each other's files, so the spreadsheet's structure matters more than the platform.
Cash flow tracking looks completely different depending on the kind of business you run. A freelance graphic designer worrying about whether two clients will pay this month has nothing in common with a landscaping company trying to survive winter. The platform you use needs to match the actual shape of your cash flow problem.
Our templates work in Google Sheets. The Cash Flow Forecast Template is built for Google Sheets: a 12-month Forecast grid, an Actual grid that mirrors it month by month, a Dashboard reporting cash on hand and the projected low point, and the link sharing that comes with Sheets. There is no Excel version of the file.
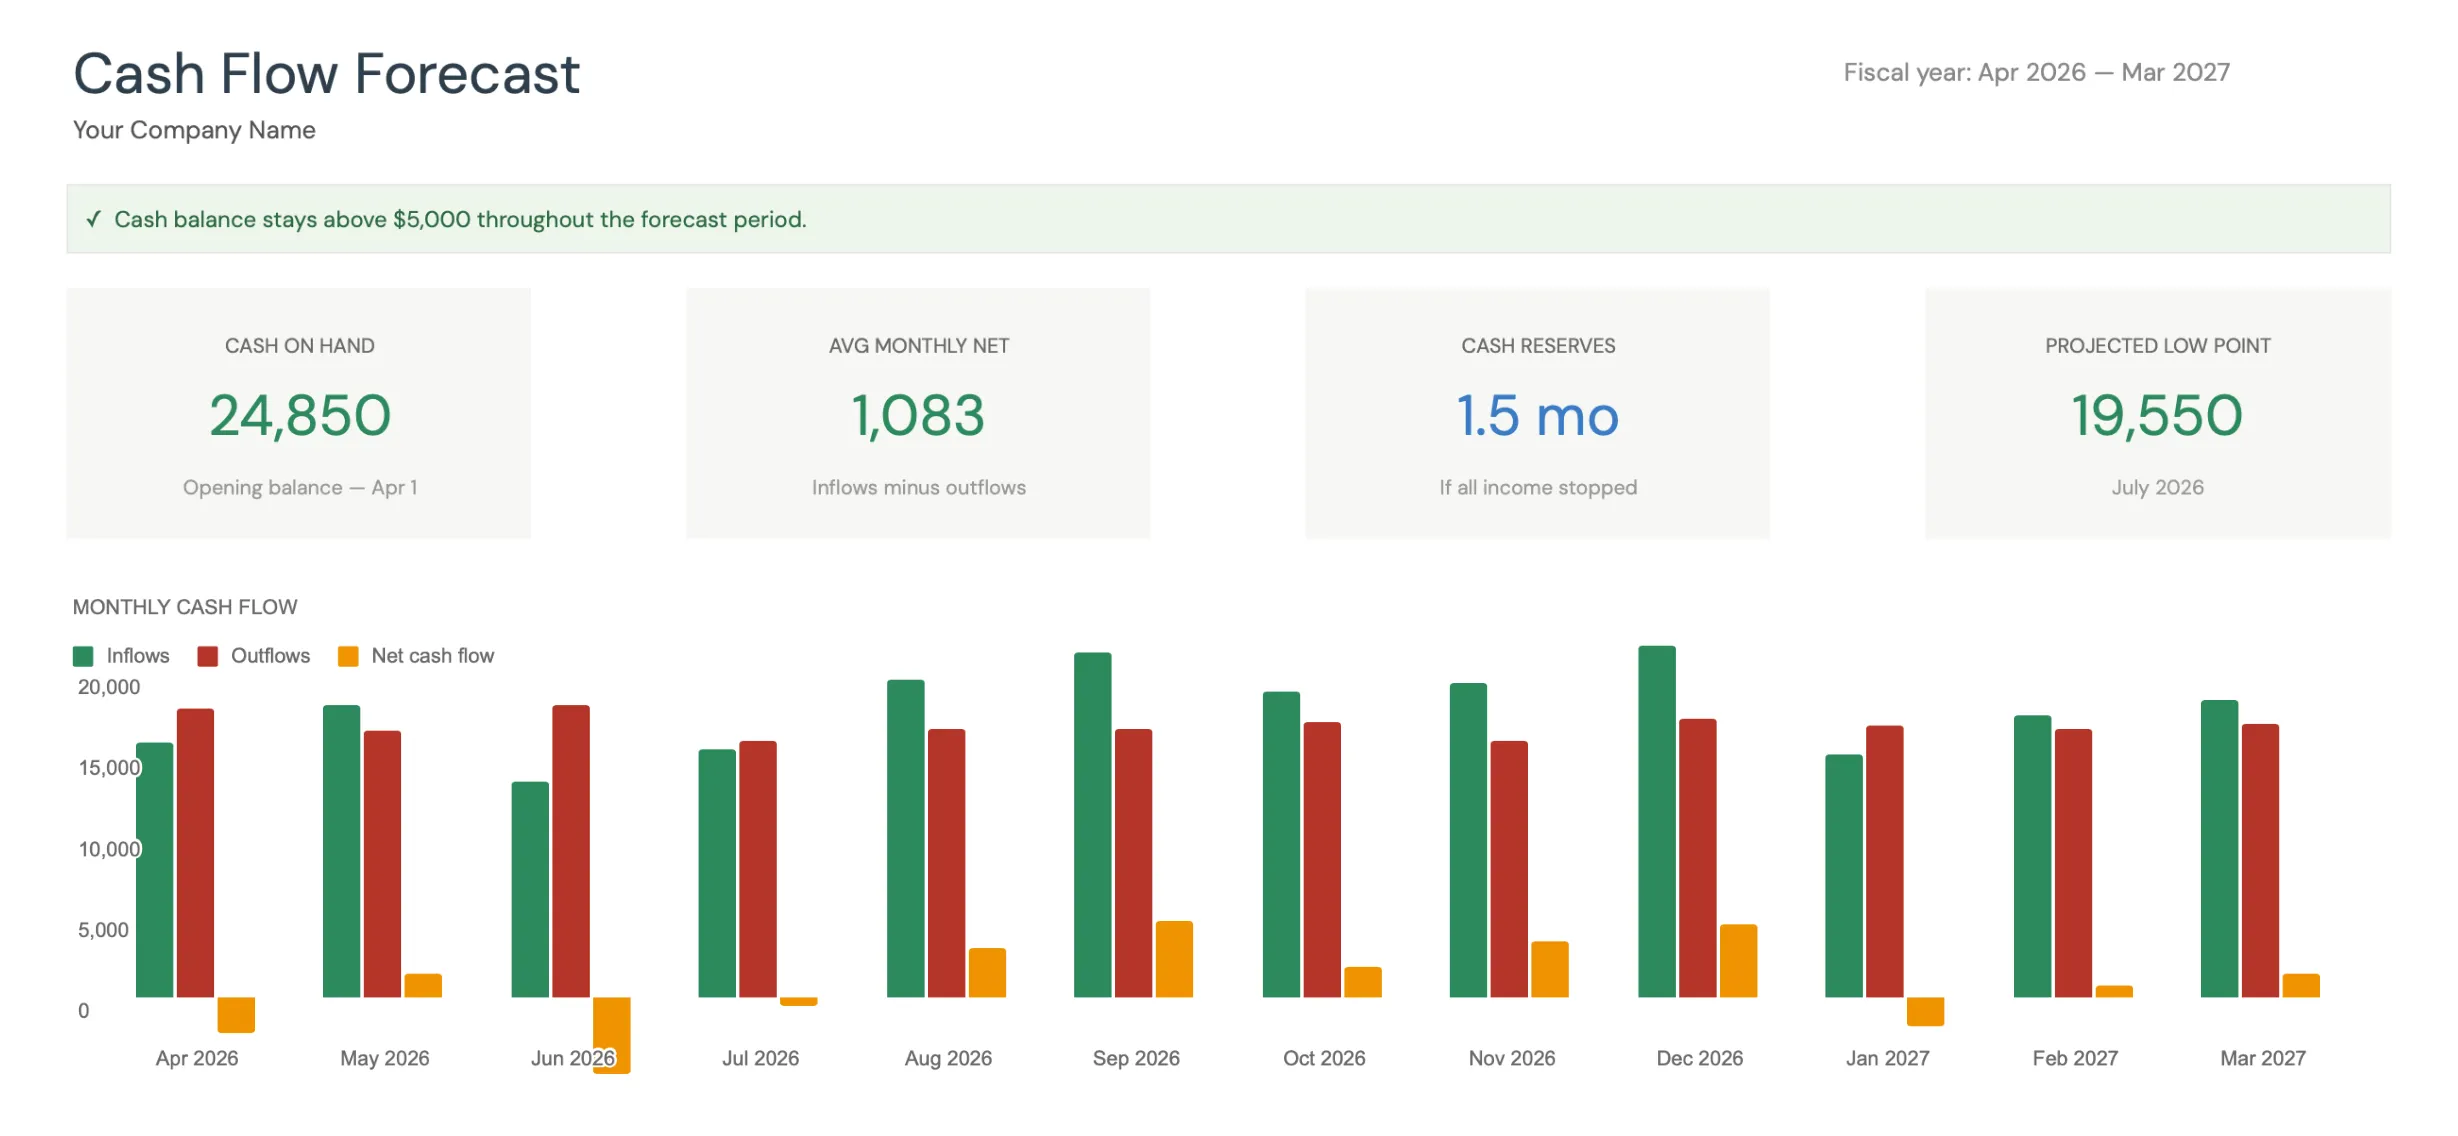
The Cash Flow Forecast Template (Premium tier) puts a 12-month projection, running KPIs, and monthly inflow-versus-outflow bars on one dashboard tab. The sample figures shown are placeholder data.
The Freelancer
A freelancer’s cash flow problem is simple to describe and hard to live with: income is irregular, expenses are mostly steady, and the gap between invoicing and getting paid can be weeks or months.
Google Sheets handles this well, and there are a few reasons it tends to be the natural fit. First, cost. Freelancers are often careful about recurring expenses, and Google Sheets is free with a Google account. That matters when you’re weighing a Microsoft 365 subscription, priced at $99.99 a year for the Personal plan, against every other business expense. (Managing income that arrives on no fixed schedule is its own challenge whichever platform you pick.)
Second, access. Freelancers work from coffee shops, co-working spaces, client offices, home. A cash flow tracker that lives in the cloud and opens on any device, including a phone checked during a lunch break, matches how freelancers actually work. Checking whether a client payment cleared while waiting for a meeting? That’s a phone-and-Google-Sheets moment, not a boot-up-Excel moment.
Third, the tracking itself is simple. Most freelancers have a handful of clients, a few recurring expenses, and maybe some irregular ones (software subscriptions, equipment). A straightforward income-vs-expenses layout with a running balance covers it. There’s no need for advanced modeling tools.
Where it can get tricky: tax estimates. Freelancers need to set aside money for quarterly taxes, and projecting those amounts means estimating annual income partway through the year. The platform trade-offs for that recurring tax work get a fuller look in Google Sheets vs Excel for tax planning. Both platforms handle this math equally, but if a freelancer also wants to track business mileage, categorize expenses for Schedule C, and model different income scenarios, the spreadsheet starts growing. A purpose-built layout like the Freelancer Finance Suite keeps income, expenses, projects, and a tax reserve on separate tabs so the file stays organized as it does. At that point, the platform matters less than the structure of the spreadsheet itself.
The Small Business with Employees
Once a business has employees, cash flow gets more rigid. Payroll is non-negotiable: people need to get paid on time, every time. This changes the nature of the cash flow problem from “can I cover my own expenses” to “can I cover payroll two weeks from now regardless of what happens with receivables.” Keeping the payroll numbers themselves in a dedicated Payroll Tracker and feeding the totals into a cash flow view keeps the two jobs separate.
Excel starts to earn its keep here. Small businesses with employees typically interact with more systems - payroll processors, accounting software, bank accounts, payment platforms. Excel’s Power Query can connect to these sources and transform messy CSV exports into clean data. Set up the transformation once, and refreshing takes a click. If you’re pulling in weekly transaction data from a bank, monthly reports from QuickBooks, and payment records from Stripe or Square, Power Query saves real time compared to manual data entry or Google Sheets’ more limited import tools.
The modeling demands also increase. A business with 5-10 employees might need to forecast cash flow under different scenarios: what happens if a major client delays payment by 30 days? What if you need to hire someone next quarter? What’s the cash impact of switching health insurance plans? Excel’s Data Tables make it possible to run multiple what-if scenarios simultaneously without duplicating the entire model. Goal Seek and Solver help answer backward questions like “what revenue do we need in March to cover April payroll plus the equipment purchase?”
That said, scenario modeling is not exclusively an Excel job. Our Cash Flow Forecast Template runs best, expected, and worst-case scenarios in Google Sheets, each driven by a revenue-change, expense-change, and collection-rate input, so many businesses get the what-if view they need without leaving the collaborative platform.
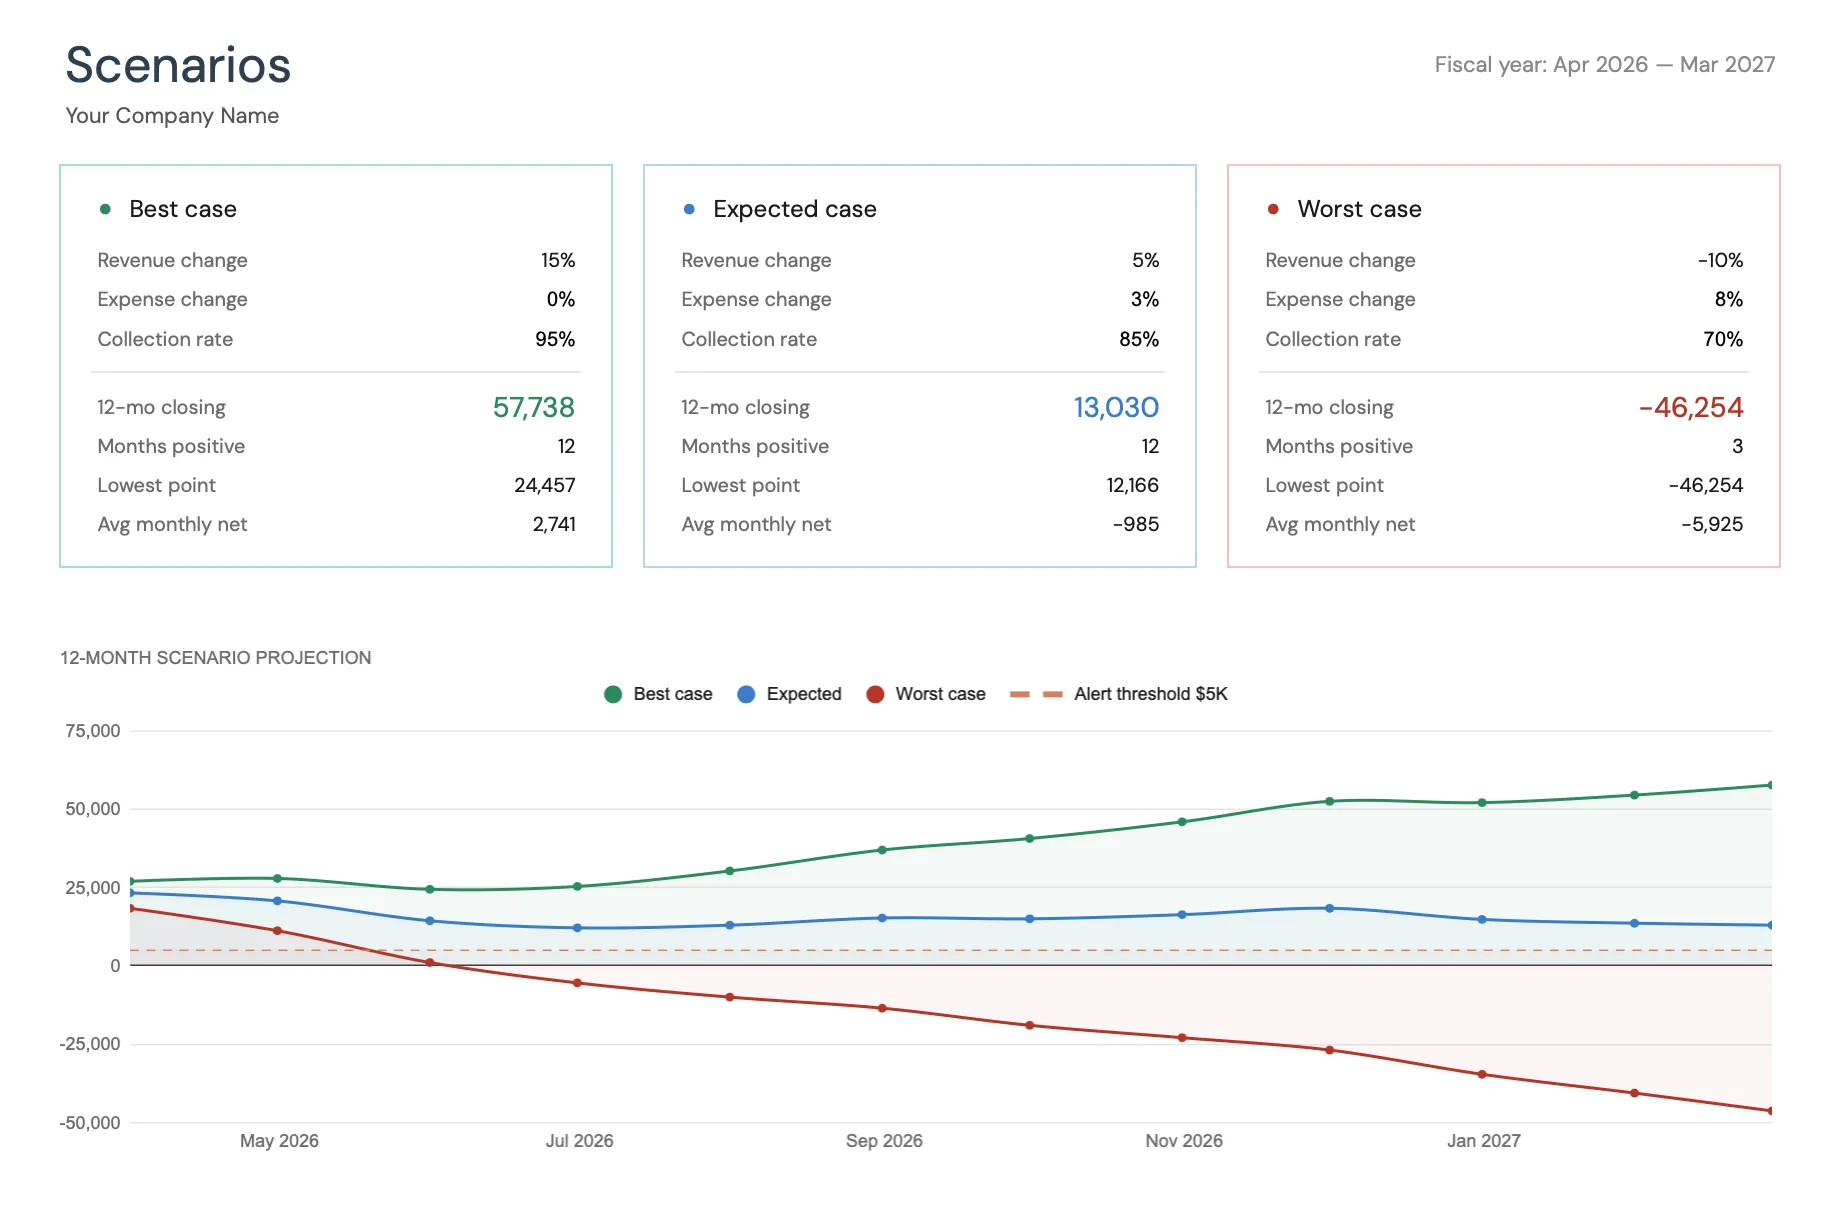
The Cash Flow Forecast Template’s Scenarios tab (Premium tier) models best, expected, and worst-case outcomes side by side in Google Sheets. The sample figures shown are placeholder data.
Google Sheets still works for small businesses with employees, especially when collaboration matters. If a business has two co-founders and a bookkeeper all interacting with cash flow data, Google Sheets’ real-time sharing avoids the version-control headaches that plague shared Excel files. And when it’s time to sit down with an accountant, sharing a link beats emailing a file.
The practical trade-off: Google Sheets is easier to share, Excel is easier to feed with data from other systems. For a business where the owner does everything themselves and collaboration isn’t a factor, Excel’s data tools have more pull. For a business where three people touch the cash flow spreadsheet regularly, Google Sheets’ collaboration model removes genuine friction.
The Seasonal Business
Seasonal businesses have the most interesting cash flow challenge: long stretches where money flows in one direction. A landscaping company earns most of its revenue from April through October. A ski rental shop peaks from December through March. A wedding photographer books heavy from May through September.
The cash flow question for seasonal businesses isn’t “what’s happening this month” but “will the money from busy season last through slow season?” That requires a 12-month view at minimum, and ideally a comparison with prior years to spot trends.
Google Sheets works well for the ongoing monitoring. During busy season, when transactions are flowing daily and the owner wants a quick look at where things stand, the phone-friendly cloud access is practical. GOOGLEFINANCE isn’t relevant here (no stock data needed), but the real-time collaboration features can be useful if a seasonal business has a bookkeeper who enters transactions while the owner reviews projections.
Excel has an edge for the annual planning. Seasonal businesses need to model whether six months of revenue will fund twelve months of expenses - including off-season overhead, equipment maintenance, insurance, and sometimes skeleton-crew payroll. This is fundamentally a forecasting problem, and Excel’s scenario analysis tools handle it cleanly. Build one model with your revenue projection, then test what happens if revenue drops 15% or if you extend the season by a month. Data Tables let you see multiple scenarios in a grid without building separate models for each.
There’s also the lending angle. Seasonal businesses often use lines of credit to bridge slow periods, and lenders want to see cash flow projections in Excel format. Being able to hand over a clean .xlsx file to a banker matters in that context. Google Sheets can export to .xlsx, and the conversion usually works fine for straightforward models, so working in Sheets day-to-day and exporting for the bank is a reasonable approach.
A Note on Growing Into Complexity
Businesses change. A freelancer becomes an agency. A seasonal operation adds a year-round revenue stream. A small business opens a second location.
Some people start tracking cash flow in Google Sheets because it’s free and simple, then find they need Excel’s data import tools as the business grows. Others start in Excel because they came from a corporate background, then switch to Google Sheets when they realize they need their bookkeeper, business partner, and accountant all looking at the same live data.
There’s no penalty for switching. Both platforms use the same formulas. A well-structured Google Sheet exports cleanly to Excel, and vice versa. The important thing is that the tracking actually happens: a simple cash flow spreadsheet that gets updated weekly tells you more about your business than an elaborate model that’s three months out of date.
Template recommendation: The Cash Flow Forecast Template runs in Google Sheets with revenue projections, seven expense categories you can rename on the Settings tab, and a low cash alert that flags any month falling below the threshold you set. It is a Google Sheets file rather than an Excel one, so it fits a business that plans to stay in Sheets.
Related
Frequently asked questions
Can Google Sheets handle cash flow forecasting for a small business?
Yes. Google Sheets handles revenue projections, expense categories, running balances, and cash flow visualizations well for most small businesses. The limits typically show up only with very large datasets or complex multi-entity modeling.
Is Excel better for importing bank and accounting data?
Excel's Power Query is more capable for importing and transforming data from multiple sources - bank exports, accounting software, payment processors. Google Sheets has IMPORTDATA and add-ons that work for simpler imports, but Power Query handles complex data transformations better.
Can multiple business partners view the same cash flow spreadsheet?
Google Sheets excels here. Share a link with view or edit access, and multiple partners can review cash flow data simultaneously from any device. Excel requires OneDrive setup for similar functionality, and the real-time experience is less smooth.
Which is more suitable for presenting cash flow to investors or lenders?
Excel is more common in formal business settings - investors and lenders often expect .xlsx files. Google Sheets can export to Excel format, so you can work in Sheets day-to-day and export when needed for presentations. Both create professional-looking charts and reports.
If I start in Google Sheets, can I move to Excel later without rebuilding?
In most cases yes. Both platforms share the same core formula language, so a well-structured Google Sheet exports to .xlsx and opens in Excel with formulas intact. The pieces most likely to need attention are Sheets-only functions such as IMPORTDATA and QUERY, and heavy conditional formatting, which do not always translate cleanly.
Does the FinancialAha Cash Flow Forecast Template need Excel for scenario modeling?
No. Its Scenarios tab holds best, expected, and worst-case projections that recalculate from the revenue-change, expense-change, and collection-rate assumptions set on the Settings tab, so you can run scenarios without Excel's Data Tables. It is a Google Sheets template, so there is no Excel version of the file.
Sources
- Compare All Microsoft 365 Plans - Microsoft
About this article
Microsoft 365 subscription pricing checked against Microsoft's official plan comparison page Cash Flow Forecast Template sheets, inputs and outputs checked on 2026-09-10 against the shipped Google Sheet (Dashboard, Forecast, Actual, Scenarios, Settings, Instructions tabs); it is a Google Sheets template with no Excel version Last reviewed September 2026.