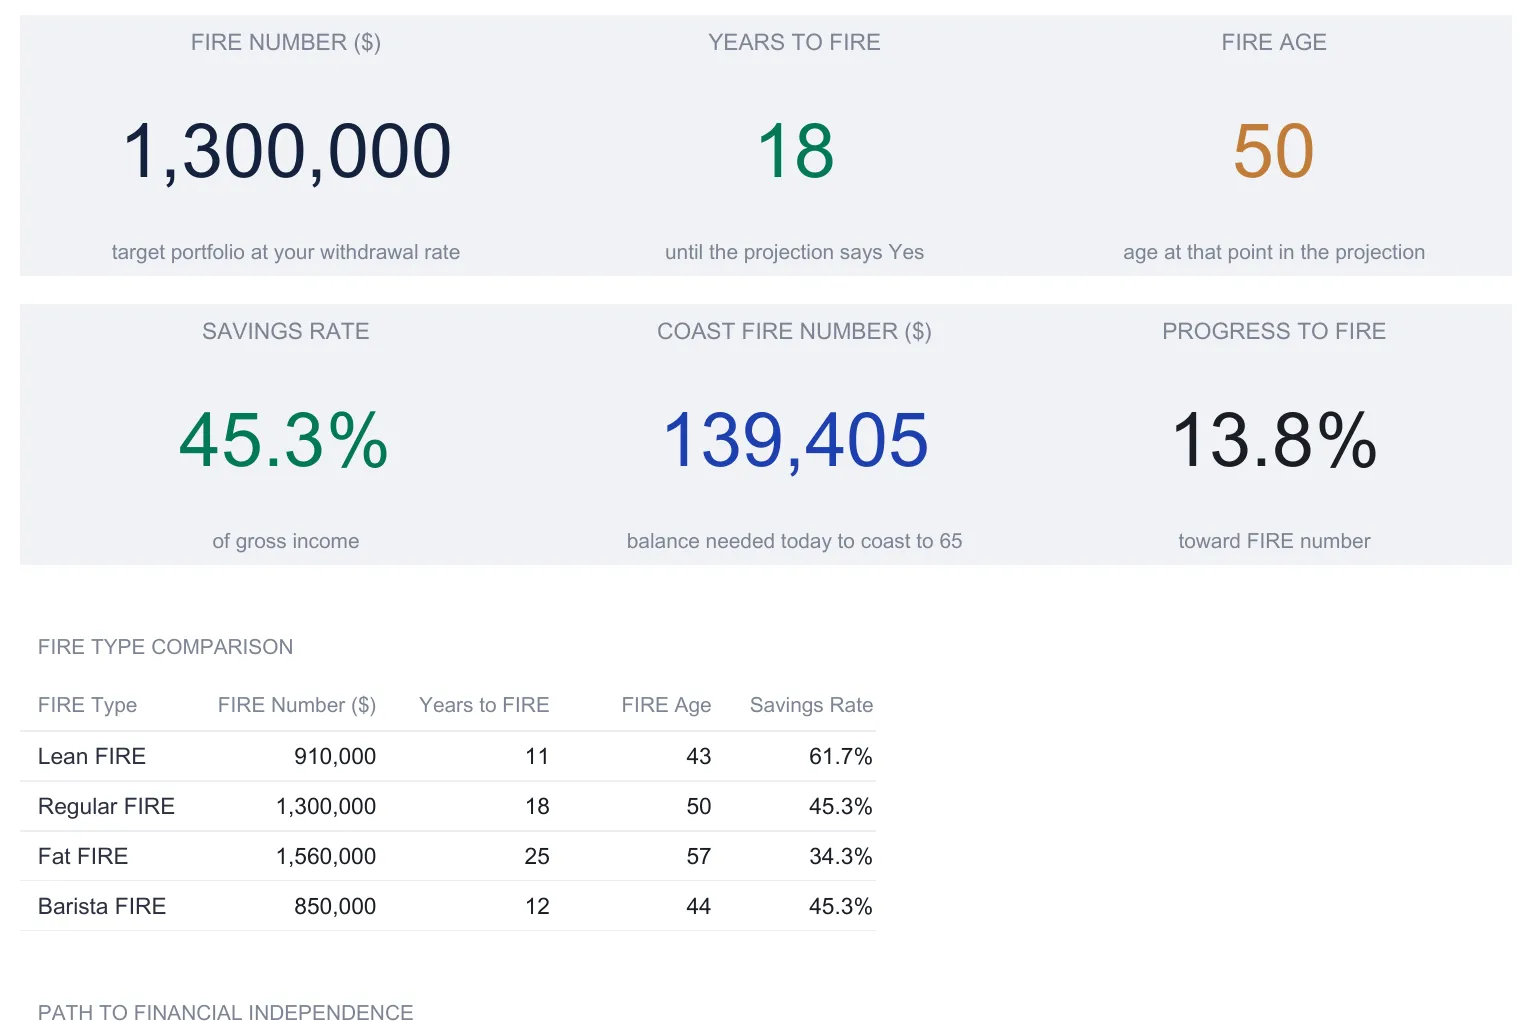
A FIRE calculator spreadsheet turns a short list of assumptions into a full path to financial independence: the FIRE number itself, a year-by-year projection to the year the math clears, side-by-side Lean, Fat and Barista variants, a Coast FIRE view, and a withdrawal-rate stress check. This walkthrough follows the structure using the workbook's sample inputs, a 32-year-old spending $52,000 a year with $180,000 already invested, which the sheet projects reaches its $1,300,000 FIRE number at age 50 under a 7% return. Our Fire Calculator Ultimate ($29) ships the whole model ready-made for Excel and Google Sheets.
A FIRE number is one figure, but arriving at it honestly takes more than one calculation. The headline is simple enough: the portfolio at which your investments could cover your spending indefinitely. The harder questions sit around it. How many years of saving does that number take at your current rate? Does it move if you would accept a leaner lifestyle, or want a richer one? How much would you need invested today to reach it by a conventional retirement age even if you stopped adding a dollar? And once you are there, how long does the money actually hold up as you draw on it? A spreadsheet is well suited to answering all of those from the same short list of inputs, which is what a dedicated FIRE calculator does.
The structure comes down to five moving parts: one set of assumptions, a year-by-year projection that grows those assumptions until the math clears, a comparison of the different FIRE variants, a Coast FIRE view, and a withdrawal-rate check. The examples below come from our Fire Calculator Ultimate Spreadsheet Template ($29), which ships the entire model ready-made for Excel and Google Sheets. Everything here is reproducible by hand, and every figure quoted is the workbook’s own sample output. If you want the FIRE concept itself explained from the ground up, the financial independence number article covers that separately; this walkthrough is about operating the template.
One point matters before any of the numbers. The income and spending figures, the expected return, the inflation estimate, and the withdrawal rate are editable sample inputs, not forecasts. The savings rate, the FIRE number, the years to reach it, the projected balances, and the Coast, Lean, and Fat figures are all arithmetic run forward from whatever you type. They are projections rather than promised outcomes, not a recommendation on how much to save or when to stop working. Where the topic edges into planning decisions, a financial professional is the right person to weigh in.
What a FIRE calculator spreadsheet has to hold
Strip away the charts and there are only five kinds of thing in the file:
- Assumptions. The inputs that describe you and your expectations: age, target age, income, spending, current savings, the return and inflation you expect, and the withdrawal rate that defines the target.
- The projection. A year-by-year table that carries today’s savings forward, adding contributions and compounding, and marks the first year the balance clears the retirement bar.
- The variants. A comparison of Regular, Lean, Fat, and Barista FIRE, each with its own spending figure and therefore its own target and timeline.
- Coast FIRE. The balance you would need invested today so that compounding alone reaches the FIRE number by 65, with no further saving.
- The withdrawal check. What happens once you start drawing on the portfolio, at your chosen rate and two more conservative ones.
The Ultimate workbook gives each of these its own sheet, named Assumptions, FIRE Projection, FIRE Types, Coast FIRE, and Withdrawal Strategy, with a Dashboard on top that reads all of them and a How to Use sheet carrying the instructions. Six working sheets, no macros, and everything formula-driven. The natural order to work in runs from the assumptions outward, so that is the order below.
Start with the inputs: the Assumptions sheet
Every other sheet reads from Assumptions, so it comes first. The inputs are grouped into blocks, and the tinted cells are the only ones you ever type into.
Personal profile. Current age and a target FIRE age. The sample uses 32 and 50. The target age is not what drives the projection; it is a benchmark the FIRE Types sheet measures each path against.
Income and expenses. An annual gross income of $95,000 and annual expenses of $52,000. From these the sheet derives monthly savings of $3,583 and a savings rate of 45.3%, which is the share of gross income not being spent. Expenses do the heavy lifting here, because the FIRE number is built directly from them.
Current position. Current savings and investments of $180,000, counted as all investable assets today across retirement and brokerage accounts.
Return and rate assumptions. Three rates that shape everything downstream: an expected annual return of 7.0%, an inflation rate of 2.5%, and a safe withdrawal rate of 4.0%. The return compounds the portfolio each year, inflation carries expenses forward, and the withdrawal rate sets the size of the target.
FIRE variant settings. Two levers for the alternative paths: Lean FIRE expenses at 70% of current spending, and a Barista FIRE part-time income of $18,000 a year.
Below the inputs, a derived block does the FIRE-number arithmetic so you can see it rather than take it on faith. Annual savings works out to $43,000 (income minus expenses). The Regular FIRE number is $1,300,000, which is the $52,000 of expenses divided by the 4% withdrawal rate. The same division, applied to different spending figures, produces the Lean number of $910,000, the Fat number of $1,560,000, and the Barista number of $850,000. Each is one line of arithmetic, and each flows straight to the dashboard and the comparison sheet.
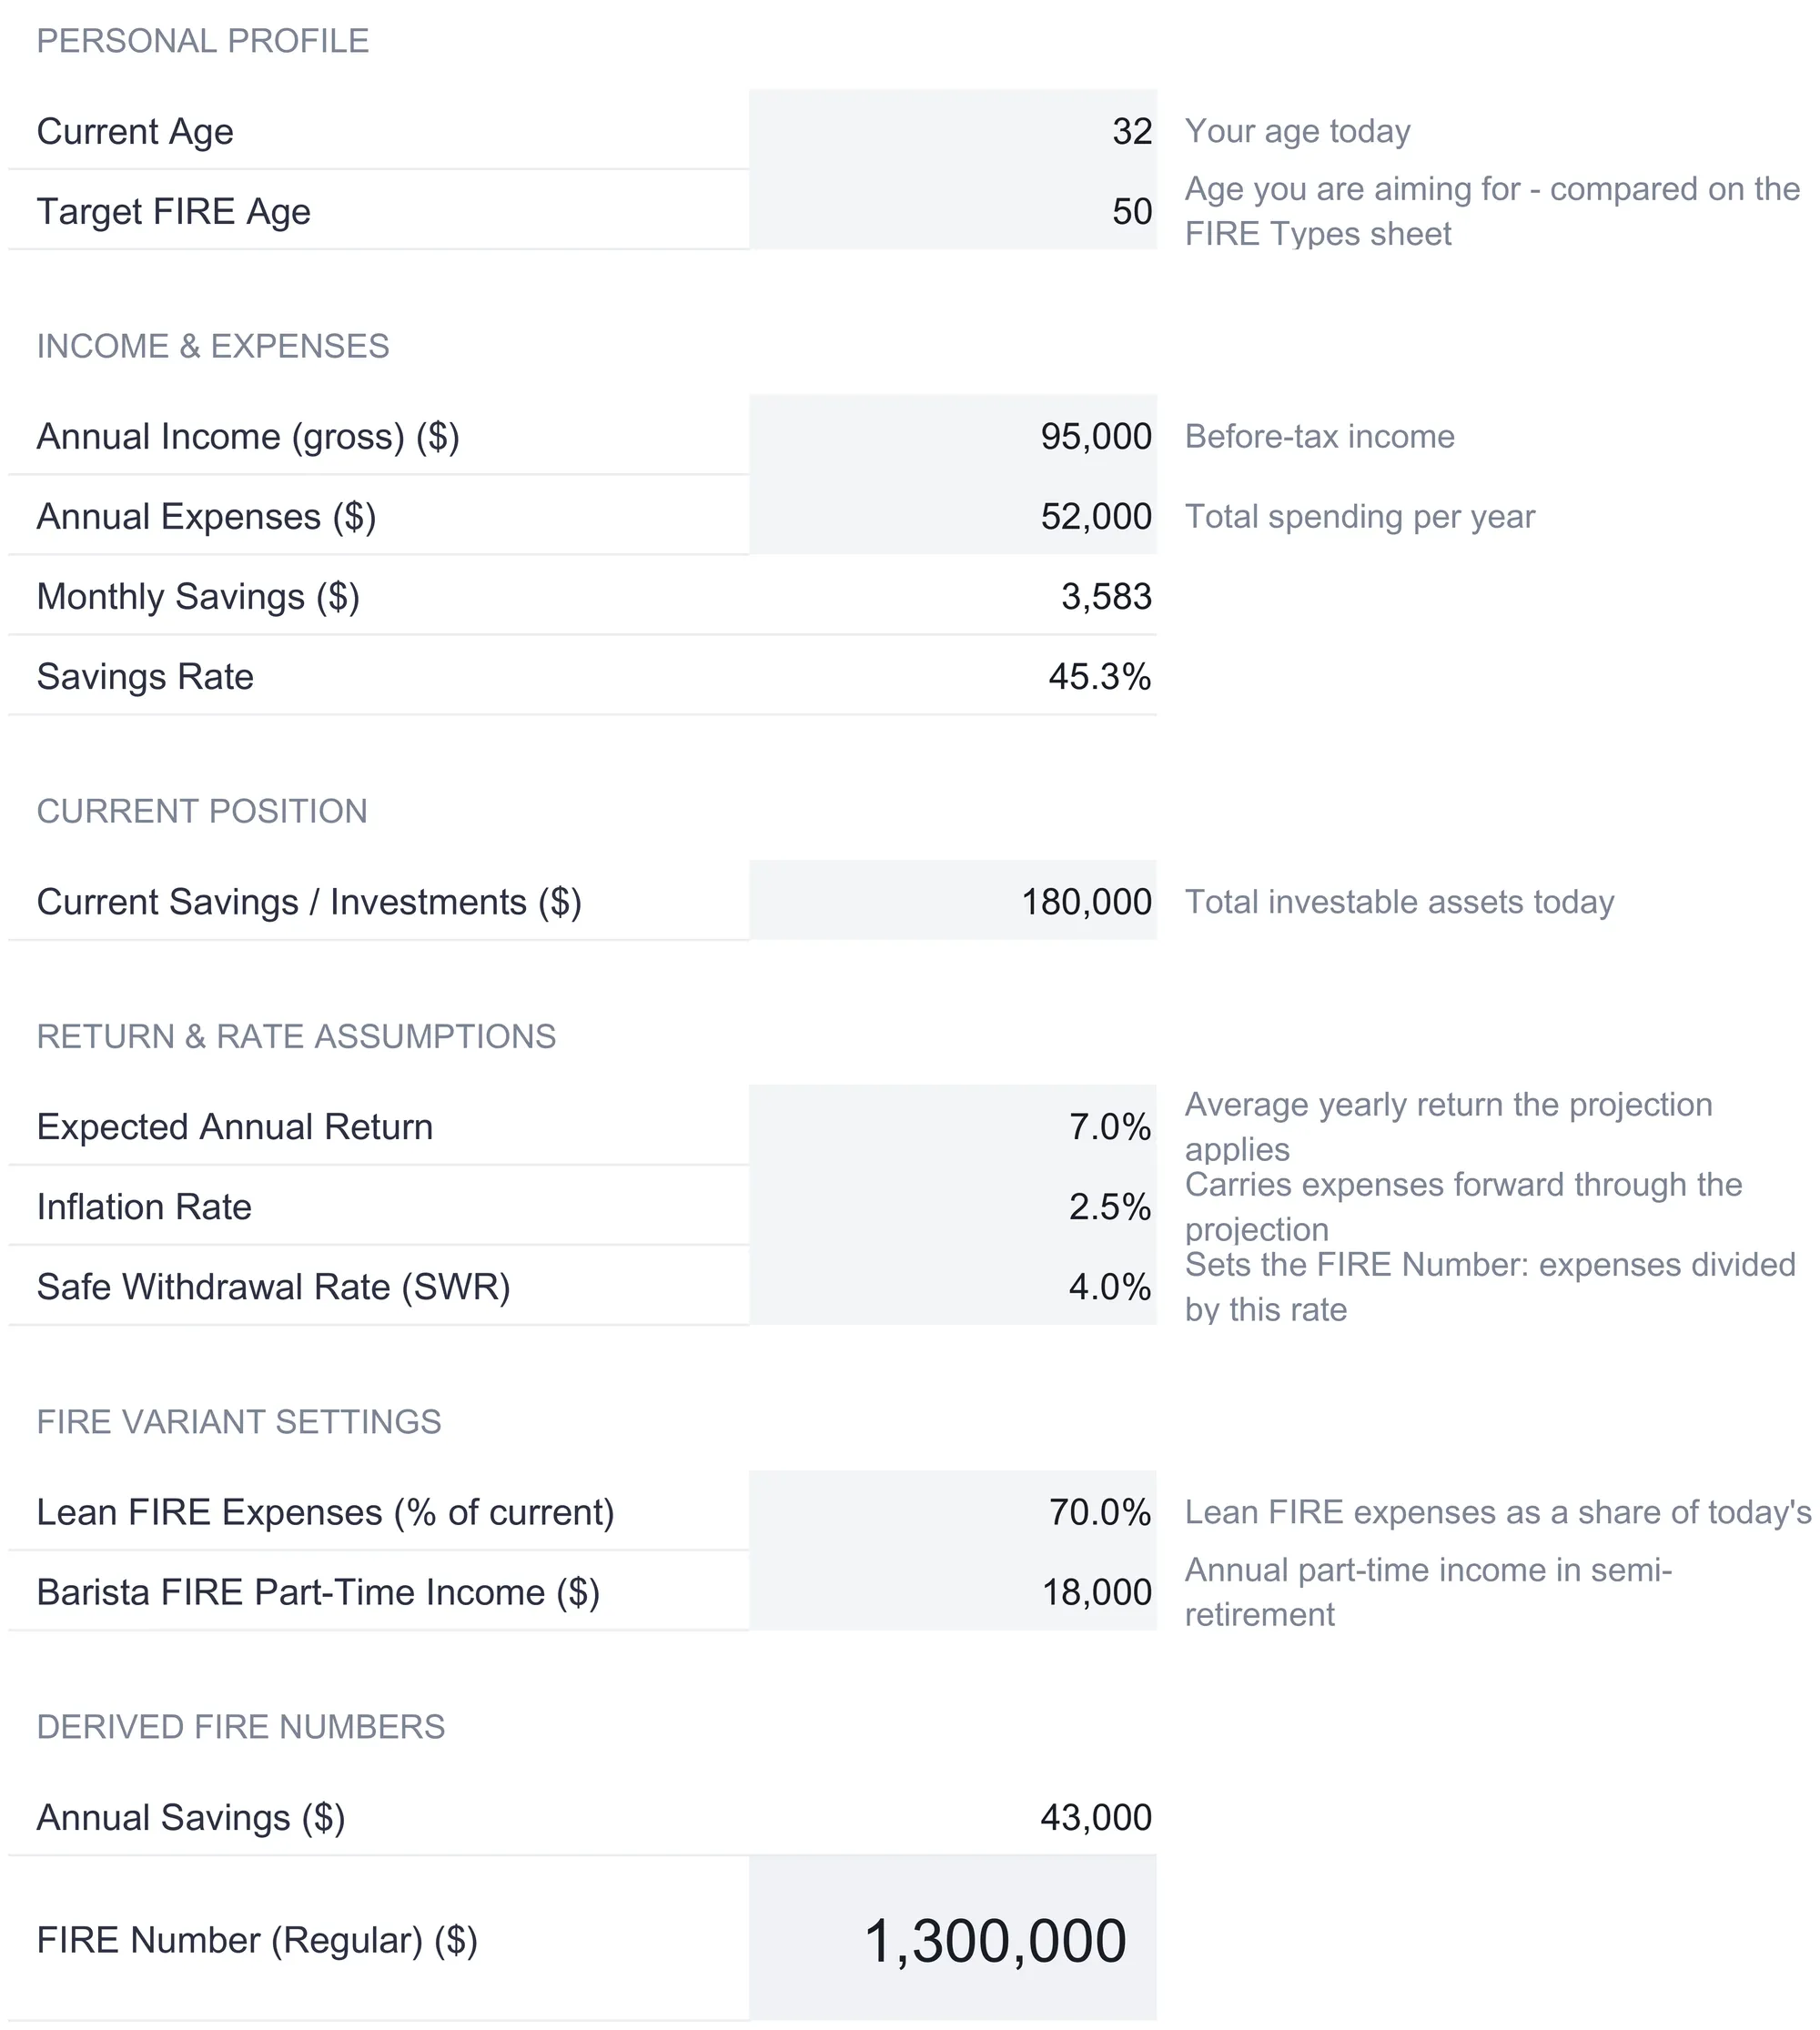
That $1,300,000 is the number the whole file circles. It is worth being precise about what it means: it is the balance at which 4% of the portfolio, drawn in a year, equals a year of current spending. It is also stated in today’s dollars, which becomes important the moment the projection starts inflating expenses forward. Holding that distinction in mind explains a result that surprises people, and the next sheet is where it shows up.
Grow it forward: the FIRE Projection sheet
The FIRE Projection sheet is the accumulation phase written out one year at a time, across a forty-year horizon. Apart from the year counter down the left, nothing on it is typed; every other cell reads from Assumptions. Each row carries eight columns: the year number, your age, the annual savings, the beginning balance, the investment returns earned that year, the ending balance that becomes next year’s opening figure, the inflation-adjusted expenses for that year, and a Can Retire? flag.
One row makes the mechanics concrete. In year one the sample saver is 33, adds $43,000 in savings, and opens the year with the $180,000 already invested. The investment return is a straightforward 7% of the opening balance, which is $12,600, with no mid-year adjustment. The ending balance is $180,000 plus $43,000 plus $12,600, or $235,600, and that figure opens year two. From there the pattern repeats: the return each year is 7% of that year’s opening balance, and the $43,000 of savings is added on top. The compounding is the same effect the SEC’s Investor.gov compound interest calculator illustrates, where returns are increasingly earned on prior returns rather than on contributions alone.
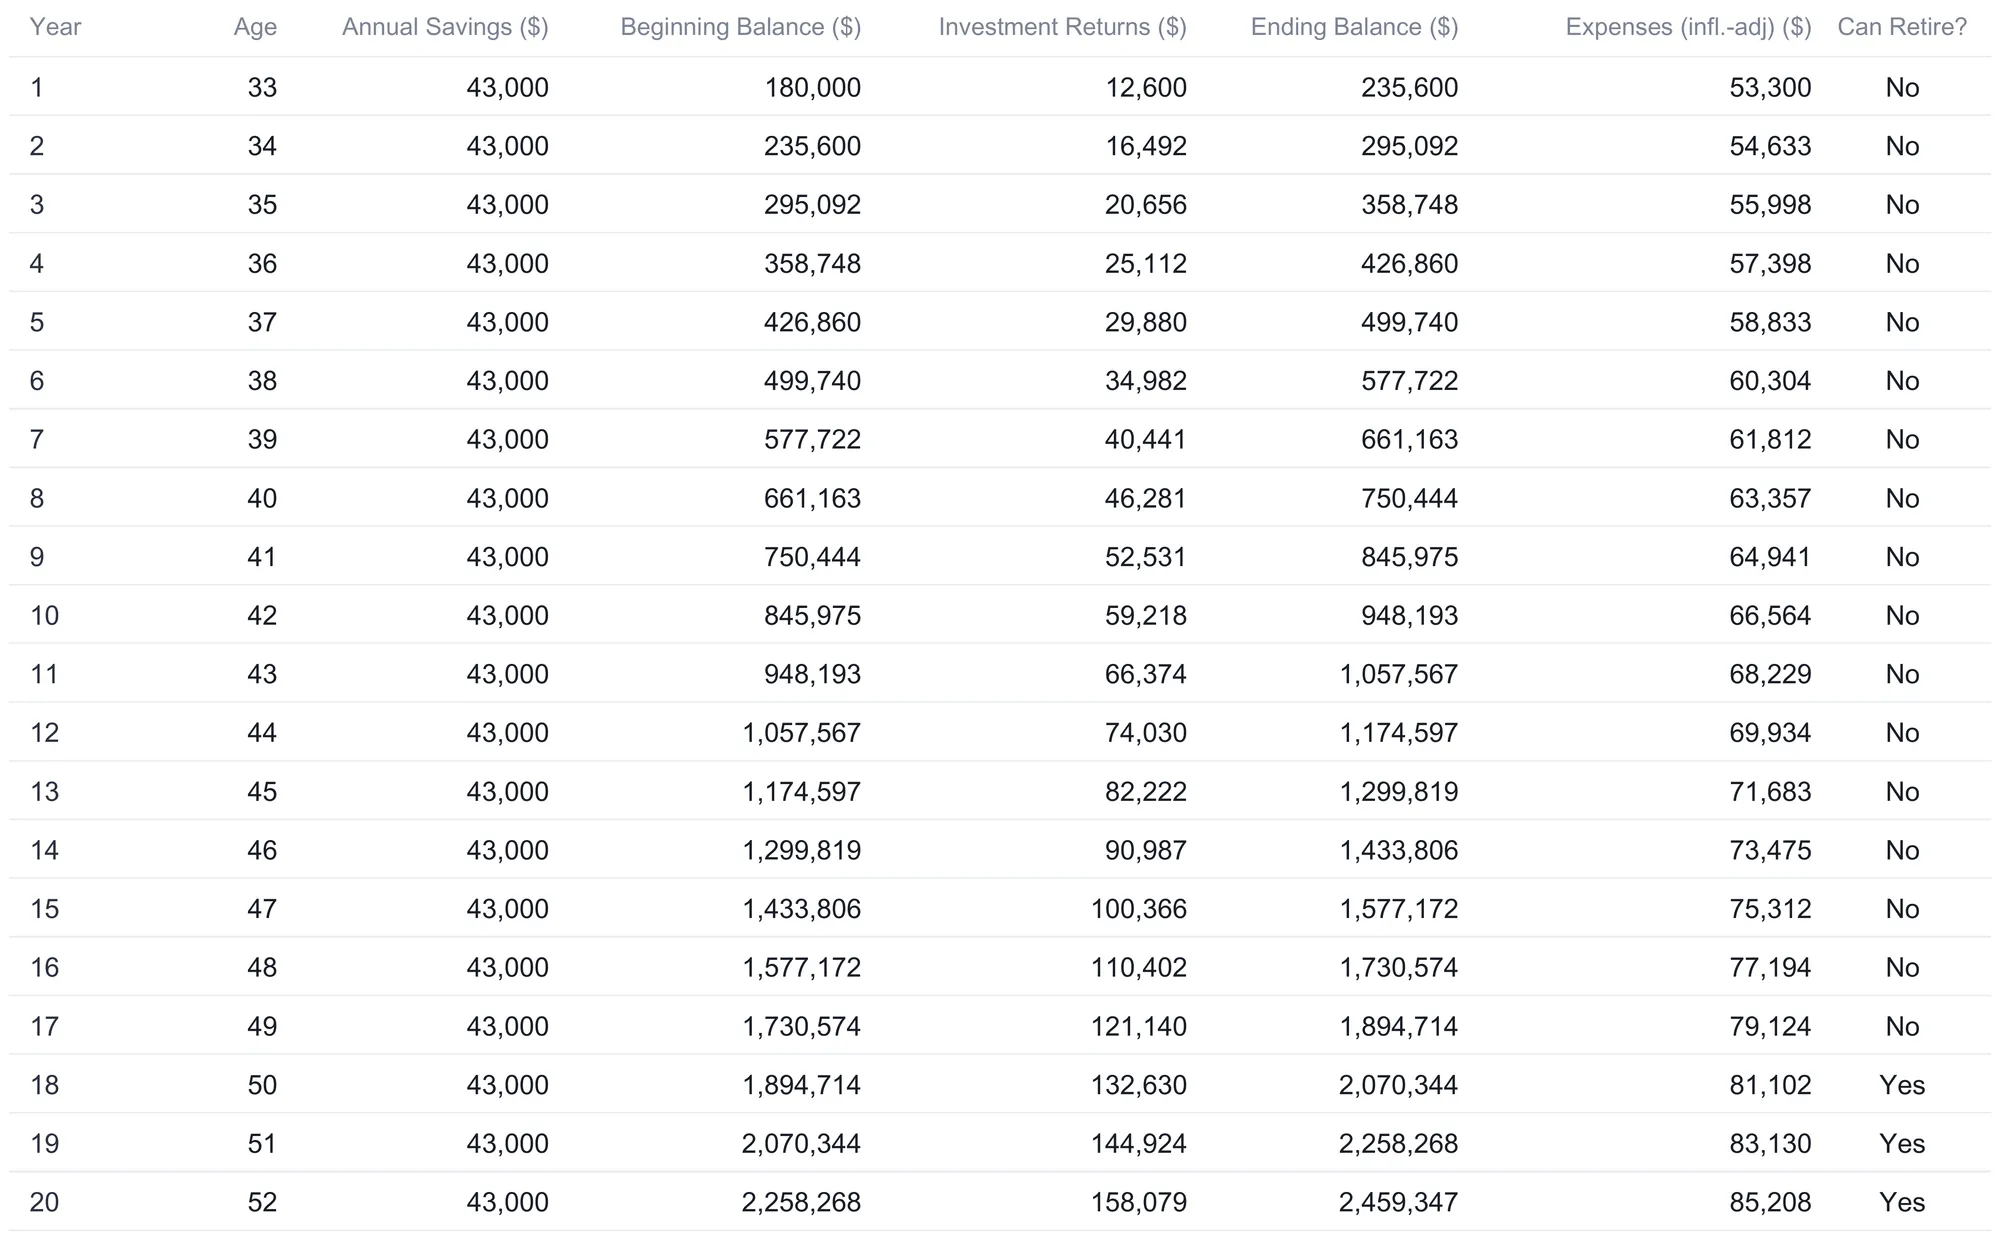
The two right-hand columns are where the FIRE question is actually answered. The inflation-adjusted expenses column takes the $52,000 spending figure and compounds it by 2.5% each year, so it reads $53,300 in year one, $60,304 by year six, and $81,102 by year eighteen. The Can Retire? column then compares the ending balance against that year’s expenses divided by the withdrawal rate, and marks Yes the first time the balance covers it. This is the subtle part. Because the target grows with inflation, the balance needed in year eighteen is not the headline $1,300,000 but $81,102 divided by 4%, which is $2,027,550. The projected ending balance that year is $2,070,344, so it clears the bar, and the flag flips to Yes at age 50. That is why the dashboard reports eighteen years to FIRE and a FIRE age of 50 even though the raw balance passes $1,300,000 several years earlier. The sheet is holding the target to the same inflation the rest of the projection uses, rather than letting today’s number stand still while prices move.
Two design details are worth carrying into any hand-built version. The projection runs a fixed forty rows, from age 33 to age 72, so it covers horizons well beyond the point most savers reach the target. And the inflation-adjusted expenses column, divided by the withdrawal rate, is the moving target the dashboard’s line chart plots the balance against, so the visual shows the balance catching up to a rising line rather than a flat one.
Compare the paths: the FIRE Types sheet
There is no single FIRE number, because there is no single lifestyle. The FIRE Types sheet lays out four versions side by side, each built from a different spending figure, so the target and the timeline change with the ambition.
The top comparison block runs three of them across columns. Lean FIRE assumes a lower-cost lifestyle at 70% of current spending, so its annual expenses are $36,400, its FIRE number is $910,000, and the projection reaches it in 11 years at age 43. Regular FIRE keeps current spending of $52,000, targets $1,300,000, and lands at 18 years and age 50, matching the main projection exactly. Fat FIRE models a higher-spending lifestyle at 120% of current expenses, so $62,400 a year, a $1,560,000 target, and 25 years to age 57. The sheet also reports a required savings rate for each, from 61.7% for Lean down to 34.3% for Fat, and how each FIRE age compares against the target age of 50: Lean arrives 7 years early, Regular lands on it, and Fat comes 7 years later.
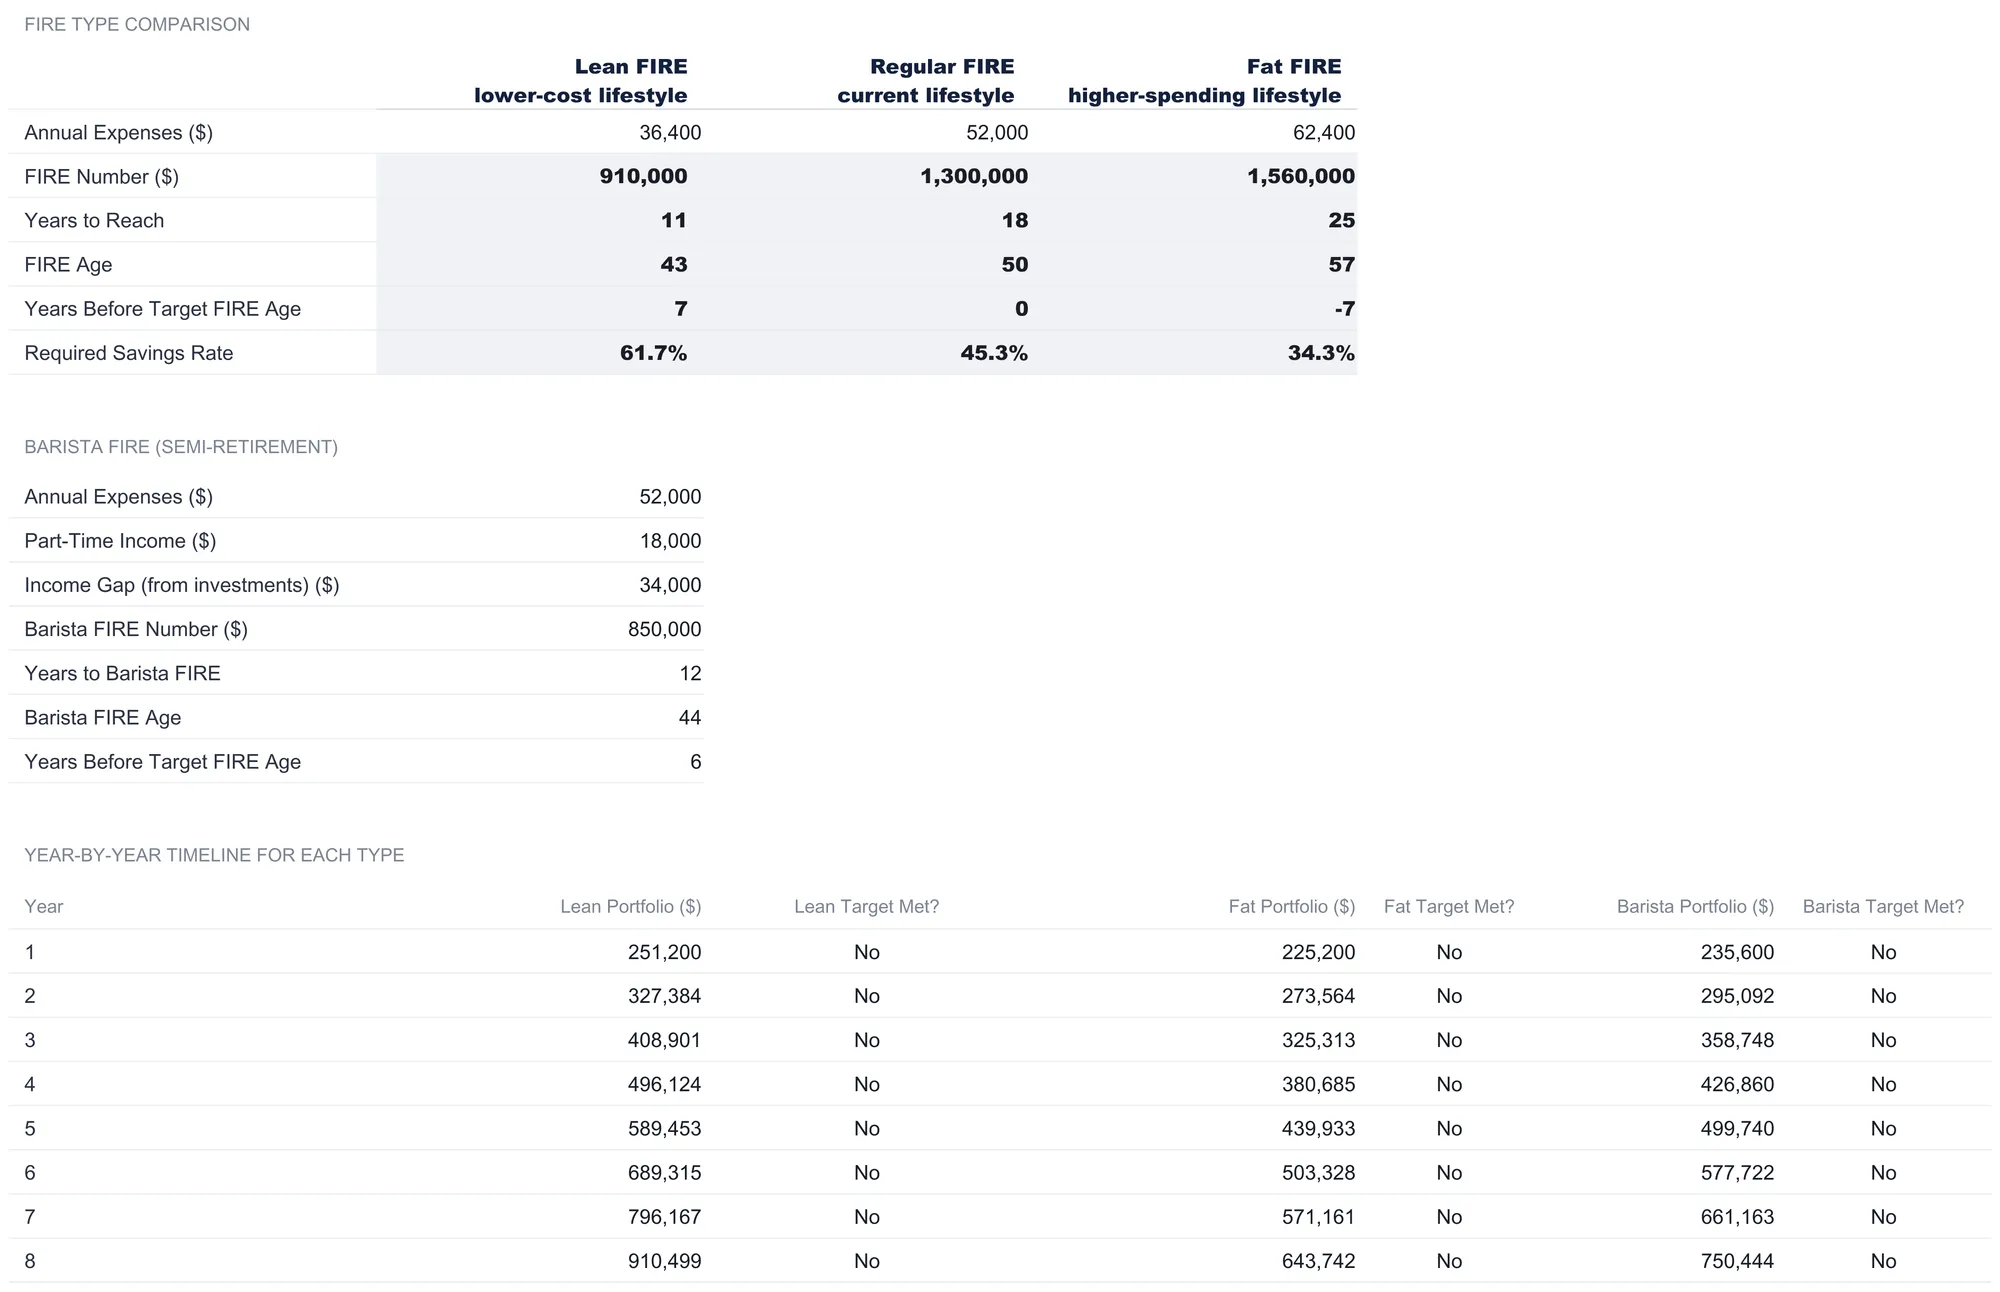
Below that sits a Barista FIRE block, which models semi-retirement rather than a full stop. The idea is that part-time work covers some spending, so the portfolio only has to fund the rest. The sample keeps expenses at $52,000, subtracts $18,000 of part-time income, and leaves a $34,000 income gap for investments to cover. Divided by the 4% withdrawal rate, that gap sets a Barista FIRE number of $850,000, the lowest of the four, reached in 12 years at age 44.
A year-by-year timeline underneath runs the Lean, Fat, and Barista paths out individually, because they do not all save at the same rate. Someone targeting Lean FIRE is assumed to live the leaner lifestyle now, so they save more each year and their portfolio climbs faster; the Fat path saves less because more is being spent. The Barista column tracks the main projection until its lower target is met. The point of the sheet is not to crown a winner. It is to show, in one view, how much the finish line moves when the lifestyle behind it changes, and each of the four remains a projection from the inputs rather than a plan anyone is being steered toward. If the differences between these variants are new to you, the Lean FIRE versus Fat FIRE versus Coast FIRE comparison walks through what each one means in practice.
Measure the head start: the Coast FIRE sheet
Coast FIRE is a different question from the others. Instead of asking when you reach the target by continuing to save, it asks how much you would need invested today so that compounding alone carries you to the FIRE number by 65, even if you never added another dollar. The Coast FIRE sheet answers it and then stress-tests the answer.
The headline is a single figure. At the sample’s current age of 32 and a 7% return, the Coast FIRE number is $139,405. That is the $1,300,000 target discounted back 33 years at 7%, the balance that would grow to the target on its own by age 65. The sheet then notes that current savings of $180,000 already sit at or above that number, which is a meaningful result: the sample saver has, on these assumptions, already banked enough that they could stop contributing and still reach the FIRE number by a conventional retirement age. Continuing to save is what pulls the date forward from 65 to 50.
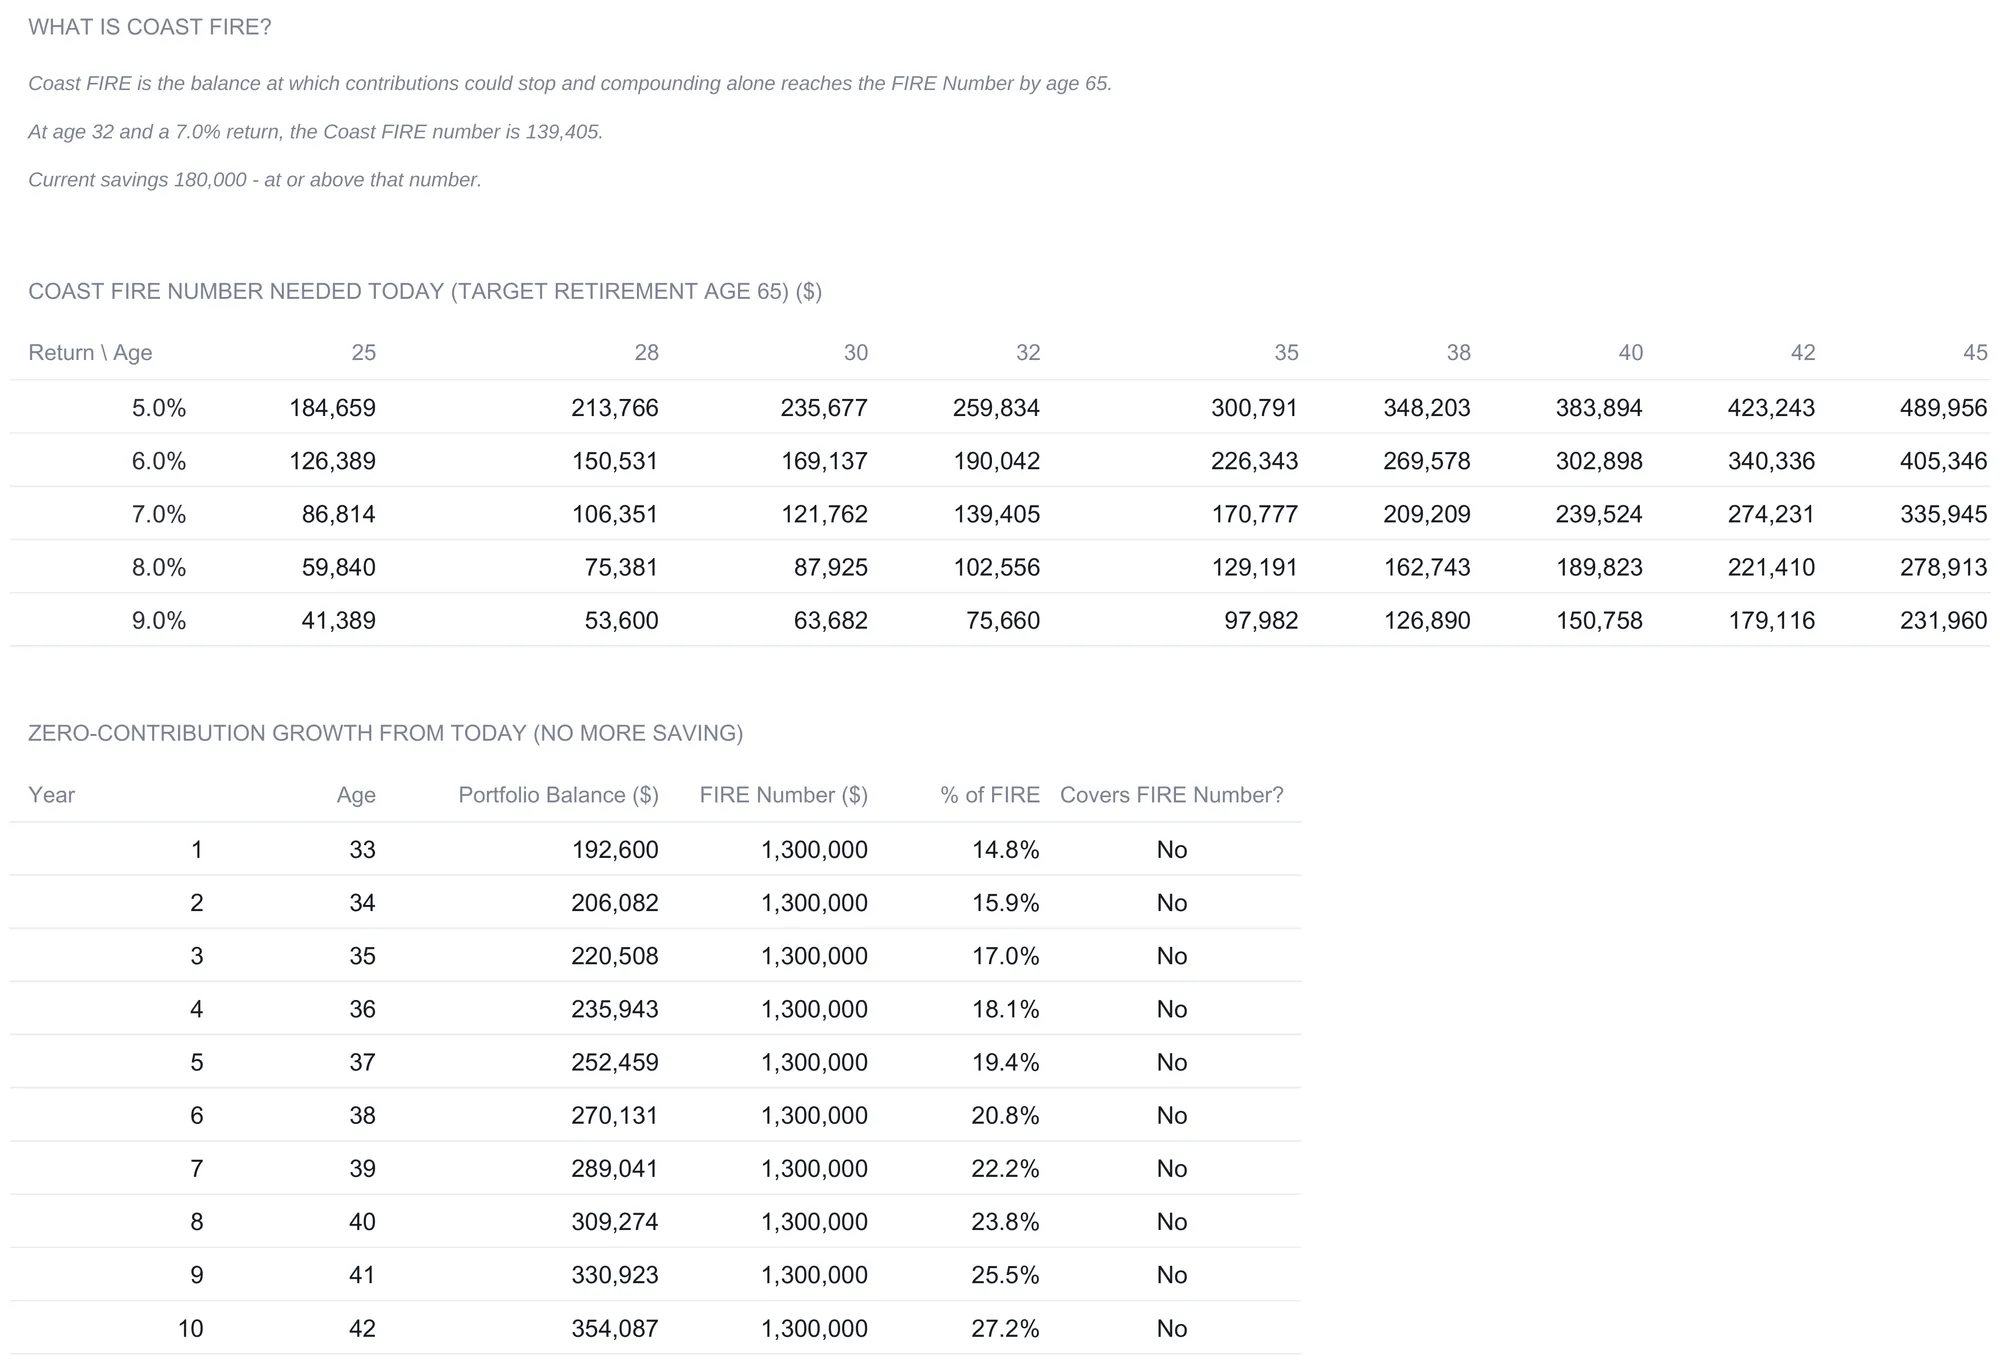
A single Coast FIRE number would be fragile, because it leans entirely on the return you assume and the age you start. So the sheet lays out a grid instead, with returns from 5% to 9% down the side and ages across the top, either side of the ones you entered. The grid reads in two directions. Holding age at 32, a higher assumed return lowers the coast number, because a stronger tailwind needs less to start with; at 9% the figure falls to $75,660, and at 5% it climbs to $259,834. Holding the return at 7%, starting later raises the number, because there are fewer years to compound; by age 45 it is $335,945. The spread is the honest part. Coast FIRE is only as solid as the return that has to show up over decades, and the grid makes that dependence visible rather than hiding it behind one clean figure.
Below the grid, a zero-contribution table walks the current balance forward with no further saving, growing it at 7% and reporting the balance as a percentage of the FIRE number each year. It starts at $192,600 after year one, about 15% of the target, and climbs from there. Because the sample is already past its coast number, the Covers FIRE Number? column turns Yes at age 62, three years ahead of the 65 the sheet measures to. This is projected growth on a constant assumed return, so it is a model of one smooth path rather than a promise; real markets deliver the same average, if they deliver it at all, through years that look nothing like the average. The dedicated Coast FIRE calculator explained article goes deeper on the idea behind this sheet.
Pressure-test the drawdown: the Withdrawal Strategy sheet
Reaching the FIRE number is only half the story. The Withdrawal Strategy sheet takes the target balance and asks what happens once you start living off it, at your chosen withdrawal rate and two more cautious ones.
The comparison block runs three columns: the 4.0% rate you entered, plus 3.5% and 3.0%. Each starts from the $1,300,000 FIRE number. At 4%, the annual withdrawal is $52,000, which is exactly the current spending figure, a tidy confirmation that the FIRE number was sized correctly; monthly, that is $4,333. Trimming to 3.5% drops the annual draw to $45,500, and 3.0% to $39,000. The sheet then projects each portfolio forward while it keeps earning the 7% return, and reports the balance at years 10, 20, and 30. At the 4% rate, the portfolio grows rather than shrinks: it reaches $1,838,841 by year 10, $2,898,824 by year 20, and $4,983,971 by year 30.
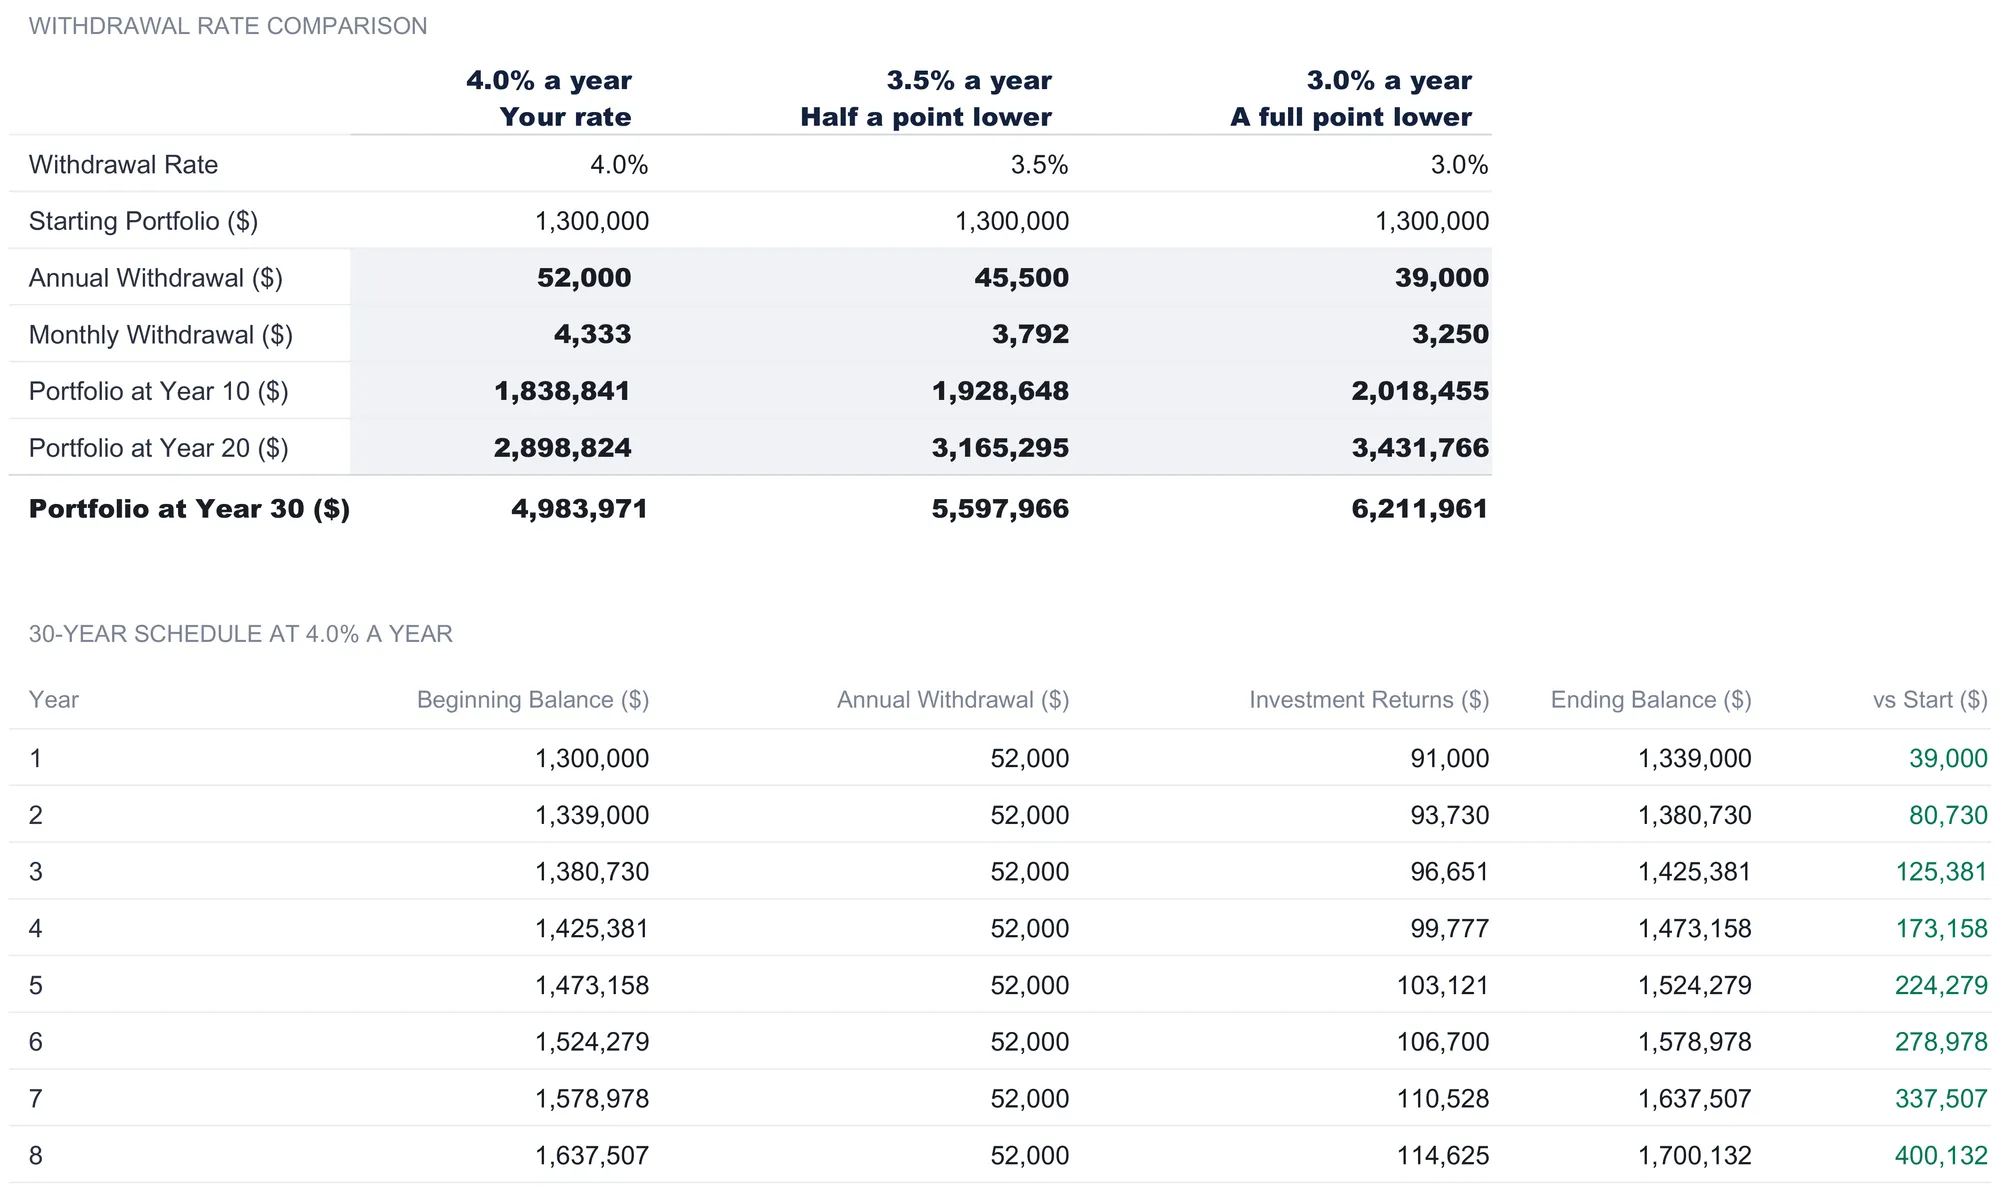
That growth deserves a careful reading rather than a celebration. The portfolio rises in this model only because the assumed 7% return outruns the withdrawal rate every single year, and because the schedule below the comparison draws a flat $52,000 rather than a figure that rises with inflation, a simplification the workbook states outright. Real portfolios face neither of those comforts reliably: returns arrive unevenly, a weak stretch early in retirement does lasting damage that a constant average hides, and spending tends to climb with prices. The workbook’s own notes are explicit that taxes, sequence-of-returns risk, and healthcare costs are not modeled here. The three-column comparison is in the sheet precisely because a lower withdrawal rate is one lever against that uncertainty, and seeing $52,000, $45,500, and $39,000 side by side shows the trade rather than prescribing one. Which rate fits a real plan is a question for a professional, not a spreadsheet.
The dashboard: six numbers and a path
With the Assumptions filled in, the Dashboard reads every sheet and reduces the whole model to six headline figures.
| Metric | Sample value | What it means |
|---|---|---|
| FIRE Number | $1,300,000 | Annual expenses divided by the withdrawal rate |
| Years to FIRE | 18 | Years until the projection’s Can Retire? flag turns Yes |
| FIRE Age | 50 | Current age plus the years to FIRE |
| Savings Rate | 45.3% | Share of gross income saved |
| Coast FIRE Number | $139,405 | Balance needed today to coast to 65 with no more saving |
| Progress to FIRE | 13.8% | Current savings as a share of the FIRE number |
The Progress to FIRE figure is the plainest of the set: $180,000 of current savings against a $1,300,000 target is 13.8% of the way there. It sits next to the Coast FIRE number to make a quiet point, that the same $180,000 is already past what is needed to coast, even though it is a small fraction of the full target. The two figures answer different questions from the same balance.
Below the tiles, the dashboard repeats the four-way FIRE type comparison and plots two charts: a path to financial independence, which tracks the projected balance against the rising inflation-adjusted target year by year, and a bar chart of the FIRE number by type. None of these outputs is a verdict on whether any path is right for anyone. They are the arithmetic of the inputs, and the inputs are yours to change. For a wider look at how tools like this one are built and compared, the best FIRE calculators and spreadsheets roundup surveys the field.
The metrics in plain terms
A few of the figures carry meaning that is easy to lose in the shorthand.
The FIRE number is the whole model in one line: annual expenses divided by the safe withdrawal rate. The lower the withdrawal rate, the larger the number, because you are asking a smaller slice of the portfolio to cover the same spending. It is the reason expenses, not income, are the main driver of the target.
The safe withdrawal rate is the share of the portfolio drawn in a year that the plan assumes can continue without exhausting it. The 4% figure is the well-known one, drawn from the 1998 Trinity Study in the AAII Journal, and the sheet treats it as an assumption you can overwrite rather than a rule. It is not a guarantee, and the workbook does not present it as one.
Coast FIRE is the balance at which the compounding you have already banked will reach the target on its own by a set age, so further saving only moves the date forward rather than being strictly required. It reframes the question from “how much do I still need to save” to “have I already saved enough to let time finish the job.”
Real versus nominal dollars is the distinction behind the age-50 result. The FIRE number is quoted in today’s money, but the retirement test grows expenses with inflation, so the balance actually needed at any future age is higher than the headline. Keeping the two straight is what stops a FIRE target from quietly understating itself over a couple of decades. The broader idea of a single financial independence spreadsheet pulling all of this together is its own topic.
Excel or Google Sheets for a FIRE calculator
The template is an .xlsx file built on ordinary formulas, with no macros and no add-ons, so it runs the same way in Microsoft Excel and in Google Sheets after upload, and in LibreOffice Calc as well. Google Sheets suits anyone who wants the file synced across devices and open from a browser; Excel suits those who prefer a local copy and fast recalculation on the desktop. The projection table, the FIRE type timelines, the Coast FIRE grid, and the withdrawal schedule behave identically across all three, because none of them relies on anything platform-specific. A currency selector on the dashboard relabels every money column and KPI across the workbook, though it changes only the label and does not convert the underlying numbers.
Which template fits
- Fire Calculator Ultimate Spreadsheet Template ($29) is the workbook this walkthrough follows: the Assumptions inputs, the forty-year FIRE Projection, the FIRE Types comparison, the Coast FIRE grid, the Withdrawal Strategy check, and the six-metric dashboard. It is the top of a three-tier family. The free Fire Calculator gives a single-sheet estimate of the number, and the Essentials version ($19) adds a dashboard and a projection, before the Ultimate tier adds the variant comparison, the Coast FIRE analysis, and the withdrawal model.
- Retirement Calculator Ultimate Spreadsheet Template ($29) answers the neighboring question. Where the FIRE calculator works backward from a spending target to find the number and the year it clears, the retirement calculator projects a balance at a fixed retirement age and then runs a full drawdown through life expectancy, with return scenarios and a sensitivity grid. The retirement projection walkthrough covers that model sheet by sheet. It suits savers planning around a conventional retirement age rather than an early-independence date.
Related
- FIRE Calculator: Your Financial Independence Number - the concept behind the FIRE number, explained from scratch
- Coast FIRE Calculator Explained - a closer look at the coasting idea this workbook grids out
- Lean FIRE vs Fat FIRE vs Coast FIRE - how the variants on the FIRE Types sheet differ
- Best FIRE Calculators and Spreadsheets - a survey of the tools in this space
- How to Project Retirement Savings in a Spreadsheet - the fixed-retirement-age companion model
Frequently asked questions
How does the spreadsheet calculate the FIRE number?
The FIRE number is annual expenses divided by the safe withdrawal rate, both set on the Assumptions sheet. In the sample, $52,000 of annual expenses divided by a 4% withdrawal rate gives $1,300,000. That figure is in today's dollars: it is the portfolio at which one year of current spending equals the withdrawal rate applied to the balance. A lower withdrawal rate divides by a smaller number and produces a larger target, which is why the withdrawal-rate assumption matters as much as the spending figure.
Why does the projection say age 50 when the balance passes $1,300,000 earlier?
The headline FIRE number tile is stated in today's dollars, but the year-by-year Can Retire? test grows expenses by inflation and checks the balance against that rising target. In the sample, expenses of $52,000 have grown to about $81,102 by year 18, so the balance actually needed that year is $81,102 divided by 4%, or $2,027,550, not $1,300,000. The projected ending balance first clears that inflation-adjusted bar at year 18, age 50. The gap between the two numbers is inflation, and the sheet shows both on purpose.
Does the model account for inflation, taxes, and market swings?
It inflates expenses every year at the rate you enter, so the retirement test uses a rising spending figure rather than a flat one. It does not model taxes, sequence-of-returns risk (a bad market run early on), or healthcare costs, and it applies one constant average return rather than the year-to-year swings of real markets, as the workbook's own notes state. Those gaps are where the projection is only a starting point, and where a financial professional adds what a spreadsheet cannot.
Can I change the 7% return and 4% withdrawal rate?
Yes. Every tinted cell on the Assumptions sheet is an input, including the expected annual return, the inflation rate, and the safe withdrawal rate, and changing any of them recalculates every sheet. The sample rates of 7%, 2.5%, and 4% are the workbook's starting values, not recommendations. The 4% figure is the classic safe withdrawal rate from the Trinity Study, and the sheet uses whatever you enter in its place. Real returns vary year to year rather than arriving as a constant average.
Is a FIRE calculator the same as a retirement calculator?
They share the compounding engine but answer different questions. A retirement calculator projects a balance at a fixed retirement age and then models the drawdown through life expectancy. A FIRE calculator works backward from a spending target to find the number at which work becomes optional and the year the projection reaches it, then compares Lean, Fat, Coast, and Barista paths to that point. This workbook is built around the FIRE number and the year it clears rather than a set retirement date.
Sources
- Compound Interest Calculator - U.S. Securities and Exchange Commission (Investor.gov)
- Retirement Savings: Choosing a Withdrawal Rate That Is Sustainable - AAII Journal, February 1998 (Cooley, Hubbard and Walz)
About this article
Every figure, column name, formula, and feature description re-checked on 2026-09-10 against the shipped Fire Calculator Ultimate workbook (Dashboard, Assumptions, FIRE Projection, FIRE Types, Coast FIRE, Withdrawal Strategy and How to Use sheets). Compound growth reference checked against the live Investor.gov (SEC) compound interest calculator page, and the 4% withdrawal rate against the AAII Journal February 1998 Trinity Study PDF, on 2026-09-10. Last reviewed September 2026.