A break-even point answers one question: how many units cover every cost? This walkthrough builds it from the ground up, starting with price, variable cost, and fixed cost per product, then deriving contribution margin, break-even units and revenue, margin of safety, and a blended figure across a whole product line. The worked example is a three-plan software business with $32,000 of fixed cost that breaks even at $36,023 of blended revenue. Our Break-Even Analysis Spreadsheet Template ($29) ships the same structure ready-made for Excel and Google Sheets.
Every business has a number below which it loses money and above which it makes money. That number is the break-even point, and most owners can name their monthly costs and their prices without ever putting the two together to find it. A break-even analysis does exactly that: it turns a price, a variable cost, and a pile of fixed overhead into a single answer to the question of how much has to sell before the lights are paid for. A spreadsheet is the natural home for that calculation, because it is a handful of divisions repeated across every product a business sells.
The structure has four moving parts: a set of product inputs, the contribution margin that falls out of them, the break-even point in units and revenue, and a sensitivity view that shows how fragile that point is. The examples below come from our Break-Even Analysis Spreadsheet Template ($29), which ships the whole thing ready-made for Excel and Google Sheets. The sample workbook models a small software business, Aurora Cloud Inc., selling three subscription plans, and the layout is reproducible by hand if you would rather build your own.
What a break-even analysis has to hold
Underneath the jargon there are only four kinds of data:
- Per-product economics. For each thing sold: its price, its variable cost per unit, the volume expected to sell, and the slice of fixed cost assigned to it.
- Contribution margin. What one sale contributes toward fixed cost once its own variable cost is paid. This is price minus variable cost, and it is the engine of the whole model.
- The break-even point. The unit count, and the revenue, at which contribution exactly covers fixed cost. Everything above it is profit; everything below it is loss.
- Margin of safety and sensitivity. How far expected volume sits above break-even, and how much that break-even moves when a price or a cost shifts.
The template gives these their own sheets. A Settings sheet holds two constants, Product Inputs holds the raw economics, a Break-Even sheet does the per-product and blended math, a Sensitivity sheet stress-tests it, and a Dashboard puts the headline numbers on one screen. A How to Use sheet carries the formulas in writing. Six sheets in total, and the figures only go into one of them, Product Inputs.
Start with the constants: the Settings sheet
Two fields sit on the Settings sheet, and neither one changes a single calculation. The business name flows to the header of every sheet but the How to Use guide, and the currency symbol, chosen from a dropdown of 35 options, relabels every money column and KPI tile across the workbook. The sheet spells out the important caveat directly: break-even here is unit-driven, and the currency is for display only. Picking euros over dollars changes the labels, not the numbers, because a break-even in units does not care what the price is denominated in.

Enter the economics: the Product Inputs sheet
Product Inputs is the only sheet that takes figures, and it holds one row per product with four columns each: price, variable cost, expected volume, and allocated fixed cost. The sample line reads as follows.
| Product | Price ($) | Variable cost ($) | Expected volume | Allocated fixed cost ($) |
|---|---|---|---|---|
| Starter plan | 29 | 4 | 1,200 | 8,000 |
| Pro plan | 79 | 9 | 800 | 14,000 |
| Team plan | 199 | 18 | 250 | 10,000 |
| Total fixed | 32,000 |
Two of these columns deserve a note. The variable cost is the cost that scales with each unit sold, the payment processing, the hosting, the per-seat license, whatever rises when one more customer signs up. The allocated fixed cost is the opposite: a share of the overhead that arrives whether or not anything sells, split across the products by whatever logic the business prefers. The sheet sums those allocations into a total fixed cost of $32,000, and that total is what the blended break-even later has to cover.
The allocation is a modeling choice rather than a law. Assigning $8,000 of overhead to the Starter plan and $14,000 to the Pro plan says something about how the business thinks its fixed costs are earned, and moving those numbers moves each product’s individual break-even. What the total cannot do is change: the six allocations always sum to the same fixed cost, so the blended picture stays honest however the slices are drawn.
The split between the two cost types is the assumption the whole analysis rests on, and it is not always clean. Some costs sit in between, rising in steps rather than smoothly, or carrying both a flat part and a per-unit part. The Small Business Administration calls these semi-variable costs, a mixture of fixed and variable components. A break-even model asks for a decision on each one, sending the portion that moves with volume to the variable column and the portion that arrives regardless to the fixed column. The template does not make that call for you, which is the honest position, because only the business knows whether a given bill behaves more like rent or more like shipping.
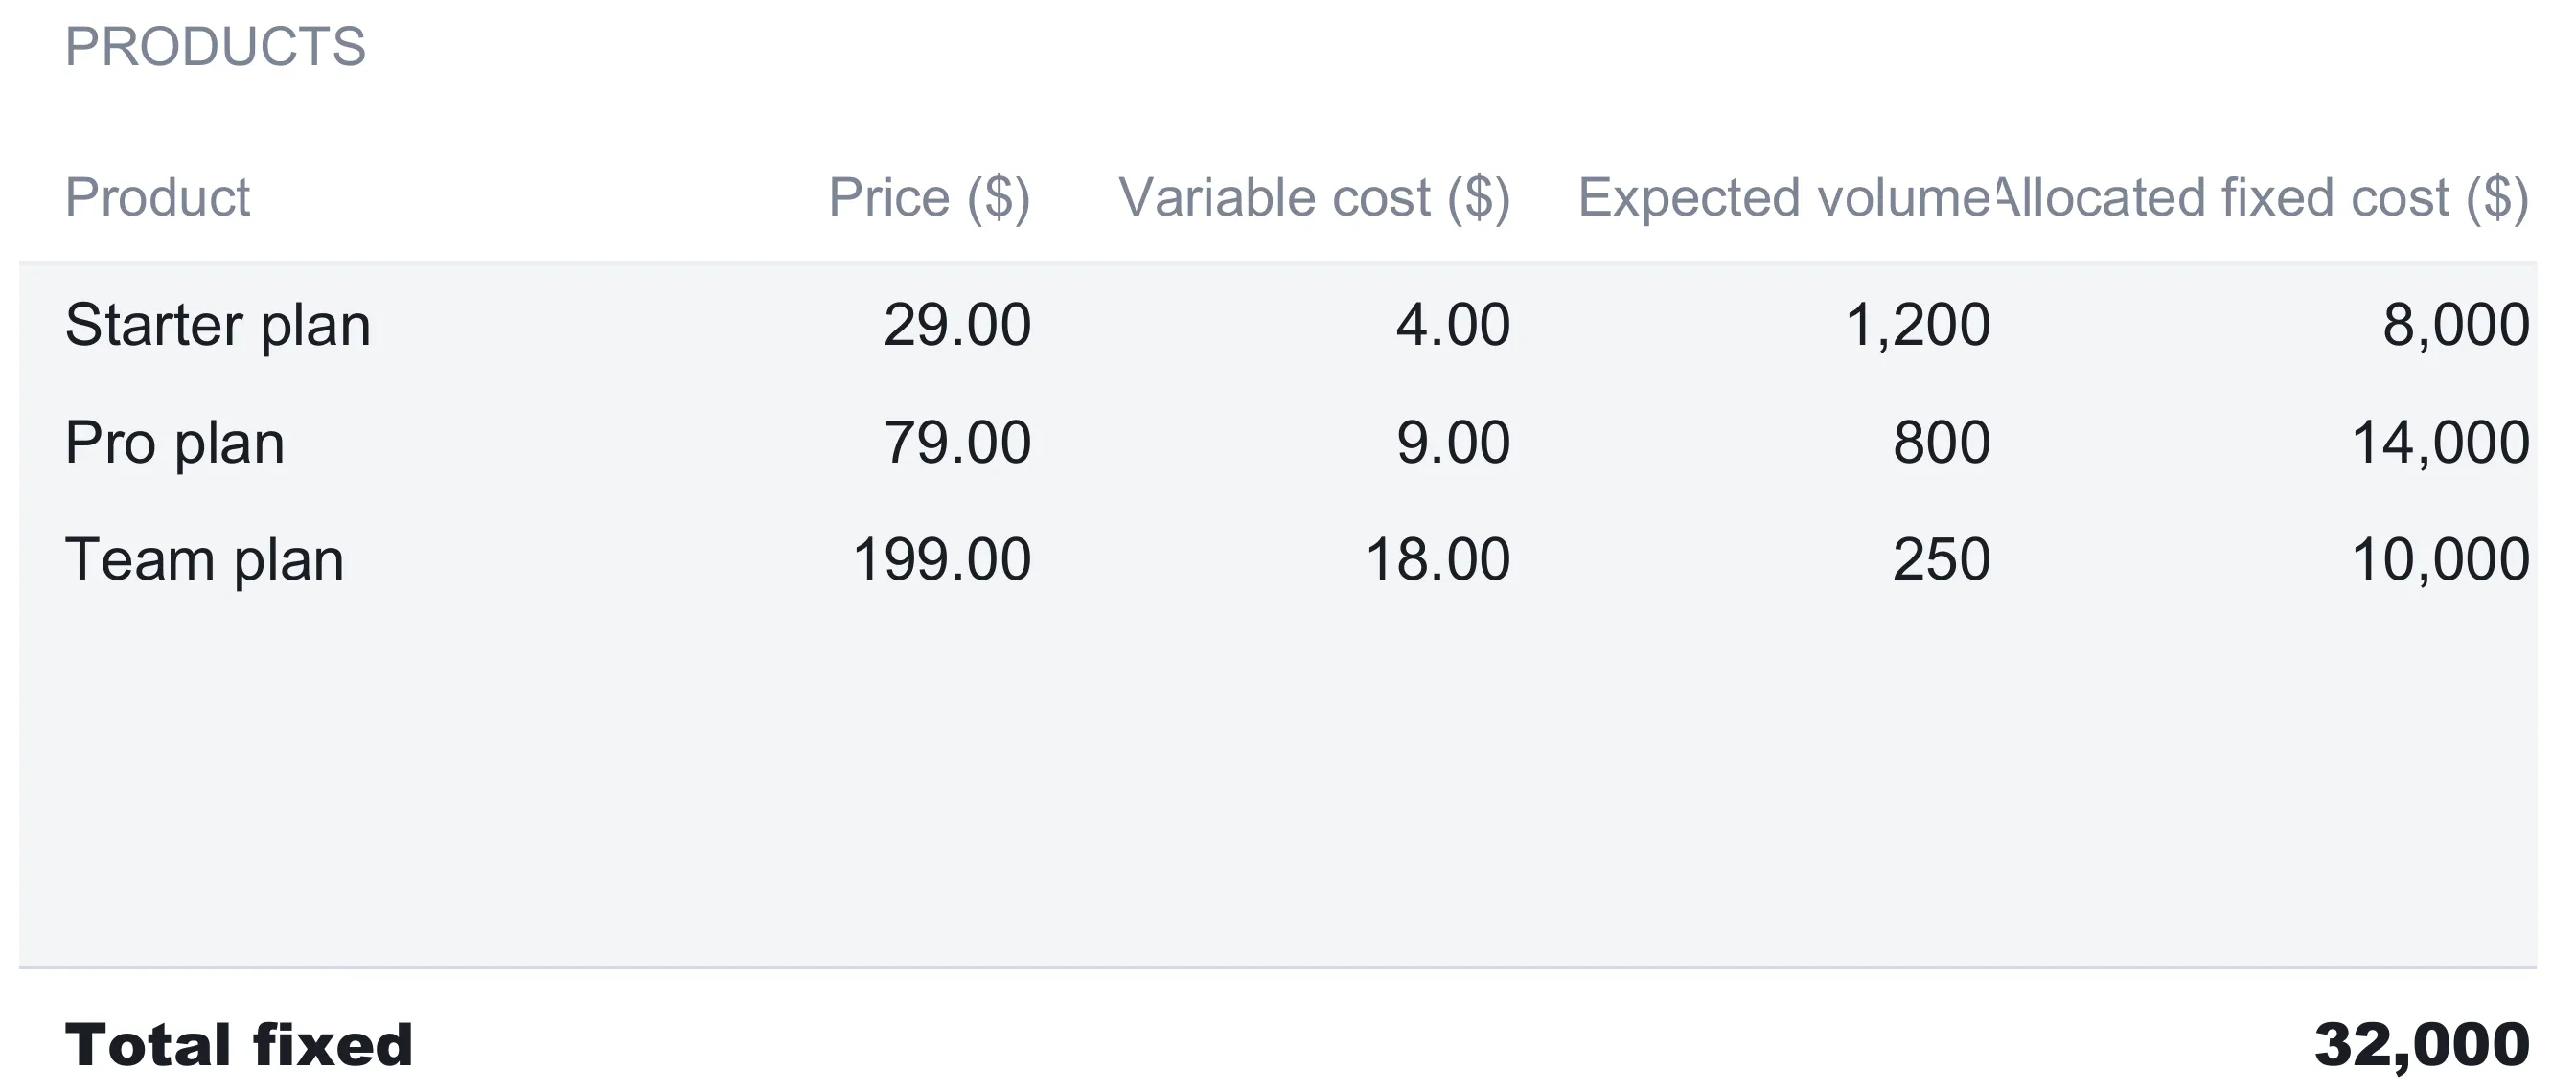
The sheet ships with three products filled and three blank rows below them. Those blanks are not decorative. Each already carries the formulas that feed the Break-Even sheet, the blended composite, and the dashboard chart, so naming a fourth product on the first free row pulls it into every calculation at once. A business with five plans fills five rows; there is nothing to drag down and no range to extend.
The core calculation: the Break-Even sheet
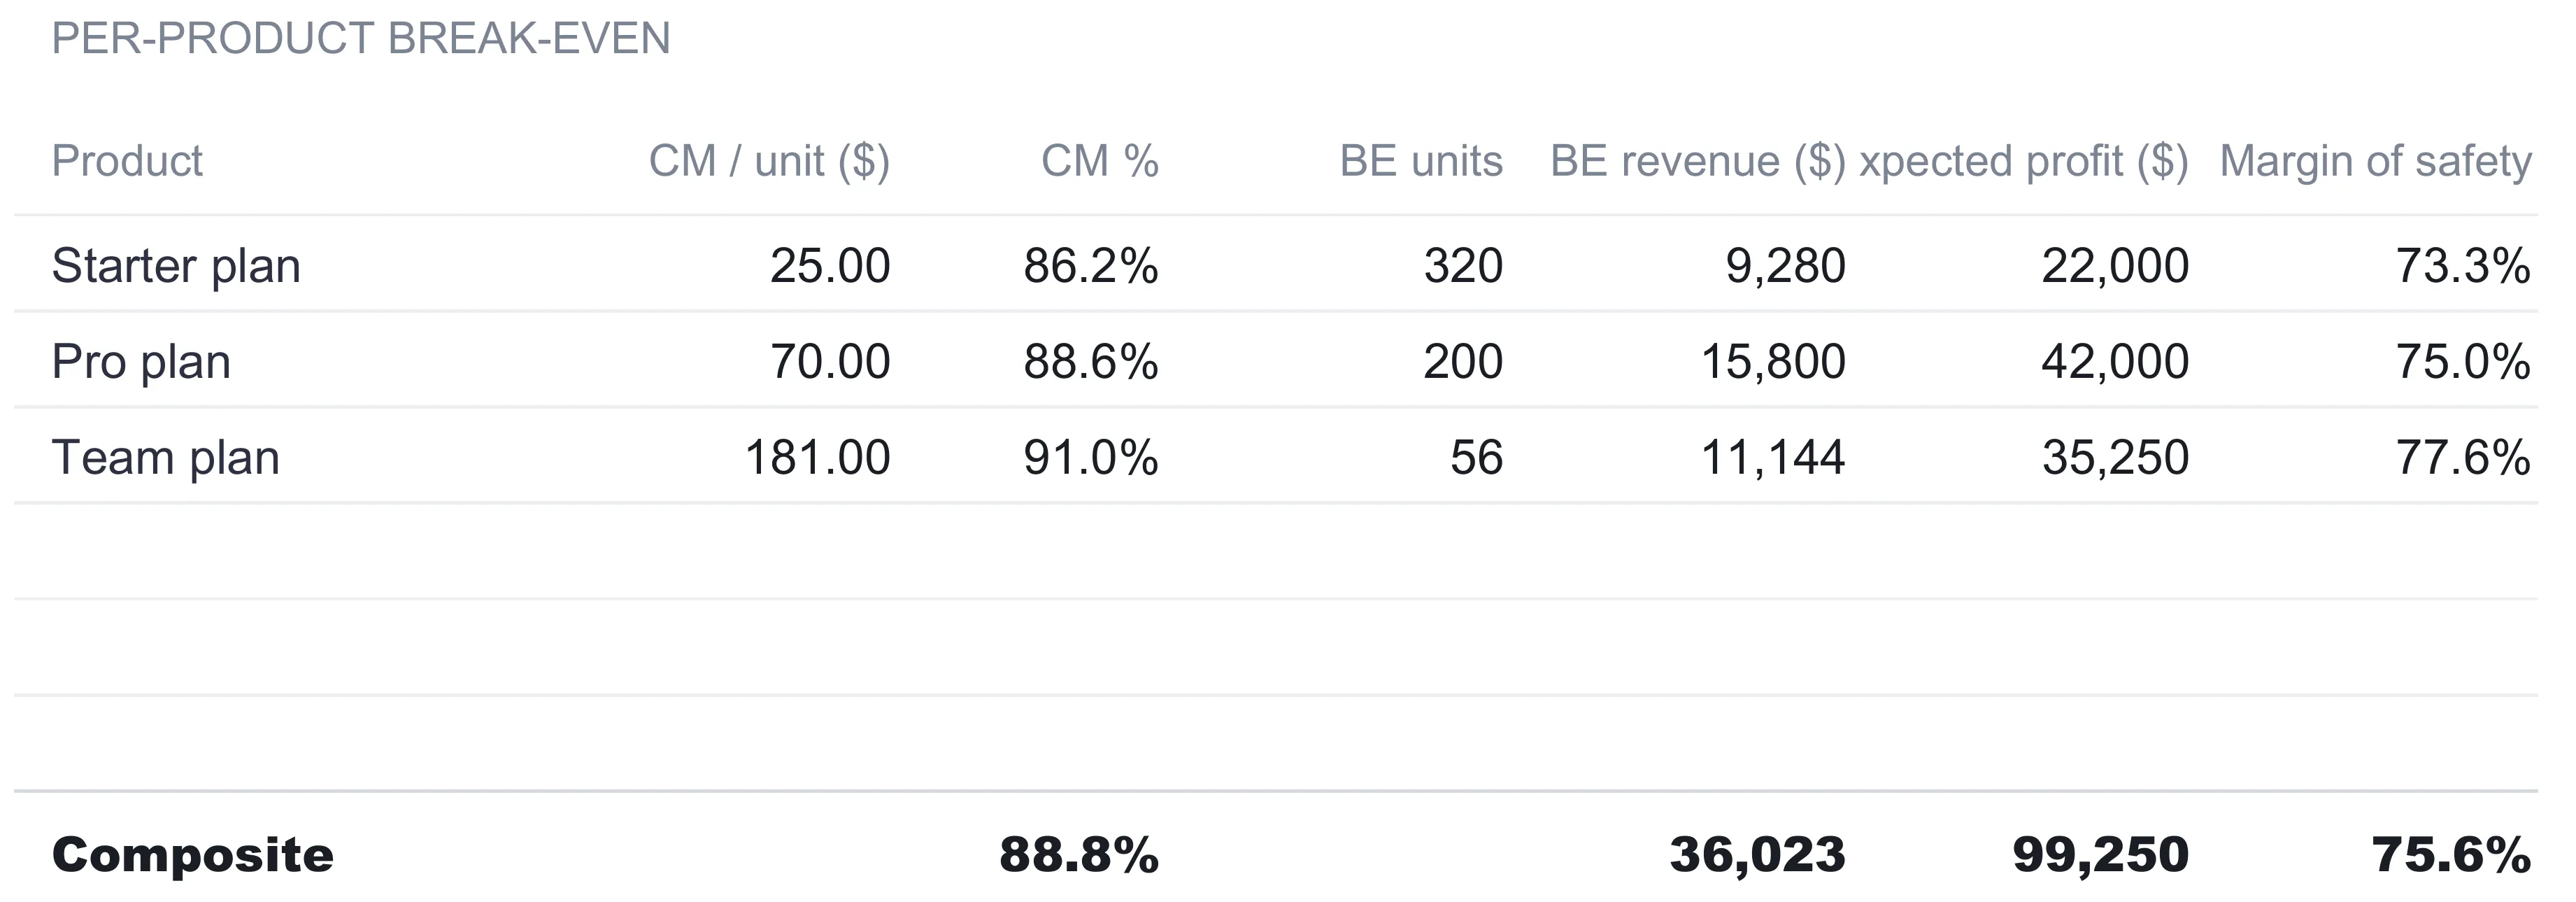
This is where the inputs become answers. The Break-Even sheet computes nothing that has to be typed; every cell reads from Product Inputs. Each product gets six derived figures, and the sample fills in like this.
| Product | CM / unit ($) | CM % | BE units | BE revenue ($) | Expected profit ($) | Margin of safety |
|---|---|---|---|---|---|---|
| Starter plan | 25 | 86.2% | 320 | 9,280 | 22,000 | 73.3% |
| Pro plan | 70 | 88.6% | 200 | 15,800 | 42,000 | 75.0% |
| Team plan | 181 | 91.0% | 56 | 11,144 | 35,250 | 77.6% |
| Composite | 88.8% | 36,023 | 99,250 | 75.6% |
Each column is one short formula, and they chain in order.
Contribution margin per unit is price minus variable cost. The Starter plan sells for $29 and costs $4 a unit to deliver, so $25 of every sale is left to contribute toward fixed cost. Divided by the price, that is a contribution margin of 86.2 percent.
Break-even units is the fixed cost divided by that contribution margin per unit, rounded up to a whole unit. The Starter plan carries $8,000 of allocated fixed cost, and at $25 of contribution each, it takes 8,000 ÷ 25 = 320 units to cover it. The rounding up matters: a fractional unit does not cover the last sliver of fixed cost, so the template always rounds break-even up to the next whole sale. This is the formula the U.S. Small Business Administration states for the break-even point, fixed costs divided by price minus variable costs.
Break-even revenue is simply those break-even units multiplied by the price. For the Starter plan, 320 units at $29 is $9,280 of sales to reach the point where the plan neither makes nor loses money.
Expected profit takes the expected volume from Product Inputs, multiplies it by the contribution margin per unit, and subtracts the fixed cost. The Starter plan expects 1,200 units, which at $25 each is $30,000 of contribution, less the $8,000 of fixed cost, for $22,000 of expected profit.
Margin of safety is the cushion between expected volume and break-even volume, written as a percentage of expected volume. The Starter plan expects 1,200 units and breaks even at 320, so (1,200 - 320) ÷ 1,200 is 73.3 percent. Read plainly, sales could fall by roughly three quarters before the plan slipped into a loss.
The other two plans run the same arithmetic on sharply different economics. The Pro plan sells for $79 against a $9 variable cost, so its contribution margin per unit is $70, or 88.6 percent of the price. Its $14,000 of allocated fixed cost divides by that $70 to break even at 200 units, which is $15,800 of revenue, and at an expected 800 units the plan earns $42,000 for a 75.0 percent margin of safety. The Team plan is higher still: a $199 price and an $18 variable cost leave $181 of contribution, 91.0 percent of the price, so its $10,000 of fixed cost is covered in just 56 units. Expecting 250 units, it earns $35,250 and carries the widest cushion of the three at 77.6 percent.
Set side by side, the three plans show a pattern worth naming. Break-even units fall as the price climbs, from 320 for the Starter plan to 200 for the Pro plan to 56 for the Team plan, because each higher-priced sale contributes far more toward the overhead its own plan carries. The Pro plan shoulders the largest allocation of the three at $14,000 and still clears it in 200 units. A business does not need many Team plans to cover its overhead, but it needs a great many Starter plans, and the break-even column puts exact figures on an intuition that is otherwise easy to feel and hard to size.
The composite row: break-even for the whole line
The bold Composite row at the bottom answers a different question from the per-product rows. It is not the sum of the three break-even points, and it is not their average. It is the break-even for the business as a whole, given that the three plans sell together in a particular mix.
The method is to blend the contribution margins by revenue. The three plans expect $147,750 of revenue in total and $131,250 of that is contribution once variable costs are paid, so the blended contribution margin is 88.8 percent. Dividing the full $32,000 of fixed cost by that blended margin gives a break-even revenue of $36,023 for the whole line. The composite expected profit, $99,250, is the sum of the three per-product profits, and the composite margin of safety, 75.6 percent, measures the gap between $147,750 of expected revenue and the $36,023 break-even.
Those totals come from the three plans in proportion. The Starter plan brings $34,800 of expected revenue, the Pro plan $63,200, and the Team plan $49,750. The Pro and Team plans carry both higher prices and richer margins, so they pull the blend up toward their own contribution rates and away from the Starter plan’s 86.2 percent. That weighting is why the line as a whole settles at 88.8 percent rather than a plain average of the three figures. The weighting is what makes the composite trustworthy: a business selling mostly low-margin units cannot flatter its blended break-even by owning a single high-margin product it barely sells.
In practice the composite and the per-product rows answer two separate questions. The per-product break-evens show which plans carry their own weight; the composite shows whether the business as a whole clears its costs. A product can sit below its own break-even while the line as a whole stays comfortably above the blended one, which is exactly the situation the two views together are built to reveal.
One guard rail runs through every row. If a product is ever priced at or below its variable cost, there is no volume that breaks even, because each sale loses money. Rather than print a nonsense figure, the template writes N/A into the break-even units, revenue, and margin-of-safety cells for that product, while still showing the loss in the expected-profit column. The problem stays visible instead of hiding behind a division that quietly went negative.
Stress-test the answer: the Sensitivity sheet
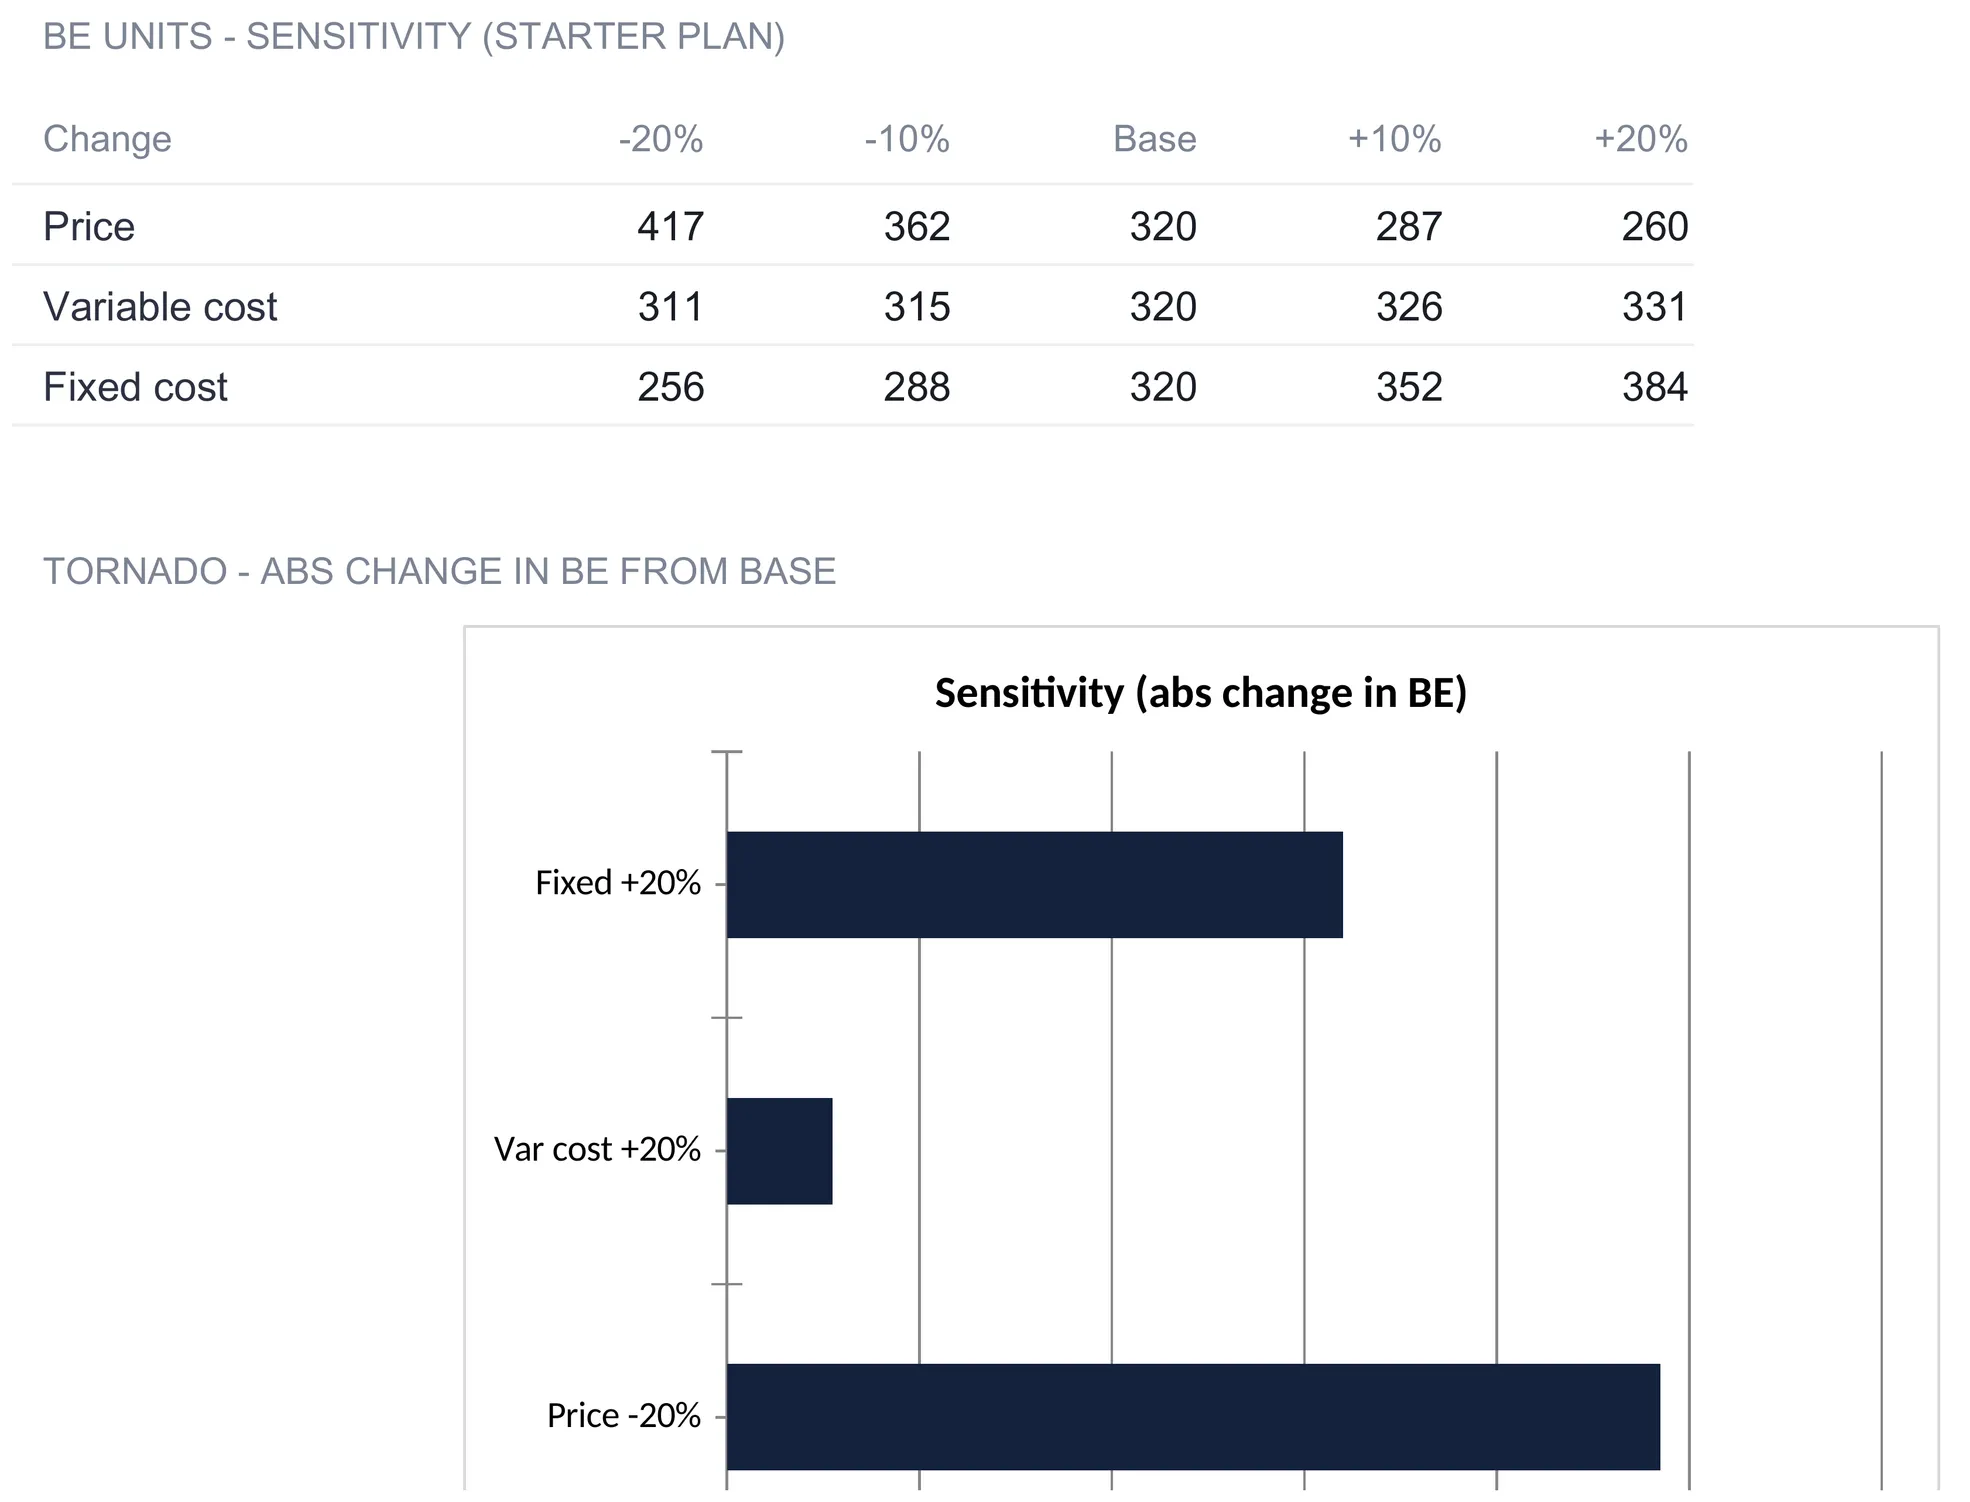
A break-even point is only as solid as the inputs behind it, and prices and costs move. The Sensitivity sheet takes the first product, the Starter plan, and recomputes its break-even units as price, variable cost, and fixed cost each swing from minus twenty percent to plus twenty percent around their base values.
| Change | -20% | -10% | Base | +10% | +20% |
|---|---|---|---|---|---|
| Price | 417 | 362 | 320 | 287 | 260 |
| Variable cost | 311 | 315 | 320 | 326 | 331 |
| Fixed cost | 256 | 288 | 320 | 352 | 384 |
The base case is 320 units in all three rows, because that is the Starter plan’s break-even before anything is flexed. What the grid reveals is how unevenly the three levers move it. A twenty percent price cut pushes break-even from 320 units up to 417, a jump of 97 units, because a lower price thins the contribution margin on every sale. The same twenty percent swing in variable cost moves break-even by only a handful of units, from 320 to 331, since variable cost is a small part of a high-margin plan. Fixed cost sits in between: a twenty percent rise lifts break-even to 384.
A tornado chart below the grid plots those three swings as horizontal bars, and their lengths carry the lesson at a glance. The price bar is the longest at 97 units, the fixed-cost bar reaches 64, and the variable-cost bar is a stub at 11. For this plan, the break-even point is far more sensitive to a discount than to a cost overrun, which is the kind of insight that a single break-even number can never show on its own. The sheet notes that the analysis is shown for the first product, so pointing the sensitivity at a different plan means reordering the inputs so that plan sits first.
The dashboard: four numbers and a verdict
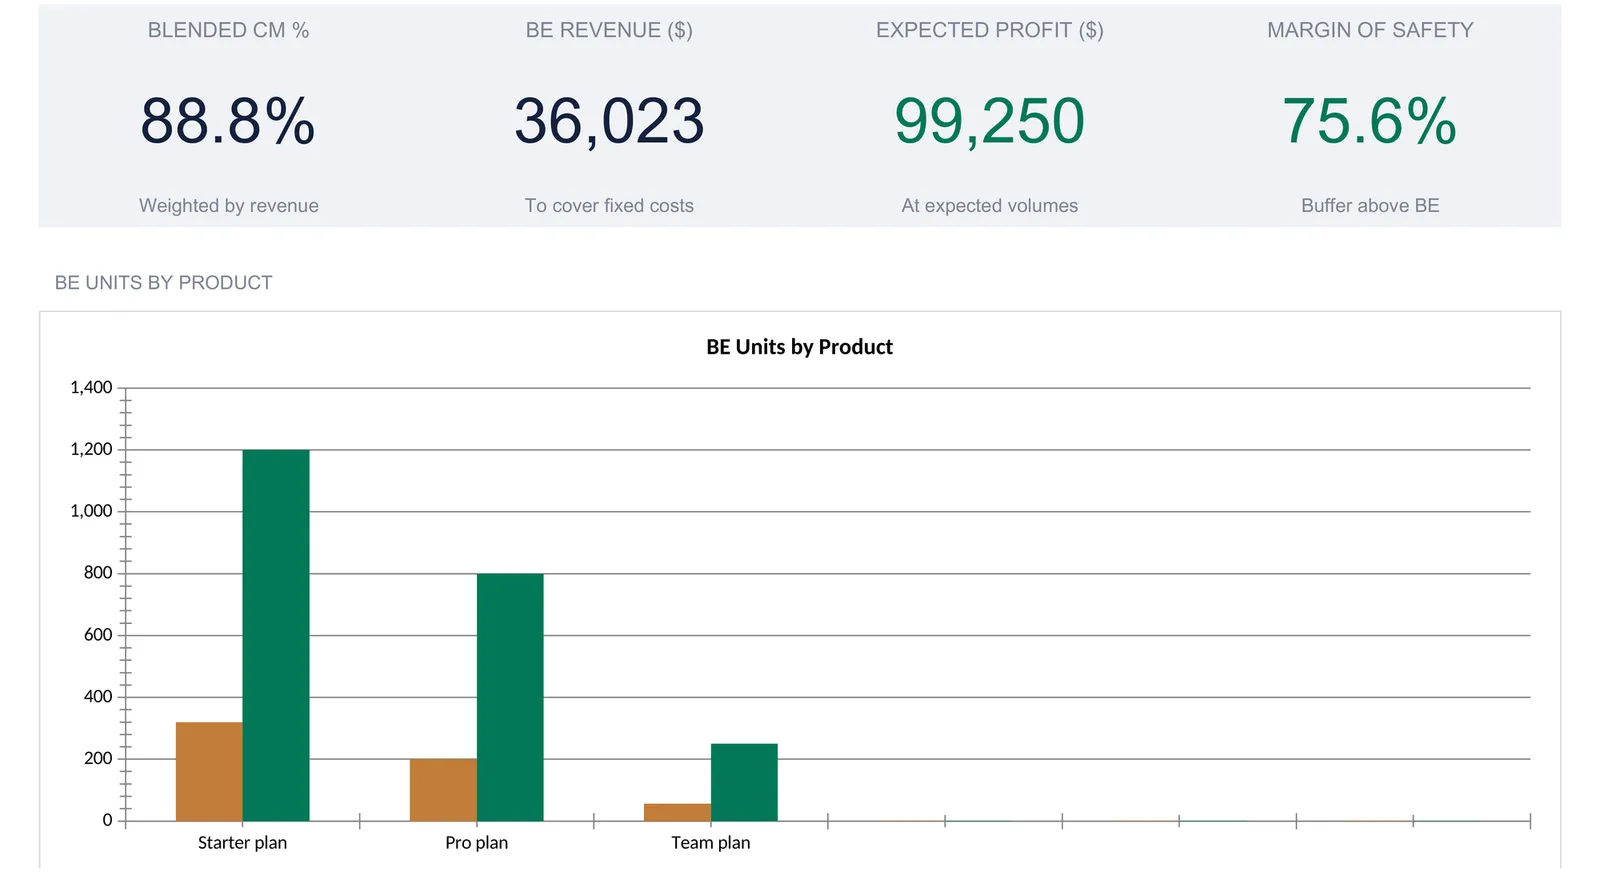
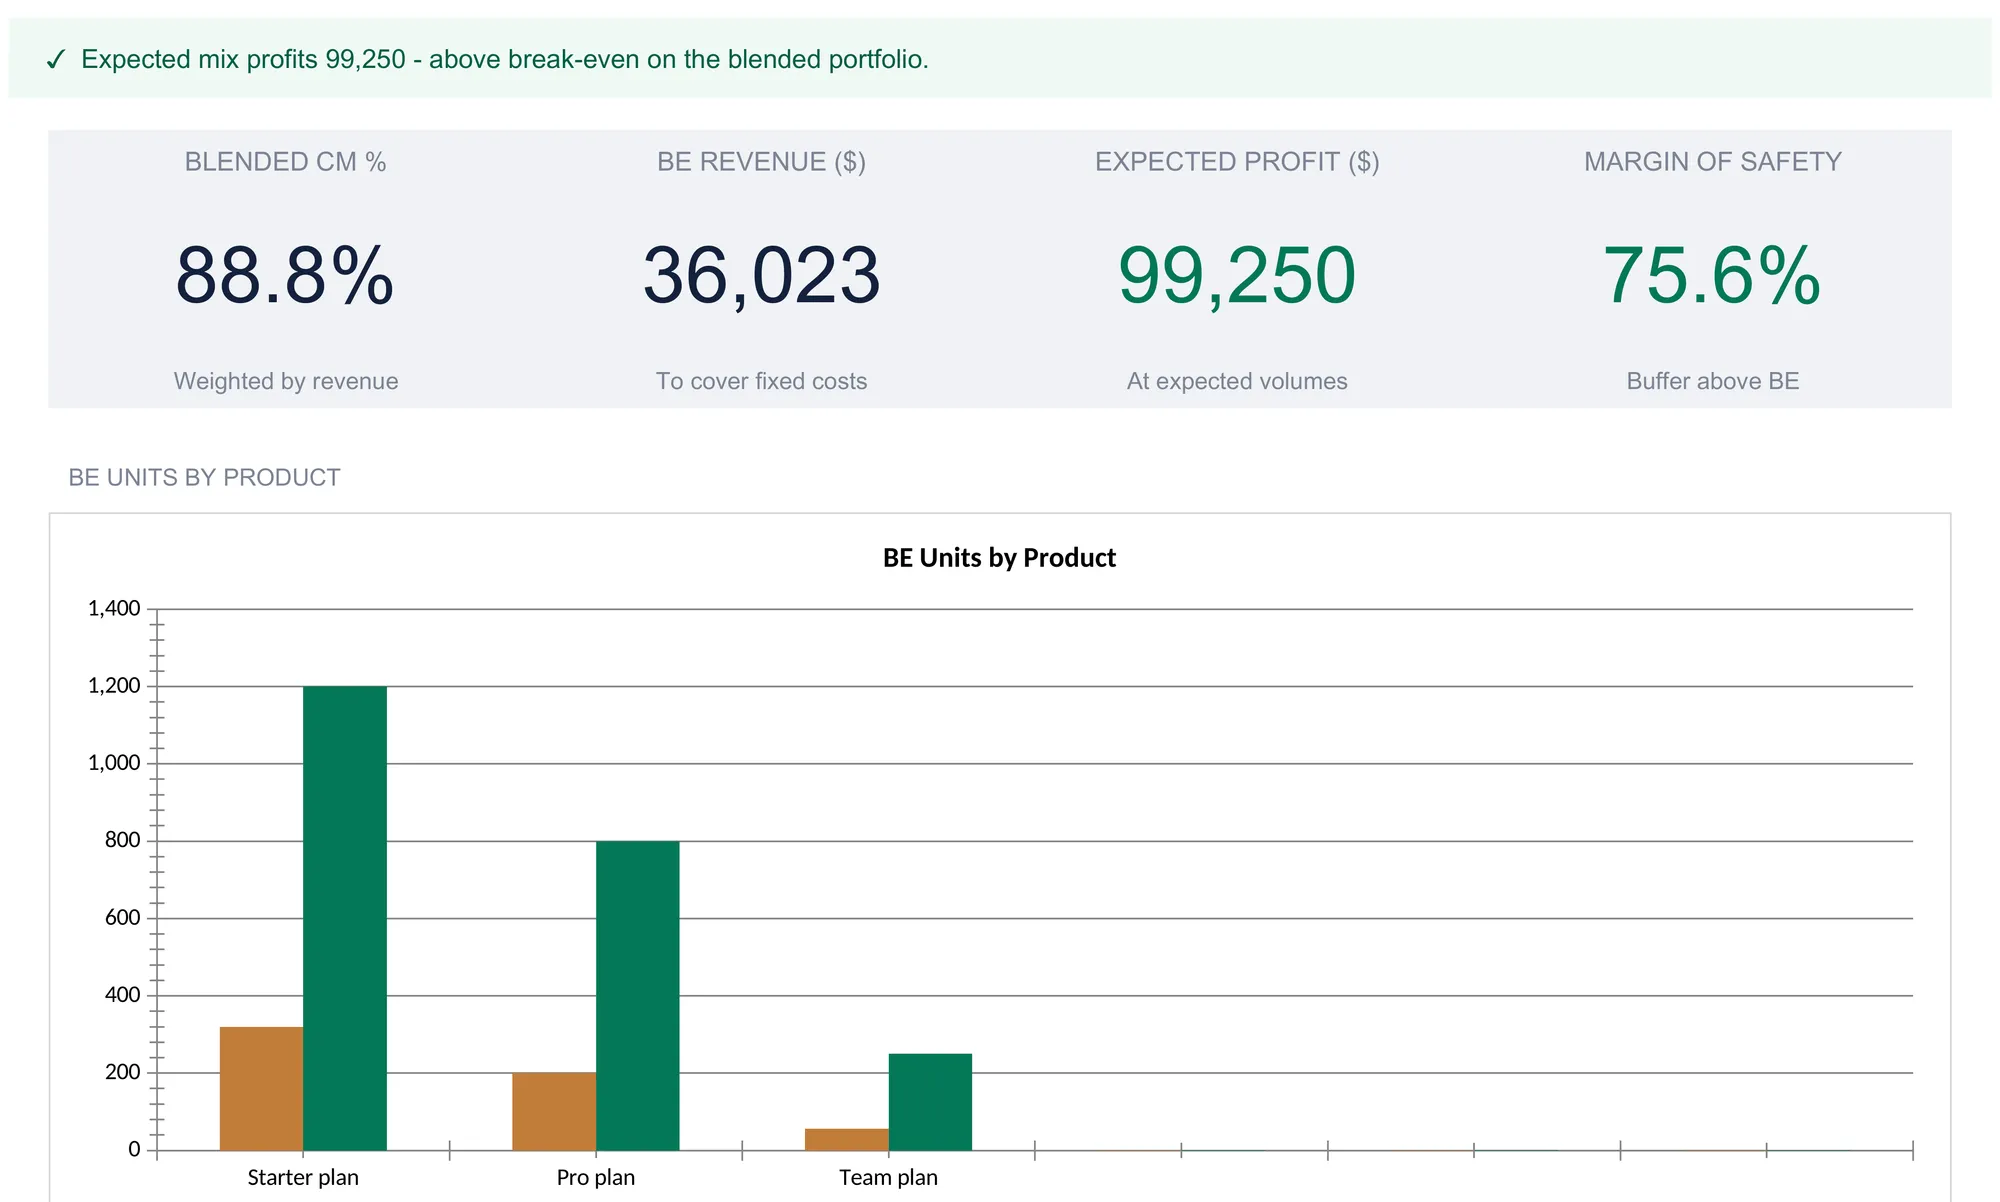
With Product Inputs filled, the Dashboard computes the headline view. Four KPI tiles carry the blended figures: an 88.8 percent blended contribution margin, a $36,023 break-even revenue to cover fixed costs, $99,250 of expected profit at expected volumes, and a 75.6 percent margin of safety above break-even. A status line across the top sums up the position in one sentence, reading that the expected mix profits $99,250 and sits above break-even on the blended portfolio; it flips to a warning the moment the blended profit turns negative, so a business that has slipped underwater says so as soon as the file opens.
Below the tiles, a grouped bar chart plots break-even units against expected volume for each plan. Seeing the two bars side by side is the whole point of a break-even analysis in one picture: the gap between the short break-even bar and the tall expected-volume bar is the margin of safety made visible. The Starter plan breaks even at 320 units against an expected 1,200, and that yawning gap is exactly why its margin of safety reads 73.3 percent.
The blended break-even is the number no accounting report puts in front of an owner. A profit-and-loss statement shows what happened after the fact; the break-even point shows how much has to happen before the business is whole. The fixed and variable costs that feed it are the same figures a business records in its day-to-day bookkeeping, which is where the raw numbers behind every input on the Product Inputs sheet come from.
Contribution margin, margin of safety, and the break-even point in plain terms
Three ideas carry the analysis, and none of them is complicated once the labels come off.
Contribution margin is what one sale leaves behind after its own variable cost. Sell a Starter plan for $29, pay $4 to deliver it, and $25 is left to help cover the overhead. Until the overhead is fully covered, that $25 goes to fixed cost; after it is covered, the same $25 is profit.
The break-even point is the sale at which the overhead is finally covered. Stack up enough $25 contributions to reach the $8,000 of fixed cost and the 320th sale is the one that closes the gap. Everything before it was paying down the fixed cost; everything after it is profit.
Margin of safety is how much room there is to be wrong. A plan expecting 1,200 sales that breaks even at 320 has a wide cushion; a plan expecting 300 sales that breaks even at 280 is running close to the edge. The percentage puts a single number on how far demand can fall before a product stops paying for itself.
Excel or Google Sheets for a break-even analysis
The template is an .xlsx file built on plain arithmetic, with no macros and no add-ons, so it behaves identically in Microsoft Excel and in Google Sheets after an upload. Excel suits an owner who keeps a local model on one machine; Google Sheets suits a founder and a bookkeeper editing the same file from different places. The formulas described here, price minus variable cost, fixed cost divided by contribution margin, and the rest, are standard spreadsheet functions in either program, so the structure is equally buildable by hand in both.
The workbook keeps its own documentation on a How to Use sheet, which restates every formula in words: contribution margin as price minus variable cost, break-even units as fixed cost divided by that margin rounded up to a whole unit, break-even revenue as units times price, and margin of safety as the gap between expected and break-even volume over expected volume. It also records the N/A rule for a price that fails to clear its variable cost, and the note that naming a spare product row pulls it into every calculation. Nothing in the model is hidden behind a black box; the same arithmetic laid out here sits one sheet away inside the file, which is what makes the whole thing auditable rather than something to trust on faith.
Which template fits the question
- Break-Even Analysis Spreadsheet Template ($29) is the workbook this walkthrough follows: per-product and blended break-even, contribution margin, margin of safety, a sensitivity grid, and the four-tile dashboard, ready for up to six products.
- Sales Forecasting Spreadsheet Template ($29) works on the side of the equation break-even treats as a given. Break-even asks what has to sell to cover the costs; that workbook projects the next 12 months of sales from your own last 12 months and a growth rate, in low, base, and high bands, next to a pipeline weighted by win probability.
Related
- How to Do Bookkeeping in a Spreadsheet - where the real fixed and variable costs behind a break-even come from
- How to Build 5-Year Financial Projections in a Spreadsheet - carrying the same unit economics forward across a multi-year plan
- How to Value a Business in a Spreadsheet - what those margins and volumes are ultimately worth
Frequently asked questions
What is the difference between break-even units and break-even revenue?
They are the same point measured in two units. Break-even units is the count of items that has to sell to cover fixed cost, found by dividing fixed cost by the contribution margin per unit. Break-even revenue is that same unit count multiplied by the price, so it reads in currency instead of items. In the worked example the Starter plan breaks even at 320 units, which at $29 each is $9,280 of revenue. Units suit a physical product you count; revenue suits a service or a blended line where the mix of items varies.
How is contribution margin different from gross margin?
Contribution margin subtracts only the variable cost of a unit from its price, so it isolates what each sale contributes toward fixed cost and profit. Gross margin subtracts the full cost of goods sold, which often bundles some fixed production overhead in with the variable part. Break-even math needs the variable-only figure, because the whole method rests on separating costs that move with volume from costs that do not. The template computes contribution margin per unit as price minus variable cost, then divides by price for the percentage.
Why is the blended break-even not just the sum of the per-product break-evens?
Adding the per-product break-even units would assume each product covers only its own slice of fixed cost in isolation, which ignores that they sell together in a mix. The composite instead blends the contribution-margin percentages weighted by each product's share of expected revenue, then divides total fixed cost by that blended percentage. In the example the three plans blend to an 88.8 percent contribution margin and a $36,023 break-even revenue against $32,000 of fixed cost, which is a different figure from stacking the three separate break-even points.
What happens if a product's price is below its variable cost?
There is no break-even at any volume, because every unit sold widens the loss rather than closing it. The template handles this directly: when price is at or below variable cost, the break-even units, break-even revenue, and margin-of-safety cells read N/A rather than a misleading number. The expected-profit cell still shows the loss at the expected volume, so the shortfall is visible instead of hidden behind an error.
Can the template track more than three products?
The Product Inputs sheet ships with three filled rows and three spare rows already wired into every downstream calculation. Naming a spare row adds that product to the Break-Even sheet, the blended composite, and the dashboard chart automatically, with no formula to copy. The sample uses three software plans, but the same six-row structure works for any small product line where each item has its own price, variable cost, and expected volume.
Sources
- Calculate your startup costs (break-even point) - U.S. Small Business Administration
About this article
Template sheets, inputs, figures, and formulas checked on 2026-09-10 against the shipped Break-Even Analysis Pro workbook (Dashboard, Product Inputs, Break-Even, Sensitivity, Settings, and How to Use tabs) and the screenshots used in this article. The break-even definition and the fixed-cost-over-contribution-margin formula were checked against the live U.S. Small Business Administration guidance at writing time. Last reviewed September 2026.