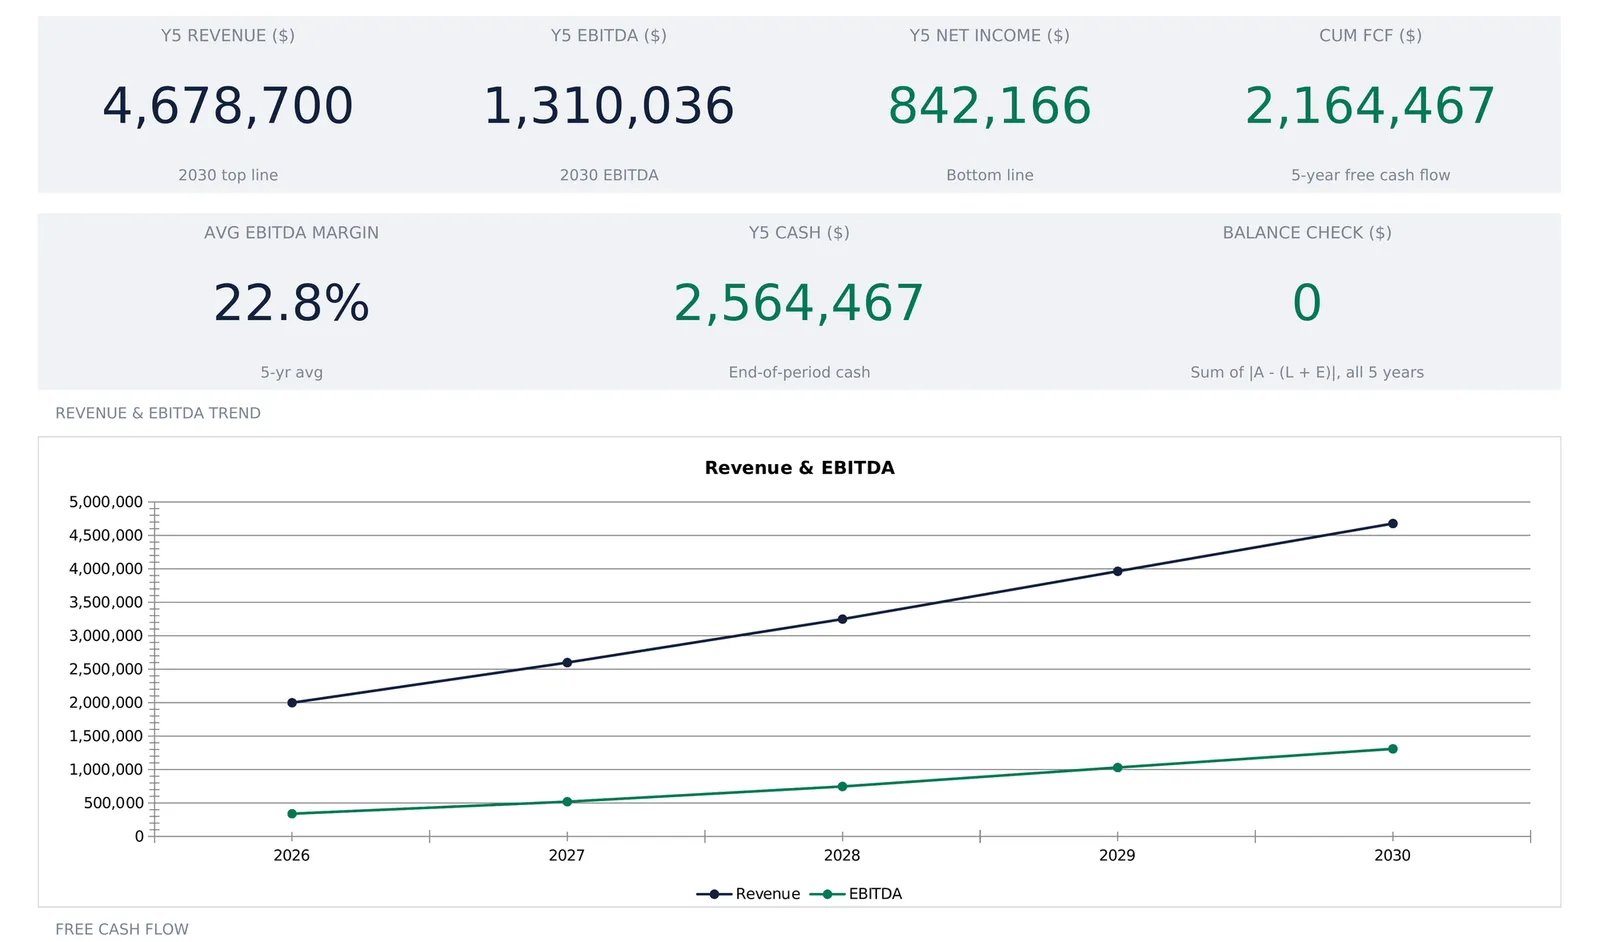
A five-year projection is not a revenue line stretched across five columns. It is three statements that agree with each other, five years running. This walkthrough covers the structure using a worked example: a business opening with $400,000 of cash and $2,000,000 of Year 1 revenue, projected to $4,678,700 of revenue, $1,310,036 of EBITDA, and $2,564,467 of cash by year five, with a balance check that reads zero in every year. Our 5-Year Financial Projections template ($49) ships the same structure ready-made for Excel and Google Sheets.
Five-year projections are a genre with an audience. A bank asks for them, an investor asks for them, and the SBA’s guidance on writing a business plan asks for “a prospective financial outlook for the next five years” built from “forecasted income statements, balance sheets, cash flow statements, and capital expenditure budgets.”
That last part is where most attempts come apart. The ask is not a revenue line stretched across five columns. It is a three-statement model: an income statement, a cash flow statement, and a balance sheet that agree with each other, five years running, with the profit on one showing up as cash on another and as equity on a third. Build those three separately and they drift by year two. Build them as one linked model and the arithmetic polices itself.
The examples below come from our 5-Year Financial Projections Spreadsheet Template ($49), which ships that structure ready-made for Excel and Google Sheets. The sample file models a business called Aurora Cloud Inc. opening with $400,000 of cash and $2,000,000 of Year 1 revenue. The layout is reproducible by hand if you would rather build your own.
What a 5-year financial projections spreadsheet has to hold
Strip away the formatting and there are four kinds of information, only two of which are ever typed:
- An opening balance sheet. Where the business stands at the end of Year 0: cash, receivables, inventory, payables, net fixed assets, and the equity that funds them. A model that starts from nothing cannot produce a balance sheet that balances.
- A Year 1 baseline. One revenue figure. Everything after it is growth applied to that number.
- Per-year drivers. Growth, margin, cost ratios, working capital days, and a tax rate, set separately for each of the five years rather than once for all of them.
- Three linked statements. Income statement, cash flow, and balance sheet, each reading from the others so that one change moves all three.
The template gives each group its own sheet. Settings holds the opening balance sheet and the Year 1 revenue, Drivers holds the assumptions, and Income Statement, Cash Flow, and Balance Sheet compute the outcome. A Dashboard sits on top and a How to Use sheet carries the definitions. Seven sheets, 56 shaded entry cells across Settings and Drivers, and every other number in the file is a formula.
Settings: the opening balance sheet and one revenue figure
Twelve shaded cells sit on Settings, and they decide more than their number suggests.
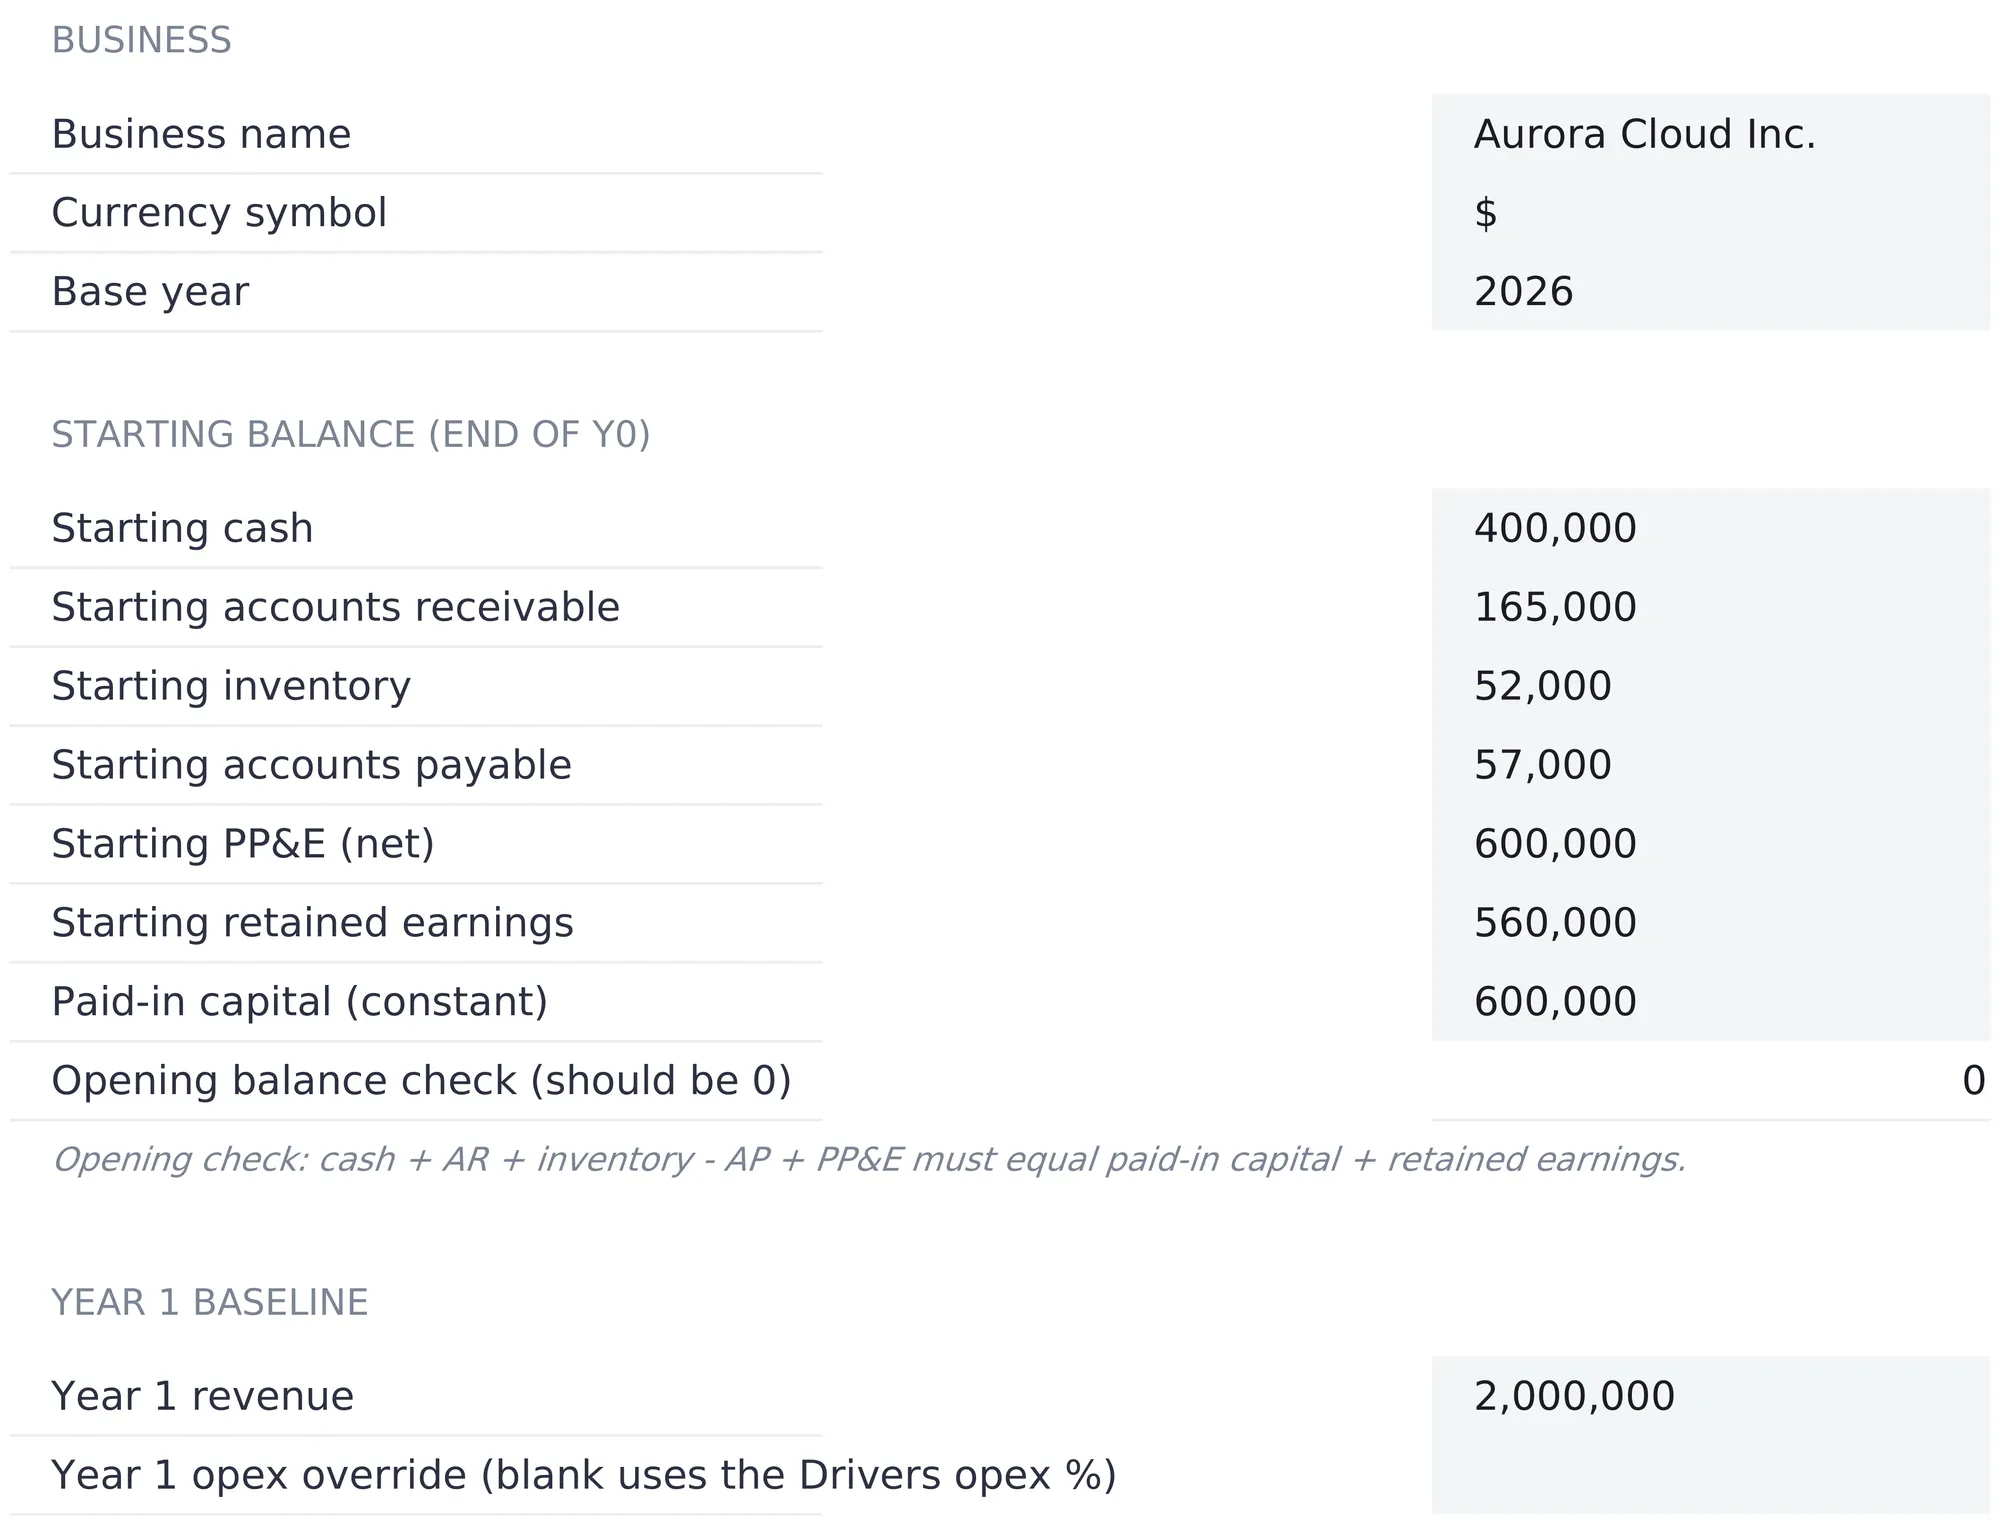
Three are administrative. A business name that appears under the title on the dashboard and each statement sheet, a currency symbol, and a base year. That last one is quietly structural. Every year column in the workbook is the base year plus zero through four, so the sample’s 2026 produces columns for 2026, 2027, 2028, 2029, and 2030. The subtitle across the top of each statement reads “2026 - 2030 · Currency: $”. One cell relabels the whole file.
Seven cells hold the opening balance sheet at the end of Year 0. The sample business starts with $400,000 of cash, $165,000 of accounts receivable, $52,000 of inventory, $57,000 of accounts payable, $600,000 of net PP&E, $560,000 of retained earnings, and $600,000 of paid-in capital. That paid-in figure stays constant across all five years.
Underneath them is a row that earns its place. The opening check adds cash, receivables, inventory, and net PP&E, subtracts payables, and compares the result against paid-in capital plus retained earnings. In the sample, $400,000 plus $165,000 plus $52,000 minus $57,000 plus $600,000 is $1,160,000, and the two equity lines add to the same $1,160,000, so the row reads 0. Taken off a real trial balance, those seven numbers land on zero by construction. Estimated, they usually do not, which is what the row is there to say before anything downstream gets built on top.
The last two cells are the Year 1 baseline: revenue of $2,000,000, and an opex override that is deliberately left blank. Leaving it empty tells the Income Statement to compute Year 1 operating expenses from the Drivers percentage. Typing a figure in replaces that calculation for Year 1 only, which is useful when the first year’s cost base is already known from a signed budget rather than a ratio. Years 2 through 5 follow the driver either way.
The currency symbol comes from a dropdown of 35 options. Choosing one relabels every money header and KPI tile across the workbook, with no conversion of the underlying numbers.
Drivers: 44 assumptions on one page
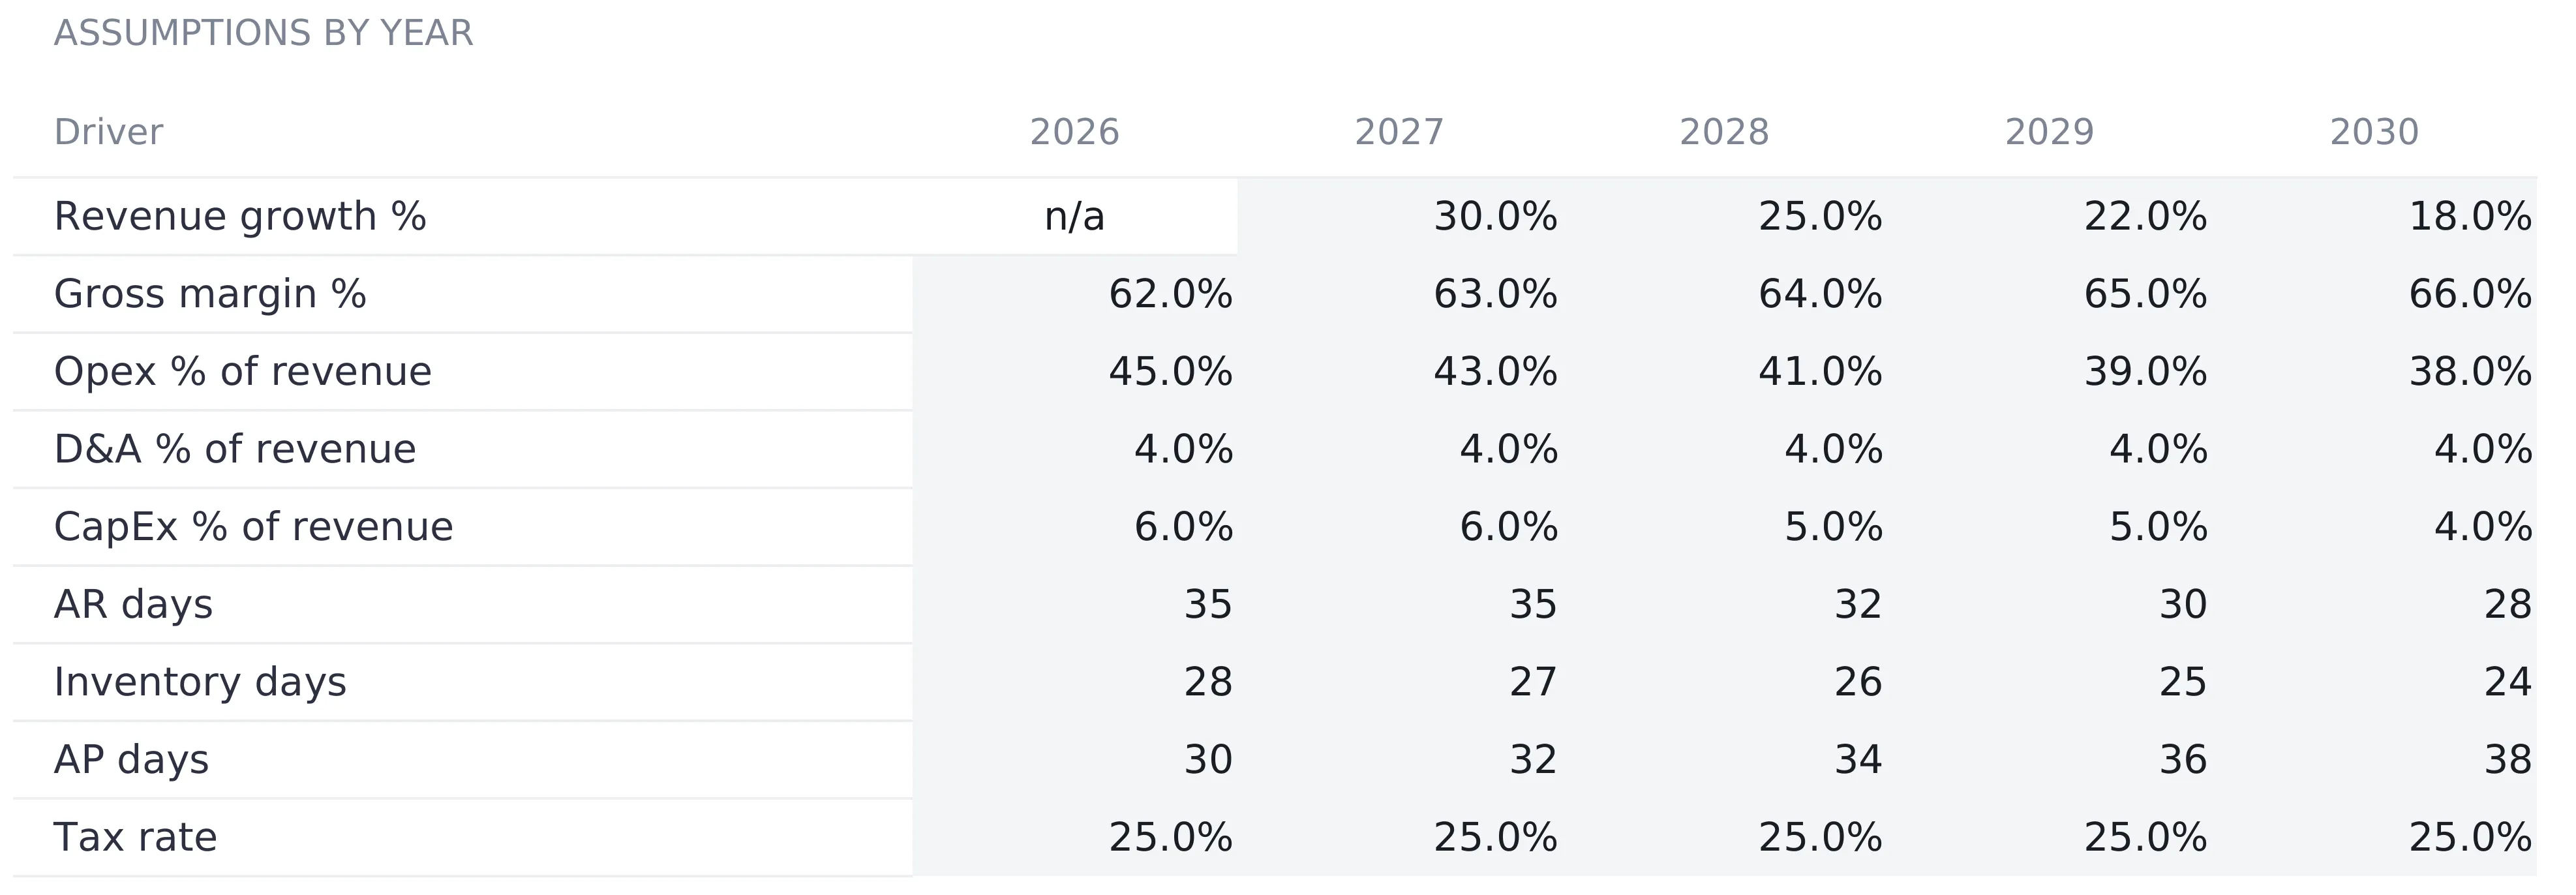
Every assumption in the model lives on one grid of nine rows by five years. Nothing is hidden inside a formula on a statement sheet, which is what makes the model auditable by someone who did not build it.
| Driver | 2026 | 2027 | 2028 | 2029 | 2030 |
|---|---|---|---|---|---|
| Revenue growth % | n/a | 30.0% | 25.0% | 22.0% | 18.0% |
| Gross margin % | 62.0% | 63.0% | 64.0% | 65.0% | 66.0% |
| Opex % of revenue | 45.0% | 43.0% | 41.0% | 39.0% | 38.0% |
| D&A % of revenue | 4.0% | 4.0% | 4.0% | 4.0% | 4.0% |
| CapEx % of revenue | 6.0% | 6.0% | 5.0% | 5.0% | 4.0% |
| AR days | 35 | 35 | 32 | 30 | 28 |
| Inventory days | 28 | 27 | 26 | 25 | 24 |
| AP days | 30 | 32 | 34 | 36 | 38 |
| Tax rate | 25.0% | 25.0% | 25.0% | 25.0% | 25.0% |
Forty-five cells, forty-four of them shaded as entries. The exception is Year 1 revenue growth, which reads n/a because Year 1 revenue is the typed figure on Settings and has nothing to grow from.
A per-year grid rather than a single rate per assumption is the design decision that matters most here. It lets growth decelerate from 30 percent to 18 percent while margins improve in the same model, a shape most businesses recognize and a single-rate model cannot express. It also makes each assumption argue for itself in public. A gross margin climbing four points over five years is a claim someone can push back on when it sits in a labeled row, and invisible when it is buried inside a COGS formula.
The three working capital rows deserve a second look, because they are the ones people leave at a default. Receivable days tighten from 35 to 28, inventory days from 28 to 24, and payable days stretch from 30 to 38. Each of those is an operational assumption about collections, stock turns, and supplier terms, and together they decide how much of the profit turns into cash. A business with a year of history can read its own starting point off the accounts: receivables divided by revenue, times 365, is the AR days it runs today.
The Income Statement: one typed number and nine ratios
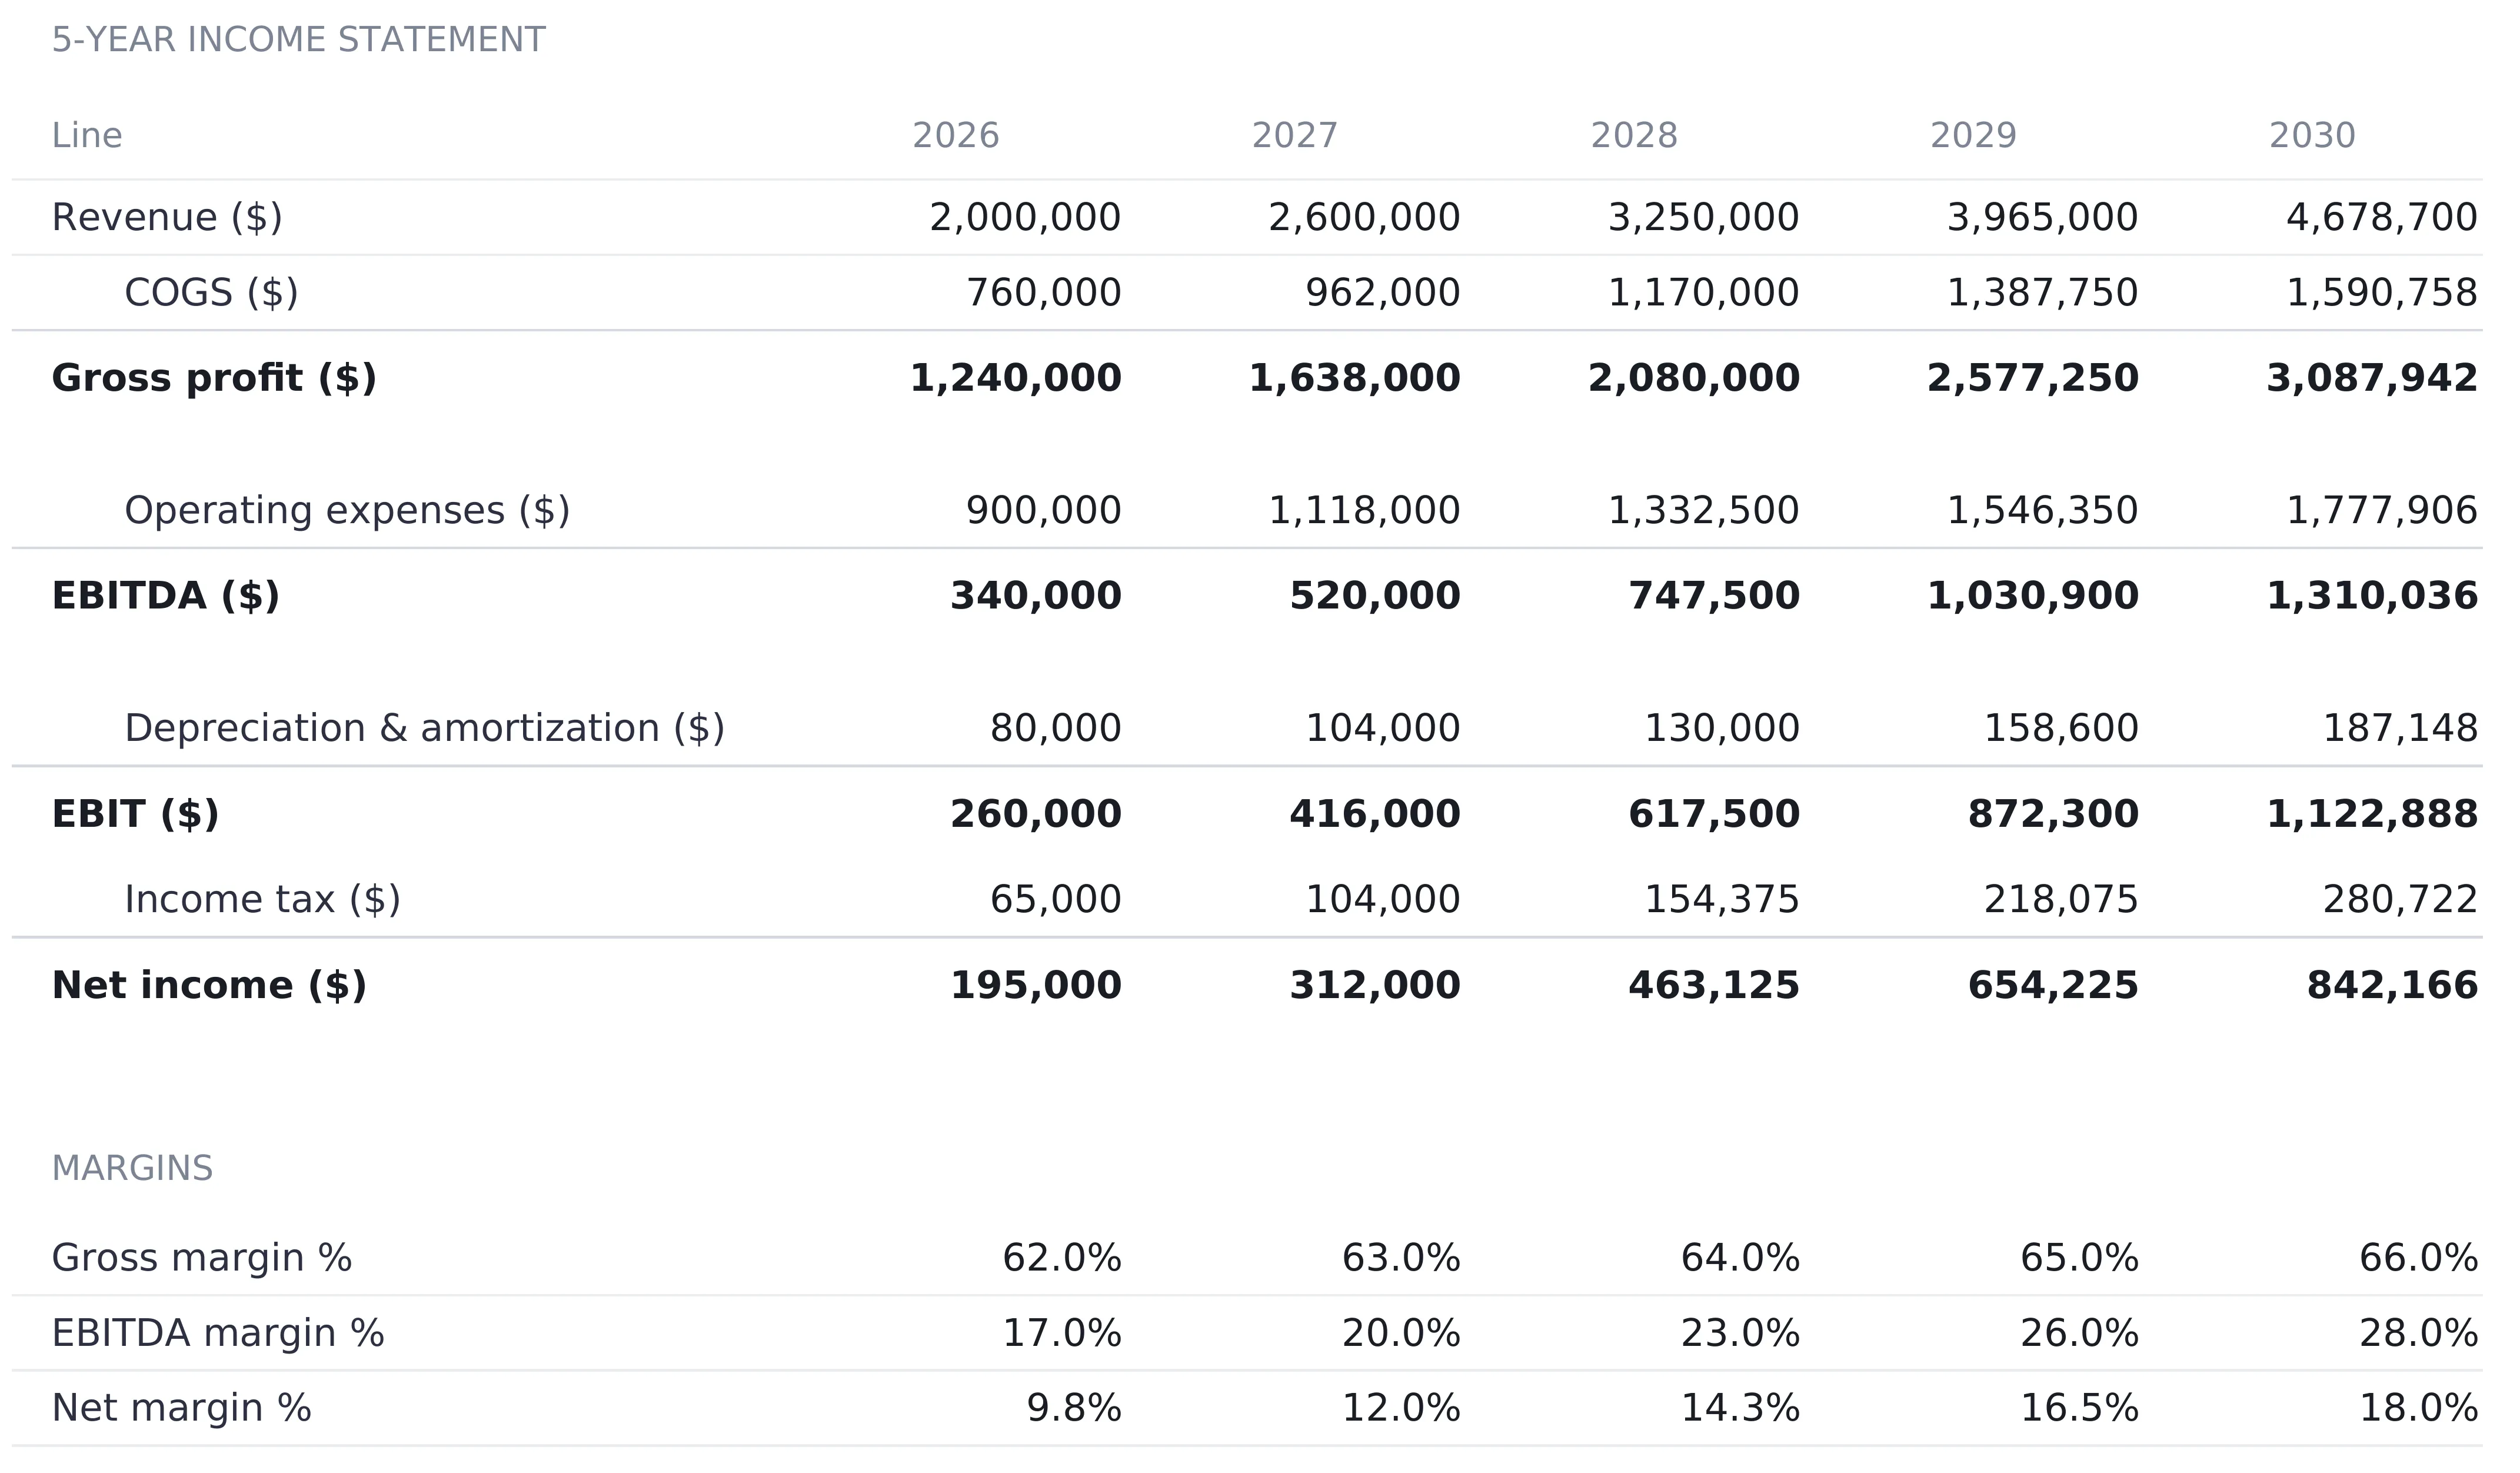
Nothing on this sheet is an entry cell. Revenue in 2026 is the Settings figure, and each later year multiplies the previous one by that year’s growth driver, so $2,000,000 becomes $2,600,000, $3,250,000, $3,965,000, and $4,678,700. Over the five years the top line grows to 2.34 times its starting size.
Everything below revenue is a percentage of it. COGS is revenue times one minus the gross margin driver, which produces $760,000 in 2026 rising to $1,590,758 in 2030, and gross profit follows at $1,240,000 rising to $3,087,942. Operating expenses are the opex percentage applied to revenue, $900,000 in 2026 and $1,777,906 in 2030. EBITDA is gross profit minus opex.
| Line | 2026 | 2030 |
|---|---|---|
| Revenue | 2,000,000 | 4,678,700 |
| Gross profit | 1,240,000 | 3,087,942 |
| Operating expenses | 900,000 | 1,777,906 |
| EBITDA | 340,000 | 1,310,036 |
| D&A | 80,000 | 187,148 |
| EBIT | 260,000 | 1,122,888 |
| Income tax | 65,000 | 280,722 |
| Net income | 195,000 | 842,166 |
Below EBITDA the sheet subtracts depreciation and amortization to reach EBIT, applies tax, and lands on net income. Income tax has one wrinkle worth knowing about: it is the tax rate applied to EBIT only when EBIT is positive. A loss year pays nothing, and the sheet says in its own footnote that the loss is not carried forward against a later profit, so the model is not trying to replicate a real tax computation.
Three margin rows close the sheet, and they are where the drivers show their combined effect. Gross margin runs 62, 63, 64, 65, and 66 percent, straight off the driver. EBITDA margin runs 17, 20, 23, 26, and 28 percent, and net margin runs 9.8, 12.0, 14.3, 16.5, and 18.0 percent. EBITDA margin nearly doubles across five years, and neither driver produced that on its own. Gross margin adds four points while opex falls seven, and the eleven-point swing between them is the whole story of the projection. That is a substantial operating assumption, and it sits in two labeled driver rows where a lender can argue with it directly.
The Cash Flow sheet: where profit and cash come apart
Profit is an opinion about timing and cash is a fact, and this sheet is where the difference gets quantified. It runs on one line:
Free cash flow = Net income + D&A - change in working capital - CapExNet income and D&A both come straight from the Income Statement. The two subtractions are computed here.
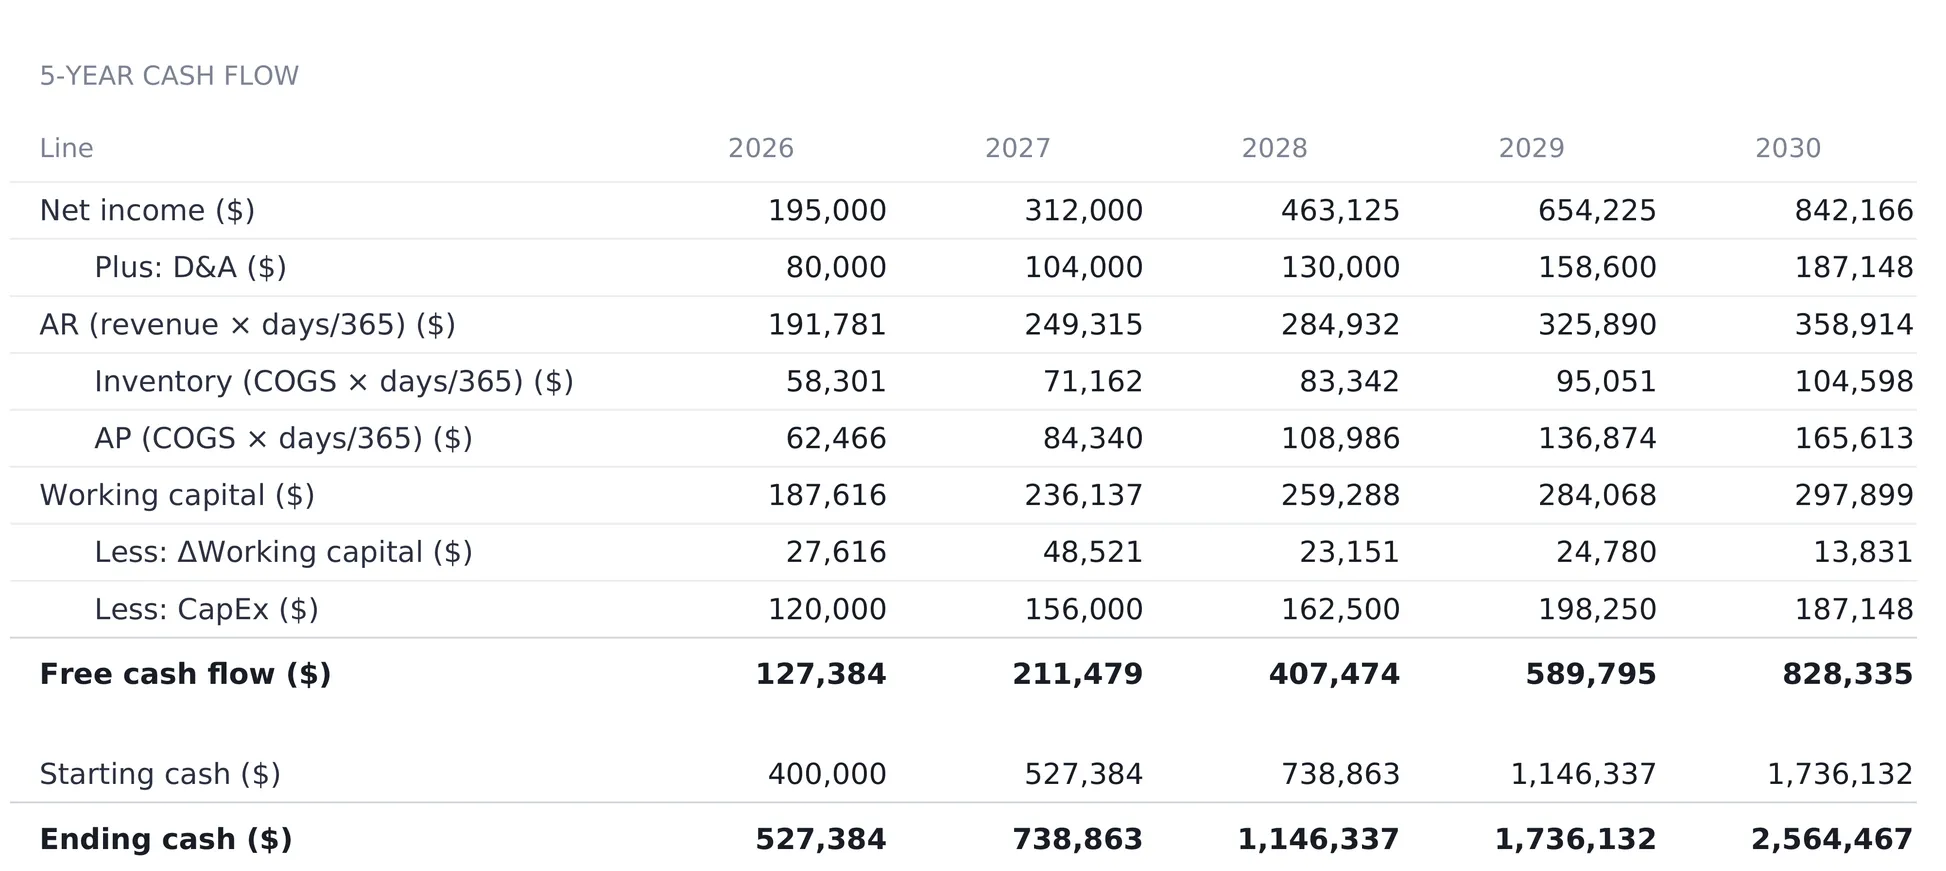
Working capital uses the classic days-on-hand convention. Receivables are revenue times AR days divided by 365, while inventory and payables are COGS times their respective days divided by 365. In 2026 that gives $191,781 of receivables, $58,301 of inventory, and $62,466 of payables, and working capital is the first two minus the last, $187,616. What the cash flow subtracts is not that level but the change in it. Year 1 measures against the opening receivables, inventory, and payables on Settings, so $187,616 minus $160,000 is a $27,616 outflow. Every later year measures against the year before.
CapEx is the CapEx driver applied to revenue: $120,000 in 2026 rising to $198,250 in 2029, then falling to $187,148 in 2030 as the percentage steps down to 4 percent.
Year 1 makes the gap between profit and cash concrete. Net income is $195,000, D&A adds $80,000 back because it never left the bank, working capital takes $27,616, and CapEx takes $120,000, leaving $127,384 of free cash flow. A business that earned $195,000 generated $127,384 in cash, and each of the three reasons is a visible row.
| Line | 2026 | 2027 | 2028 | 2029 | 2030 |
|---|---|---|---|---|---|
| Net income | 195,000 | 312,000 | 463,125 | 654,225 | 842,166 |
| D&A added back | 80,000 | 104,000 | 130,000 | 158,600 | 187,148 |
| Less change in working capital | 27,616 | 48,521 | 23,151 | 24,780 | 13,831 |
| Less CapEx | 120,000 | 156,000 | 162,500 | 198,250 | 187,148 |
| Free cash flow | 127,384 | 211,479 | 407,474 | 589,795 | 828,335 |
| Ending cash | 527,384 | 738,863 | 1,146,337 | 1,736,132 | 2,564,467 |
The last row rolls the position forward. Starting cash of $400,000 becomes $527,384 at the end of 2026, and every year after that opens with what the previous year closed on.
Two details in that run are worth pausing on. The working capital drag shrinks to $13,831 in 2030, the largest revenue year of the five, because all three days assumptions pull the same way by then. Receivables are collected in 28 days instead of 35, stock turns in 24 days instead of 28, and suppliers are paid in 38 days instead of 30. The second detail is the arithmetic at the bottom: the five free cash flow figures add to $2,164,467, exactly the $2,564,467 of closing cash minus the $400,000 the business started with. Nothing leaks.
The Balance Sheet and the row that catches the mistakes
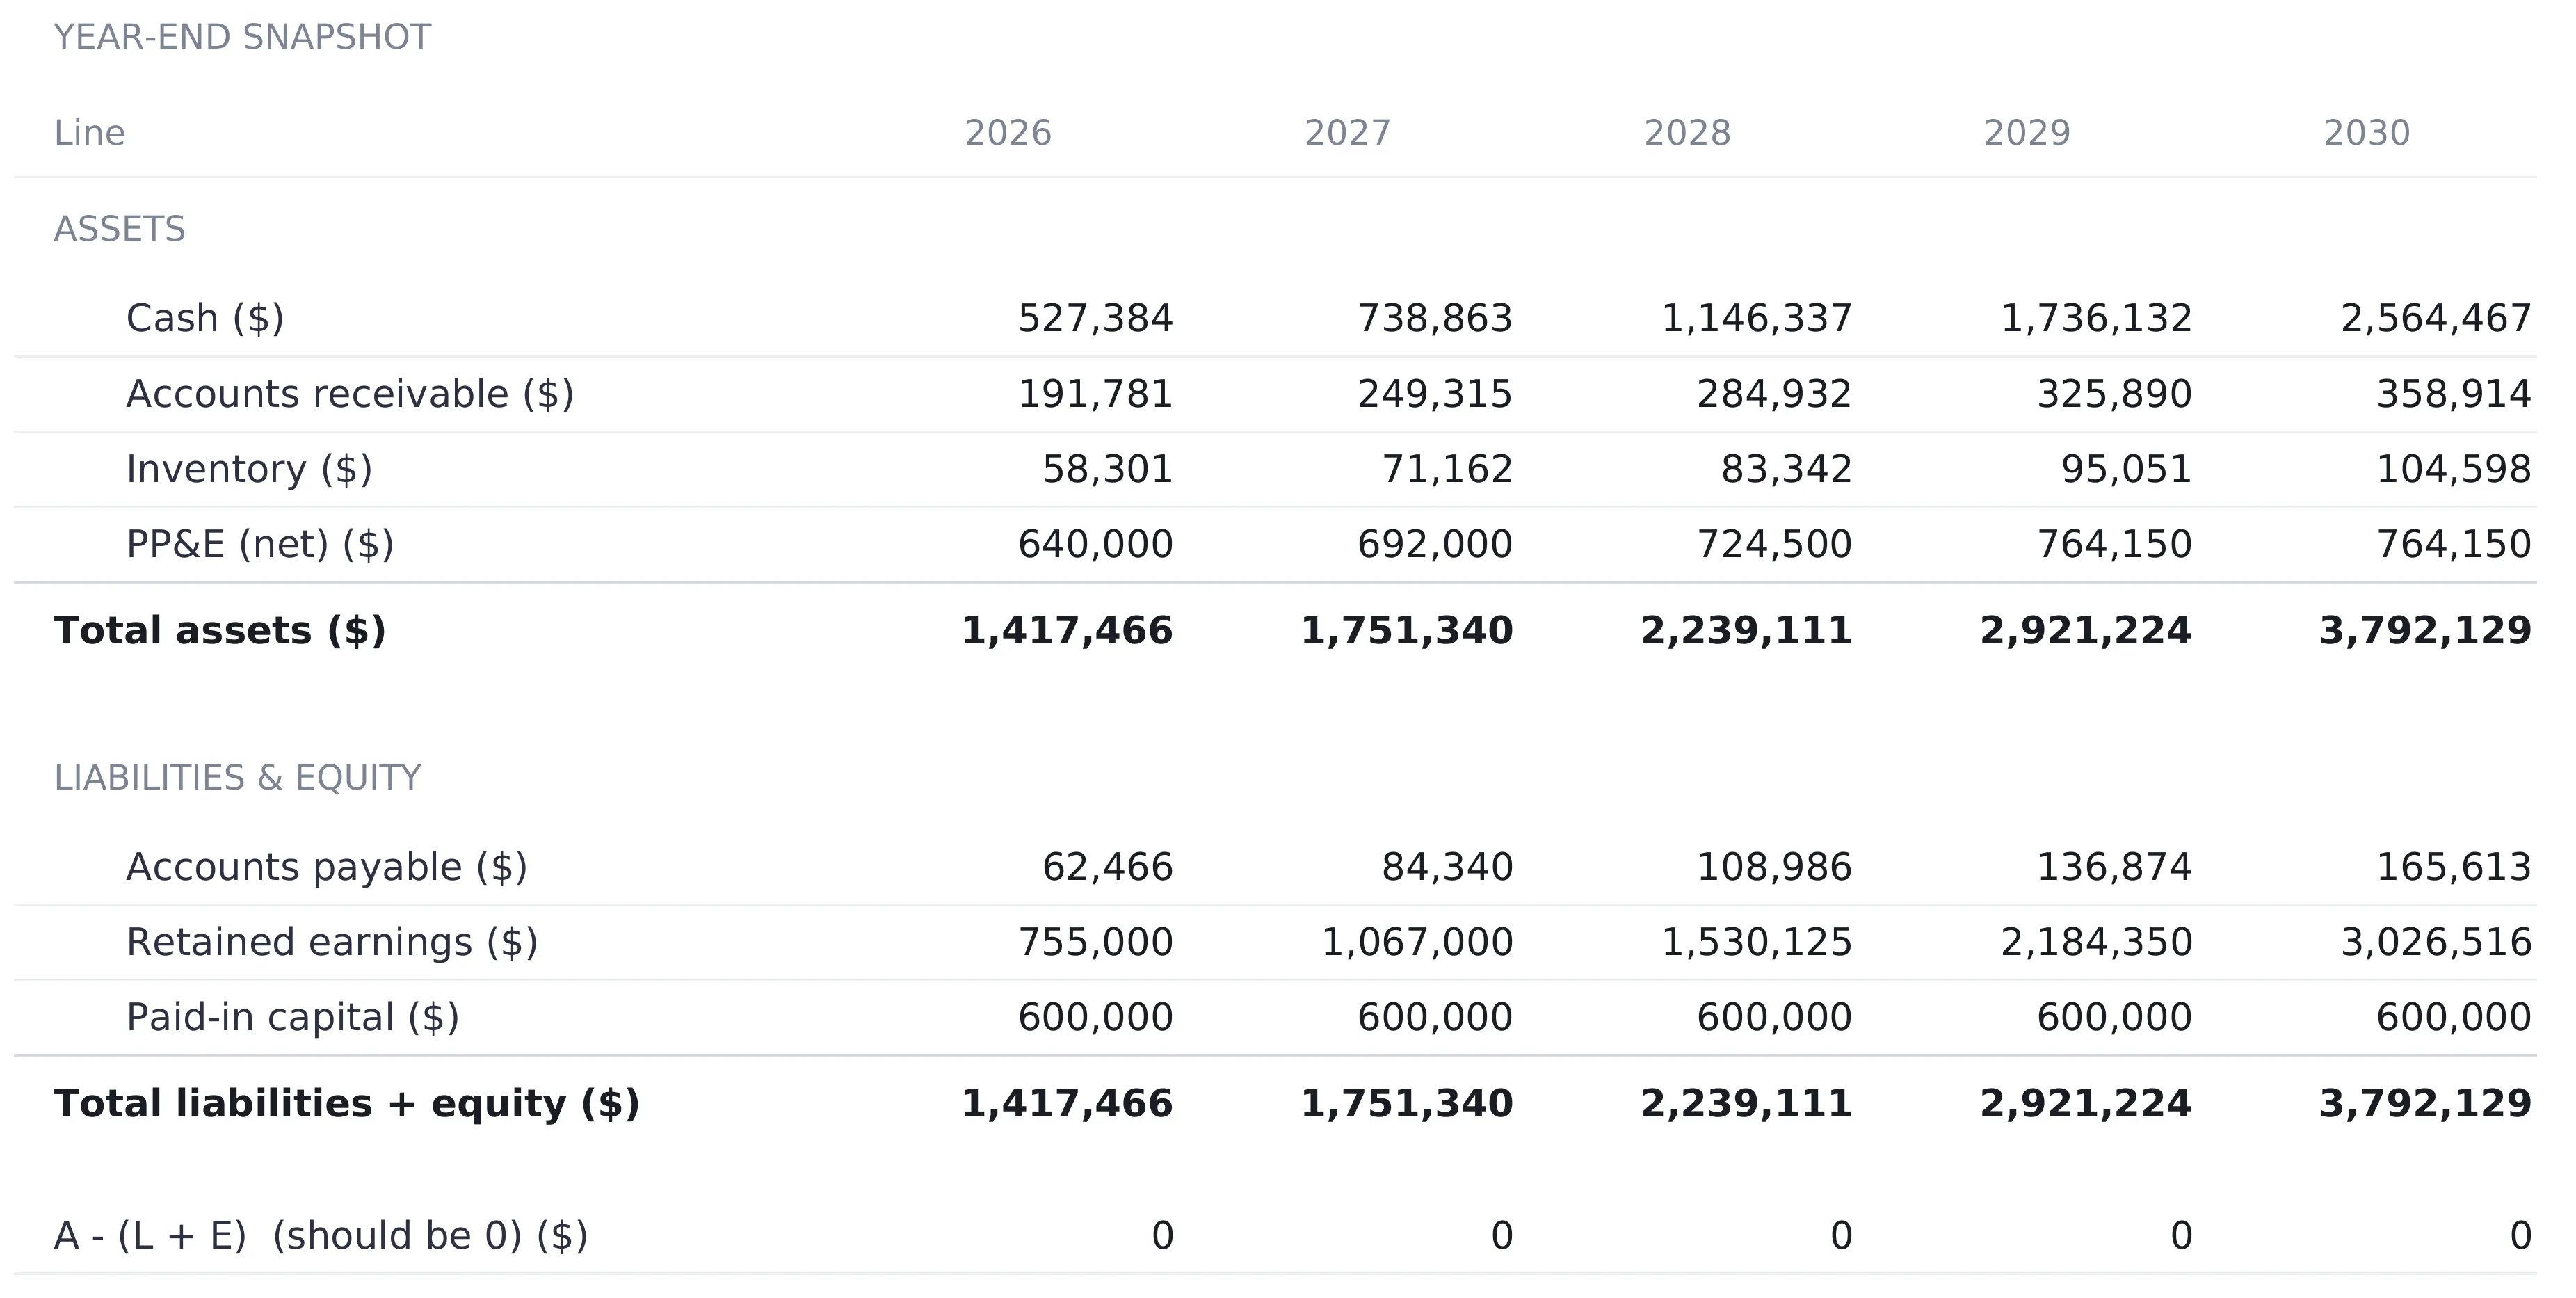
The balance sheet is a year-end snapshot with nothing typed on it at all. Cash, receivables, and inventory are references to the Cash Flow sheet, which is what stops the two statements from ever disagreeing about the same figure.
Net PP&E is the one line the sheet builds itself, rolling forward from the opening $600,000: prior balance plus that year’s CapEx minus that year’s D&A. It reaches $640,000, $692,000, $724,500, $764,150, and $764,150. The last two are identical, and the reason is visible on the Drivers grid. In 2030 the CapEx percentage falls to 4.0, matching the D&A percentage, so investment and depreciation cancel and the asset base stops growing. That is a consequence of two assumptions typed four rows apart, and this is the only place it becomes obvious.
On the other side, accounts payable references the Cash Flow sheet, paid-in capital holds flat at $600,000, and retained earnings accumulate net income on top of the opening $560,000, reaching $3,026,516 by 2030. Total assets and total liabilities plus equity both read $1,417,466 in 2026 and $3,792,129 in 2030.
The last row is the useful one. It subtracts liabilities and equity from assets, rounds to two decimals, and should read 0 in every column, which it does across all five years of the sample. A model where that row is non-zero has an arithmetic problem somewhere, and the sheet’s own note narrows the search: the same gap in every year points at the opening balance on Settings rather than at a driver.
The dashboard: seven tiles and a verdict on the model itself
With Settings and Drivers filled, the Dashboard states the projection in one screen.
| Tile | Sample value | What it reads |
|---|---|---|
| Y5 revenue | 4,678,700 | 2030 top line |
| Y5 EBITDA | 1,310,036 | 2030 EBITDA |
| Y5 net income | 842,166 | Bottom line |
| Cumulative FCF | 2,164,467 | Five years of free cash flow added up |
| Avg EBITDA margin | 22.8% | The five annual EBITDA margins averaged |
| Y5 cash | 2,564,467 | End-of-period cash |
| Balance check | 0 | Sum of the five absolute A minus (L + E) gaps |
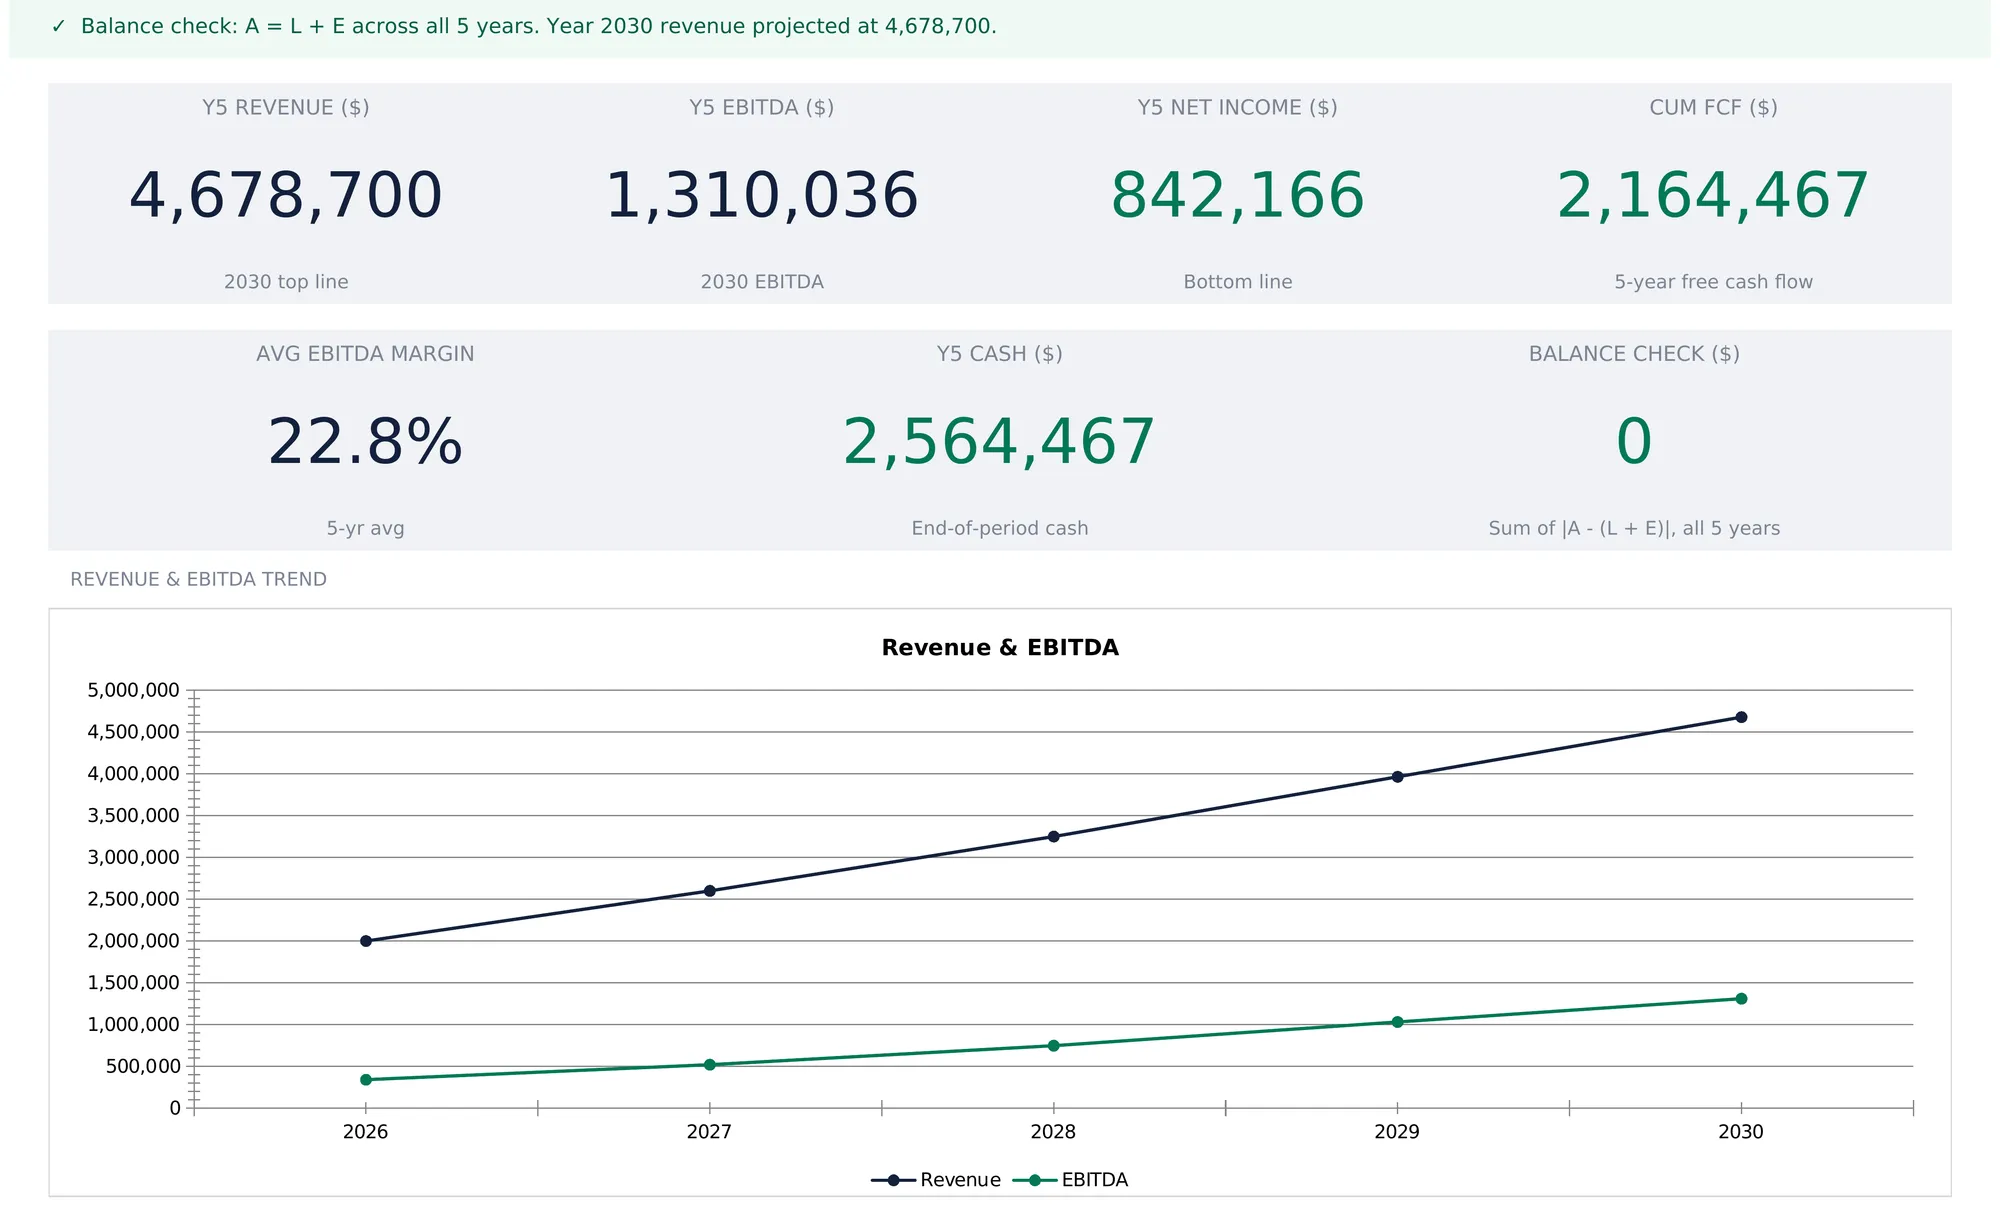
Six of those tiles describe the business. The seventh describes the spreadsheet, and it is the one that makes the other six trustworthy. A status line across the top of the sheet says the same thing in a sentence. In the sample it reads “Balance check: A = L + E across all 5 years. Year 2030 revenue projected at 4,678,700” on a green background with a checkmark. When the five gaps add to half a currency unit or more, the banner turns to a warning that names the cumulative amount. A model whose statements have stopped tying out says so the moment the file opens, rather than at the meeting.
Below the tiles the workbook plots two charts. A line chart titled Revenue & EBITDA puts both series on the same axes across the five years, and a bar chart below it plots free cash flow by year.
What this five-year projection model leaves out
Every projection model is a simplification, and knowing which simplifications this one makes is part of using it honestly.
There is no debt. Accounts payable is the only liability, equity is a single line, and no interest expense sits between EBIT and tax. The How to Use sheet states this directly and points at the extension: add a Debt row. Anyone modeling a business plan built around a bank loan is modeling the loan outside this file or adding rows to it.
There is no revenue build. Revenue is one typed number and four growth percentages, not units multiplied by price, not customers multiplied by average order value, not a pipeline. That keeps the model small and readable, and it means the growth rates carry all the weight of the sales story rather than being an output of it.
Cash only accumulates. There are no dividends, no distributions, no share buybacks, and no debt repayment, so the $2,164,467 of free cash flow generated over the period sits in the cash line at year five. Any of those uses would lower that figure, so year-five cash reads as an upper bound rather than a forecast of the bank balance.
The grain is annual. The SBA guidance quoted at the top suggests being “even more specific” for the first year, with quarterly or monthly projections, and this workbook does not do that. It is a five-year view by design, and the first-year detail is a job for a separate monthly file.
And one copy holds one case. There is no base, upside, and downside side by side, so comparing scenarios means keeping separate copies of the file and reading their dashboards next to each other.
Excel or Google Sheets for five-year projections
The template is an .xlsx file built on plain formulas, with no macros and no add-ons, so it behaves identically in Microsoft Excel and in Google Sheets after upload. That matters more for projections than for most spreadsheet templates, because the file usually has an audience. Google Sheets suits sharing a model by link with a co-founder, an accountant, or a lender who wants to open the driver grid and see what the numbers were built on. Excel suits keeping a versioned file locally and attaching it to a plan.
The structure described above is buildable by hand in either. Laid out from scratch it goes in five moves:
- Opening balances first. The seven starting figures on their own tab, with the check row underneath them, so an unbalanced start shows up before anything is built on top of it.
- Year 1 revenue and the driver grid. One typed revenue cell, then nine driver rows across five year columns.
- The income statement. Every line a formula reading revenue and a driver, down to net income.
- The cash flow. Net income plus D&A, minus the change in working capital and minus CapEx, with cash rolled forward from one year into the next.
- The balance sheet last. References to the other two sheets rather than repeats of them, closing with the A minus (L + E) row.
The template mostly saves the wiring and the debugging.
Which spreadsheet template fits which job
- 5-Year Financial Projections Spreadsheet Template ($49) is the workbook this walkthrough follows: an opening balance sheet, a per-year driver grid, and three linked statements with a balance check, for the five-year outlook a plan or a funding conversation asks for.
- Business Valuation Spreadsheet Template ($49) is the natural next file, because it runs four classic methods at once, including an EV/EBITDA multiple, and EBITDA is exactly what the projection above produces.
- Startup Financial Model Spreadsheet Template ($59) covers the earlier-stage version of the same question at a shorter horizon, with funding rounds, a hiring plan, 24-month burn and runway, and a simplified cap table.
- For a single statement rather than three, the free Profit & Loss Projection template covers a projected-against-actual P&L for one period, with Essentials ($19) and Ultimate ($29) versions in the same family.
Related
- How to Forecast Cash Flow for a Small Business - the 12-month operating version of the cash question, month by month rather than year by year
- Cash Flow Forecast Templates for Small Business - what a shorter-horizon forecast covers, and where dedicated apps take over
- Google Sheets vs Excel for Business Cash Flow - choosing a platform when a finance file has more than one reader
Frequently asked questions
What makes a projection a three-statement model?
The three statements read from each other rather than being typed separately. Net income computed on the Income Statement is the first line of the Cash Flow sheet and is added to retained earnings on the Balance Sheet. Ending cash computed on the Cash Flow sheet is the cash line on the Balance Sheet. Receivables, inventory, and payables are calculated once on the Cash Flow sheet and referenced by the Balance Sheet, so they cannot drift. The proof that the wiring holds is the A minus (L + E) row, which reads 0 in all five years of the sample file.
Why does Year 1 have no revenue growth assumption?
Year 1 revenue is a hard input on the Settings sheet, $2,000,000 in the sample, so there is nothing for a Year 1 growth rate to grow. The Drivers grid shows n/a in that cell and applies growth only from Year 2 onward: 30 percent, 25 percent, 22 percent, and 18 percent in the sample. Every other driver row, including the opex percentage and the tax rate, does have a Year 1 value.
My balance sheet is out by the same amount in every year. What causes that?
The workbook's own note points at the opening figures rather than at a driver. The seven starting positions on Settings have to satisfy one identity: cash plus receivables plus inventory minus payables plus net PP&E equals paid-in capital plus retained earnings. The Opening balance check row on Settings reads 0 when they do. In the sample, $400,000 plus $165,000 plus $52,000 minus $57,000 plus $600,000 is $1,160,000, and $600,000 of paid-in capital plus $560,000 of retained earnings is the same figure. A gap there carries into all five years unchanged.
Does the model handle a bank loan or any other debt?
No. The Balance Sheet is a simplified one with accounts payable as the only liability and a single equity line, so there is no debt balance, no principal repayment, and no interest expense. EBIT flows straight to income tax with nothing deducted in between. The How to Use sheet is explicit about this and suggests extending the model with a Debt row for anyone who needs one.
What happens in a year that loses money?
Income tax is calculated as the tax rate applied to EBIT only when EBIT is positive, so a loss year pays nothing. The workbook also states the limitation plainly on the Income Statement sheet: the loss is not carried forward against a later profit, so the following profitable year is taxed in full. Negative net income still flows through to the cash flow and reduces retained earnings on the balance sheet.
Sources
- Write your business plan - U.S. Small Business Administration
About this article
Every figure, sheet name, formula, and feature description verified against the published 5-Year Financial Projections Pro workbook (the exact file customers download). The SBA business plan guidance quoted above was checked against the live SBA page at writing time. Last reviewed August 2026.