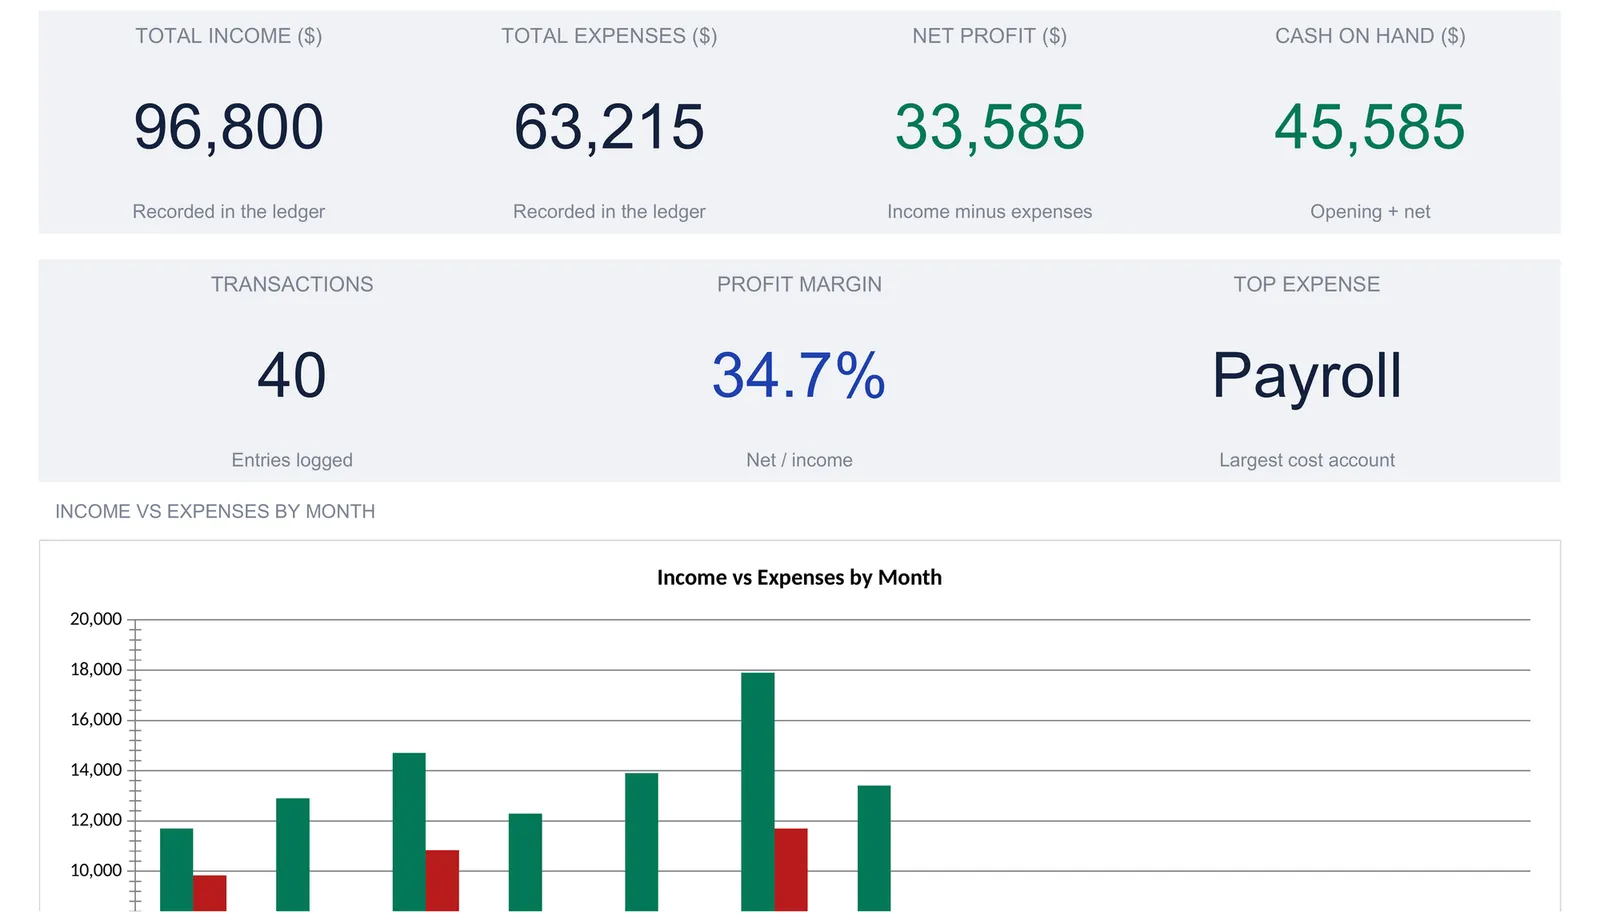
A bookkeeping spreadsheet keeps every income and expense entry in a single ledger and derives everything else from it: category totals through a chart of accounts, a month-by-month cash view, a profit and loss summary, and a dashboard. This walkthrough follows a real bookkeeping template with a worked example, a services business with 40 entries, 96,800 in income, 63,215 in expenses, and 33,585 net profit. Our Business Bookkeeping Spreadsheet Template ($29) ships the same structure ready-made for Excel and Google Sheets.
Bookkeeping is one of those jobs that stays small right up until it doesn’t. For the first few months a business owner can hold the whole picture in their head: a couple of client payments came in, rent and payroll went out, and the bank balance looks roughly right. Then the year fills in. Forty or fifty entries later, the questions that matter get harder to answer from memory. Which month made money? What is the single biggest cost? How much of every dollar of revenue survives to the bottom line? Those are not memory questions. They are structure questions, and a spreadsheet answers them well.
The structure underneath good bookkeeping is smaller than it looks. It is one ledger where every transaction is recorded once, a chart of accounts that names the categories money is sorted into, and a handful of reports that read the ledger and total it different ways. The examples below come from our Business Bookkeeping Spreadsheet Template ($29), which ships that whole structure ready-made for Excel and Google Sheets. The layout is reproducible by hand if you would rather build your own.
What a bookkeeping spreadsheet has to hold
Strip away the accounting jargon and there are only three kinds of data, plus the reports that fall out of them:
- Transactions. Every payment in and every payment out, one row each, with a date, a description, a category, a type of Income or Expense, and an amount. This is the raw material for everything else.
- A chart of accounts. The named list of categories the business sorts money into, split into income accounts and expense accounts. It is what turns a pile of rows into a report you can read.
- A little setup. The business name, the currency, the fiscal year, and the opening cash balance the year starts from.
- Derived reports. Category totals, a month-by-month view, a profit and loss summary, and a dashboard. These are calculations, not entries. In a well-built sheet, nothing here is ever typed.
The template gives each of these its own sheet: Settings for the setup, Categories for the chart of accounts, Transactions for the ledger, then Monthly, P&L Summary, and a Dashboard on top that read the ledger and report it. The sections below follow the order a user actually works in, starting with setup and ending at the dashboard.
Start with the setup: the Settings sheet
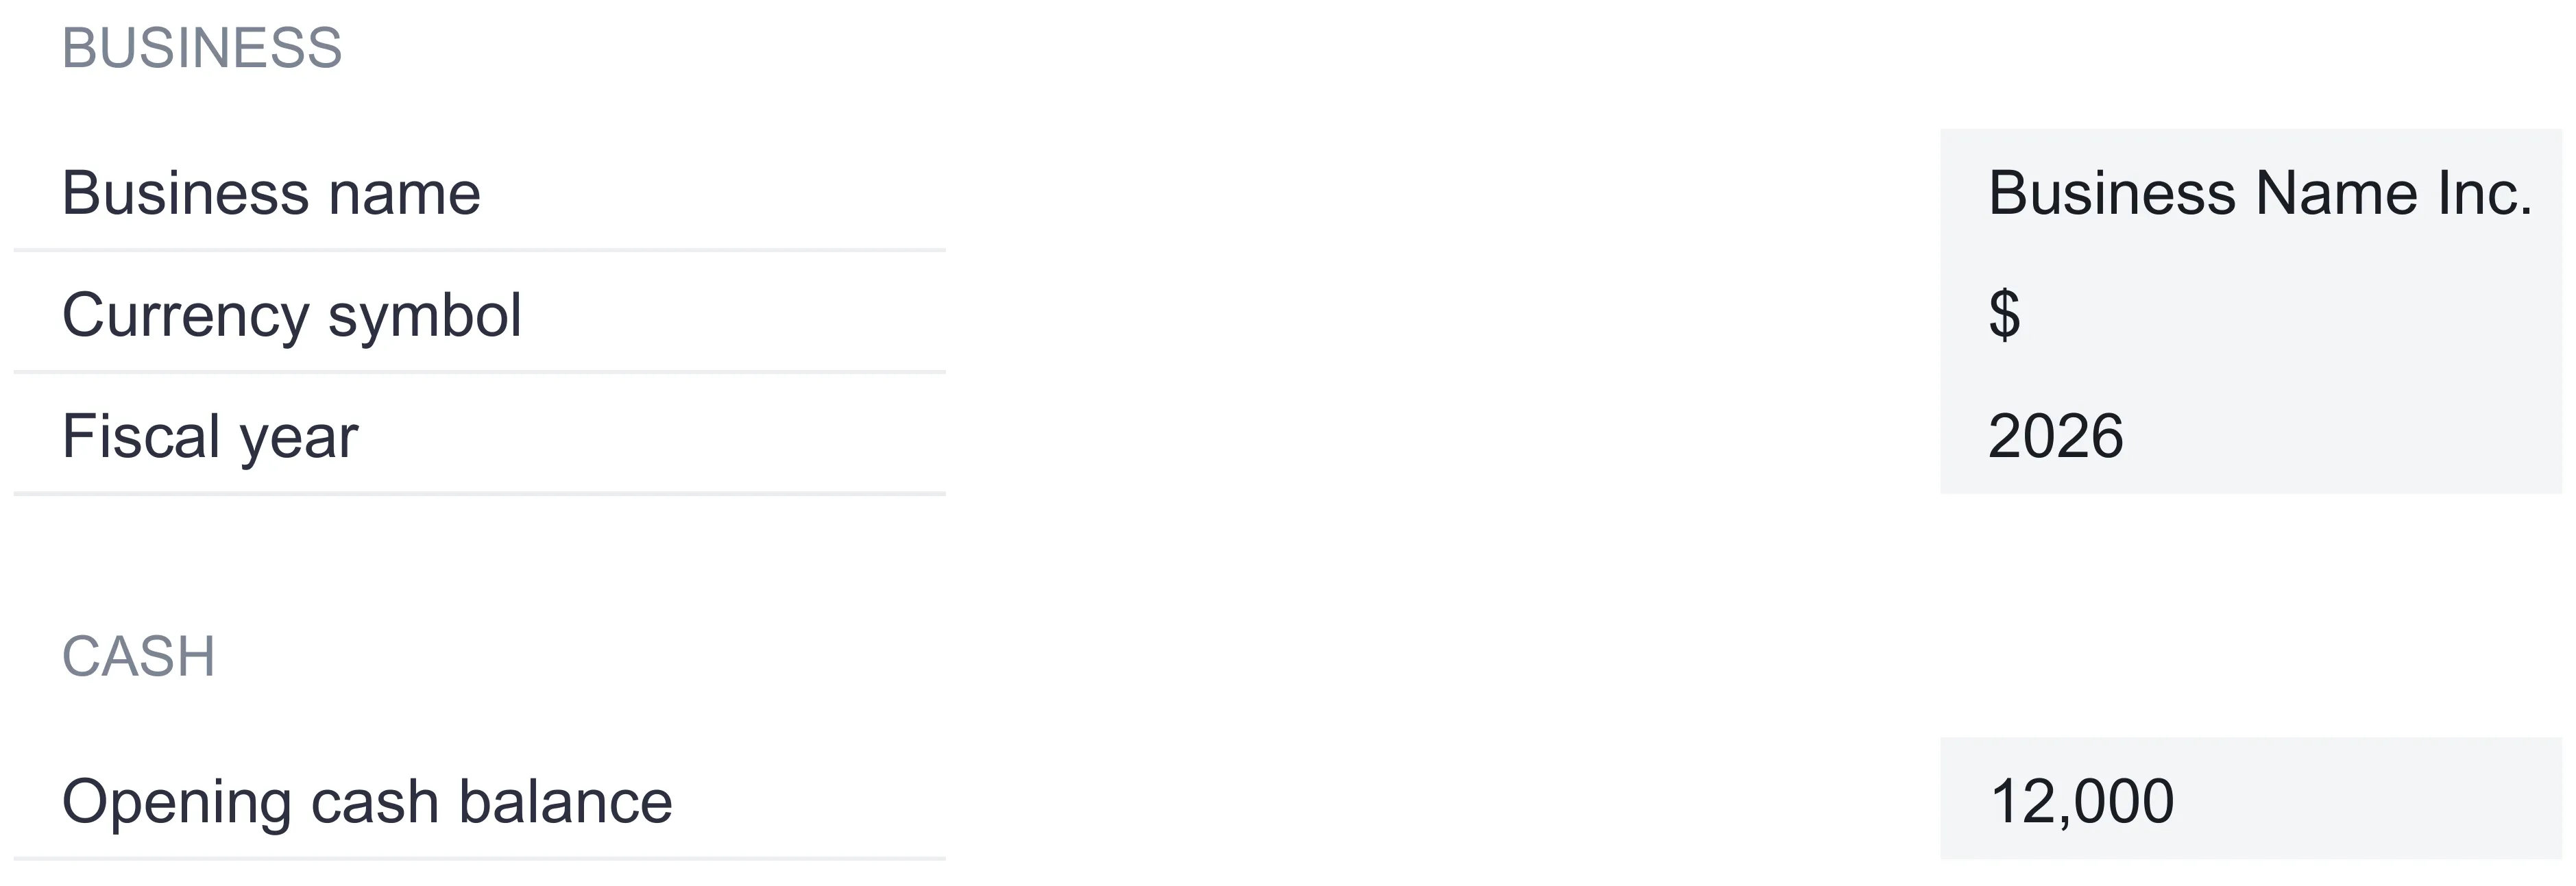
Four things live on the Settings sheet, and they come first because the rest of the workbook reads them.
Business name. Typed once, it appears in the header of every report sheet, so the reports carry the company’s name without retyping.
Currency symbol. A picker offering 35 symbols, from the dollar and euro through to the rupee, real, and yen. Choosing one relabels every money column across the workbook. It relabels only, with no conversion of the numbers underneath.
Fiscal year. The year the reporting sheets describe. It shows in the header strip alongside the currency so anyone opening the file knows which year they are looking at.
Opening cash balance. The cash the business is starting the year with, 12,000 in the sample. This is the figure the running cash line and the cash on hand tile build on, so it is worth getting right before any transactions go in.
The sheet also spells out the one rule that makes the whole design hold together: every report, meaning Categories, P&L Summary, and Monthly, is derived from the Transactions ledger. Add or rename an account on the Categories sheet, then use it on Transactions, and the reports follow. Nothing downstream is typed twice.
Name the buckets: the chart of accounts
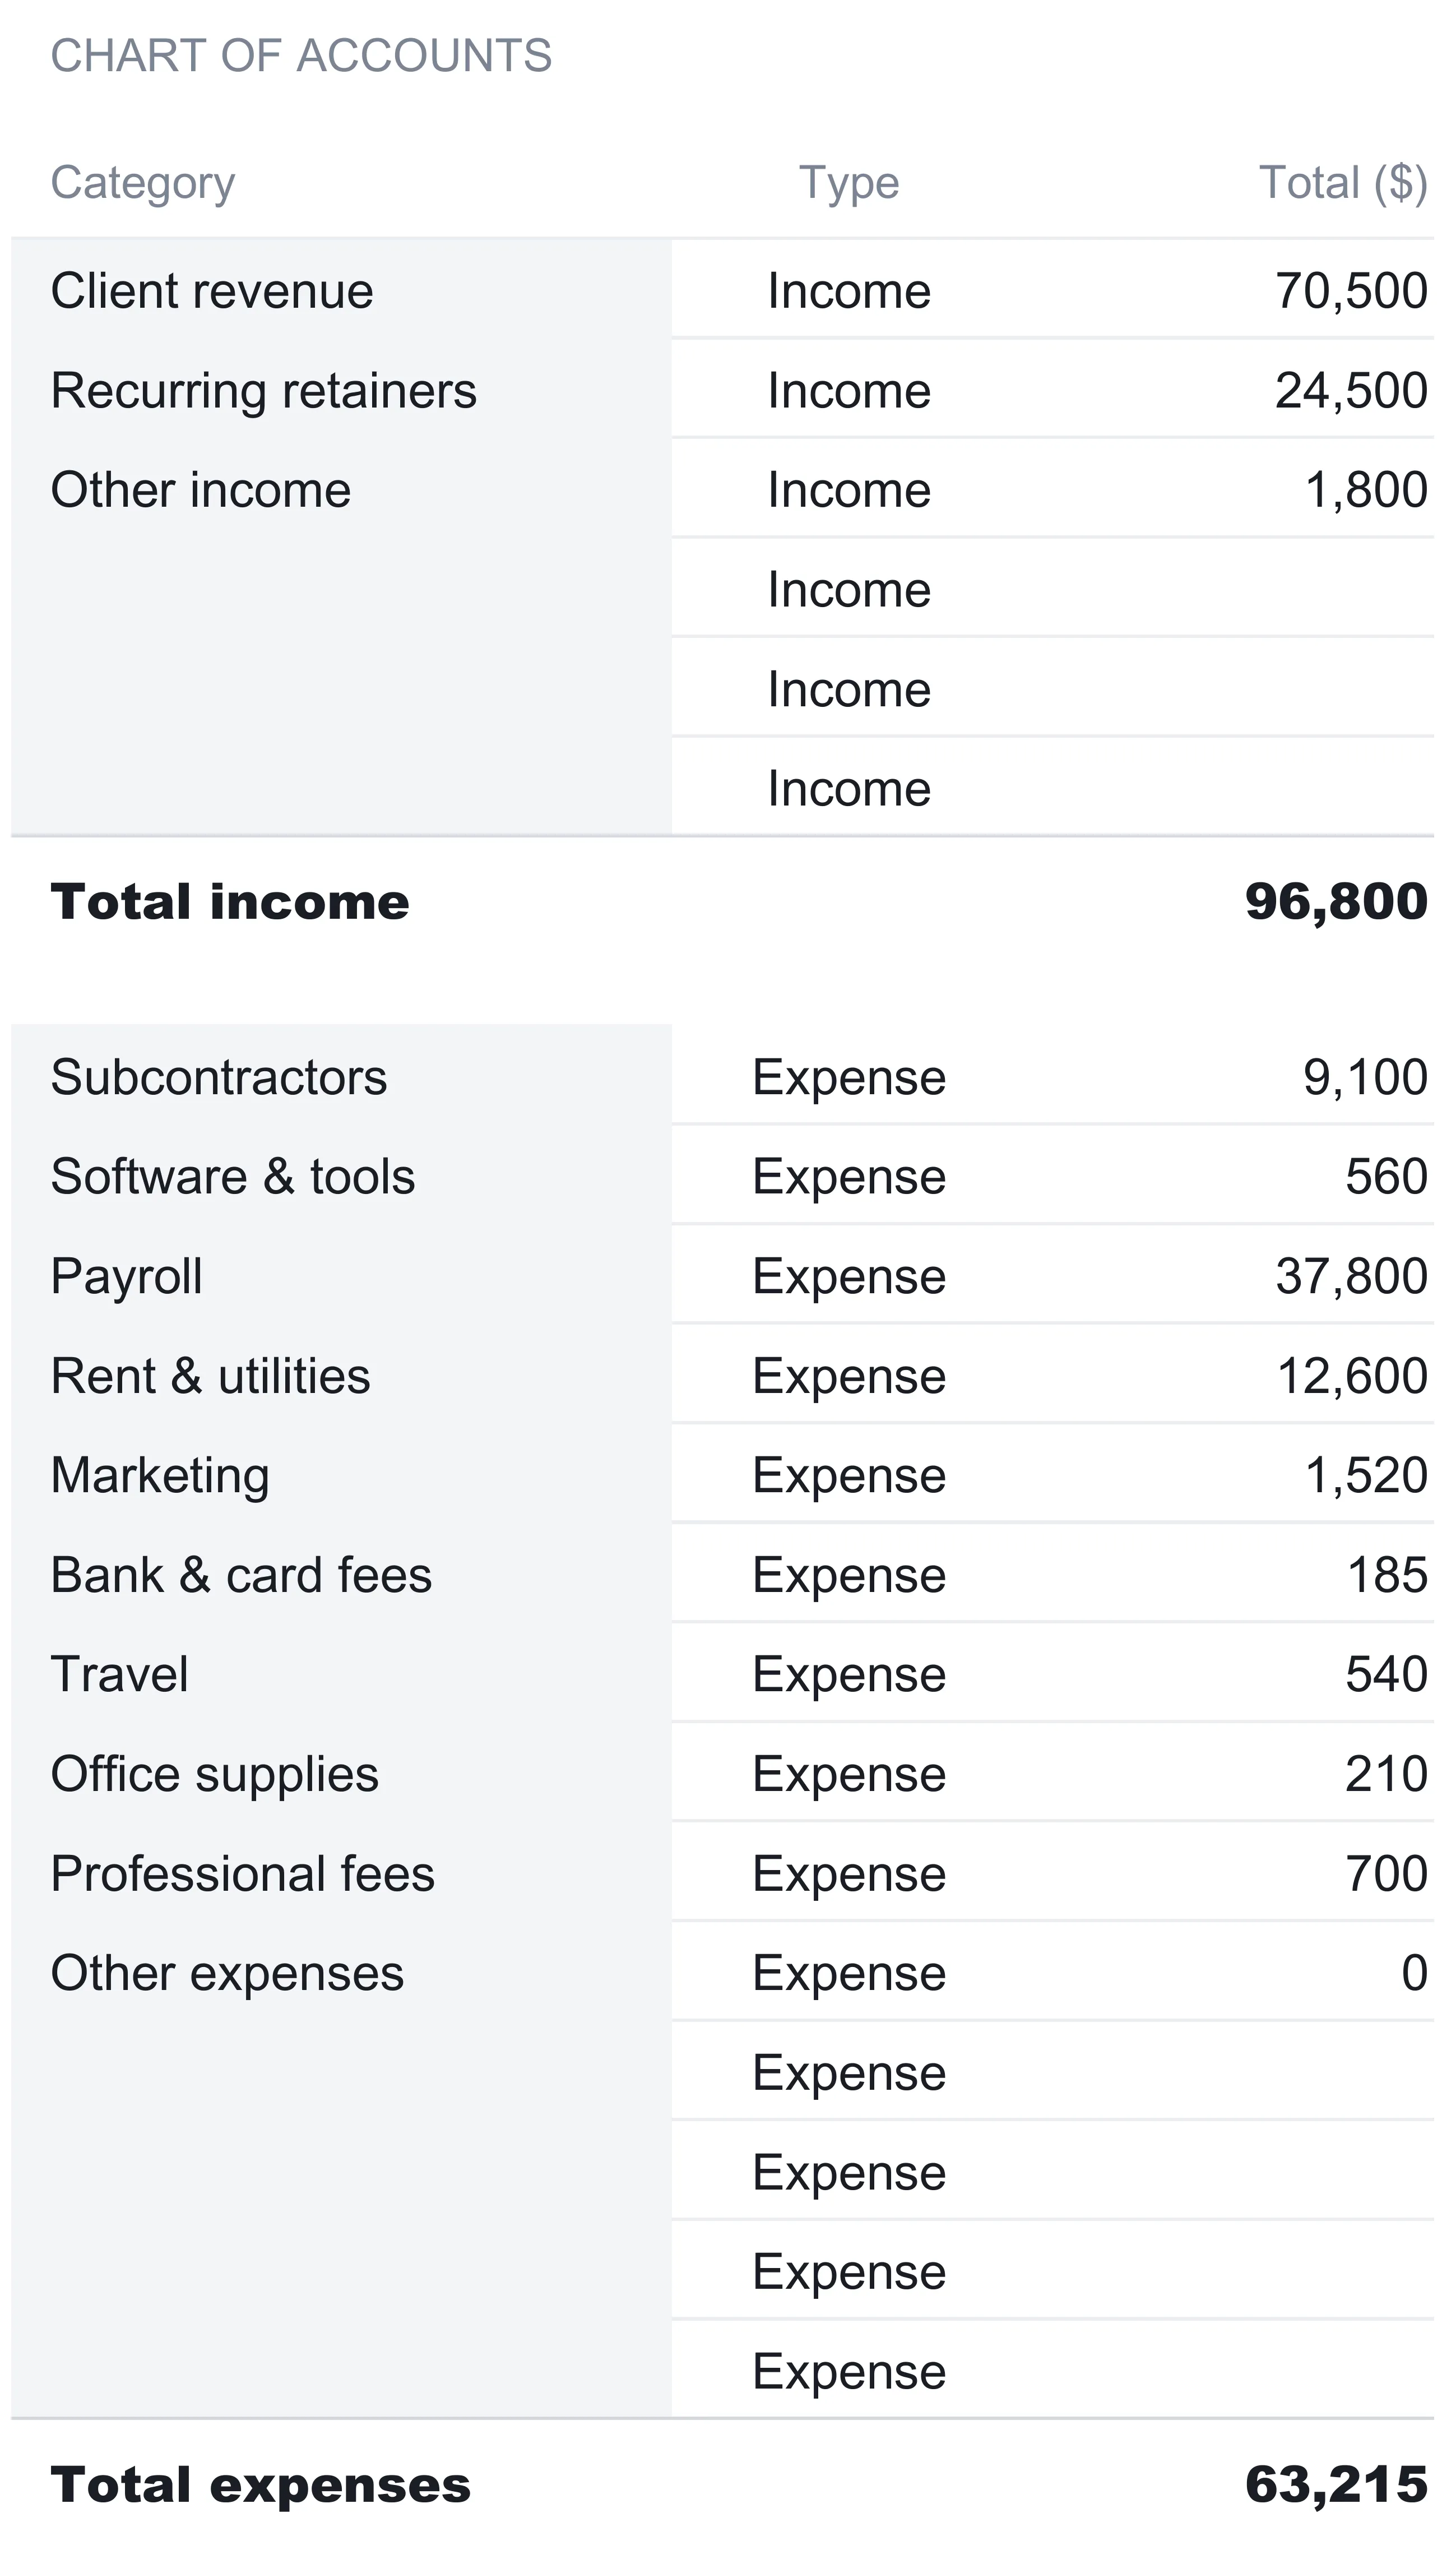
The Categories sheet is the chart of accounts, and it is the piece that separates real bookkeeping from a plain list of payments. It holds two sections. The income accounts in the sample are Client revenue, Recurring retainers, and Other income. The expense accounts are Subcontractors, Software & tools, Payroll, Rent & utilities, Marketing, Bank & card fees, Travel, Office supplies, Professional fees, and Other expenses.
Each account carries a total, and that total is not typed. It sums every ledger row tagged with that account name, so the moment a transaction is filed under Payroll, the Payroll line climbs. In the sample year the income accounts total 96,800 and the expense accounts total 63,215.
Two habits from this sheet are worth copying into any hand-built version. First, the totals read the ledger rather than being maintained separately, which is what stops a category from drifting out of step with the transactions behind it. Second, each section has blank spare rows beneath the named accounts, already wired with the same total formula. Naming a spare row adds that account everywhere at once, in the ledger’s dropdown and on the P&L, so growing the chart of accounts never means dragging a formula down or extending a range.
Log each transaction once: the ledger
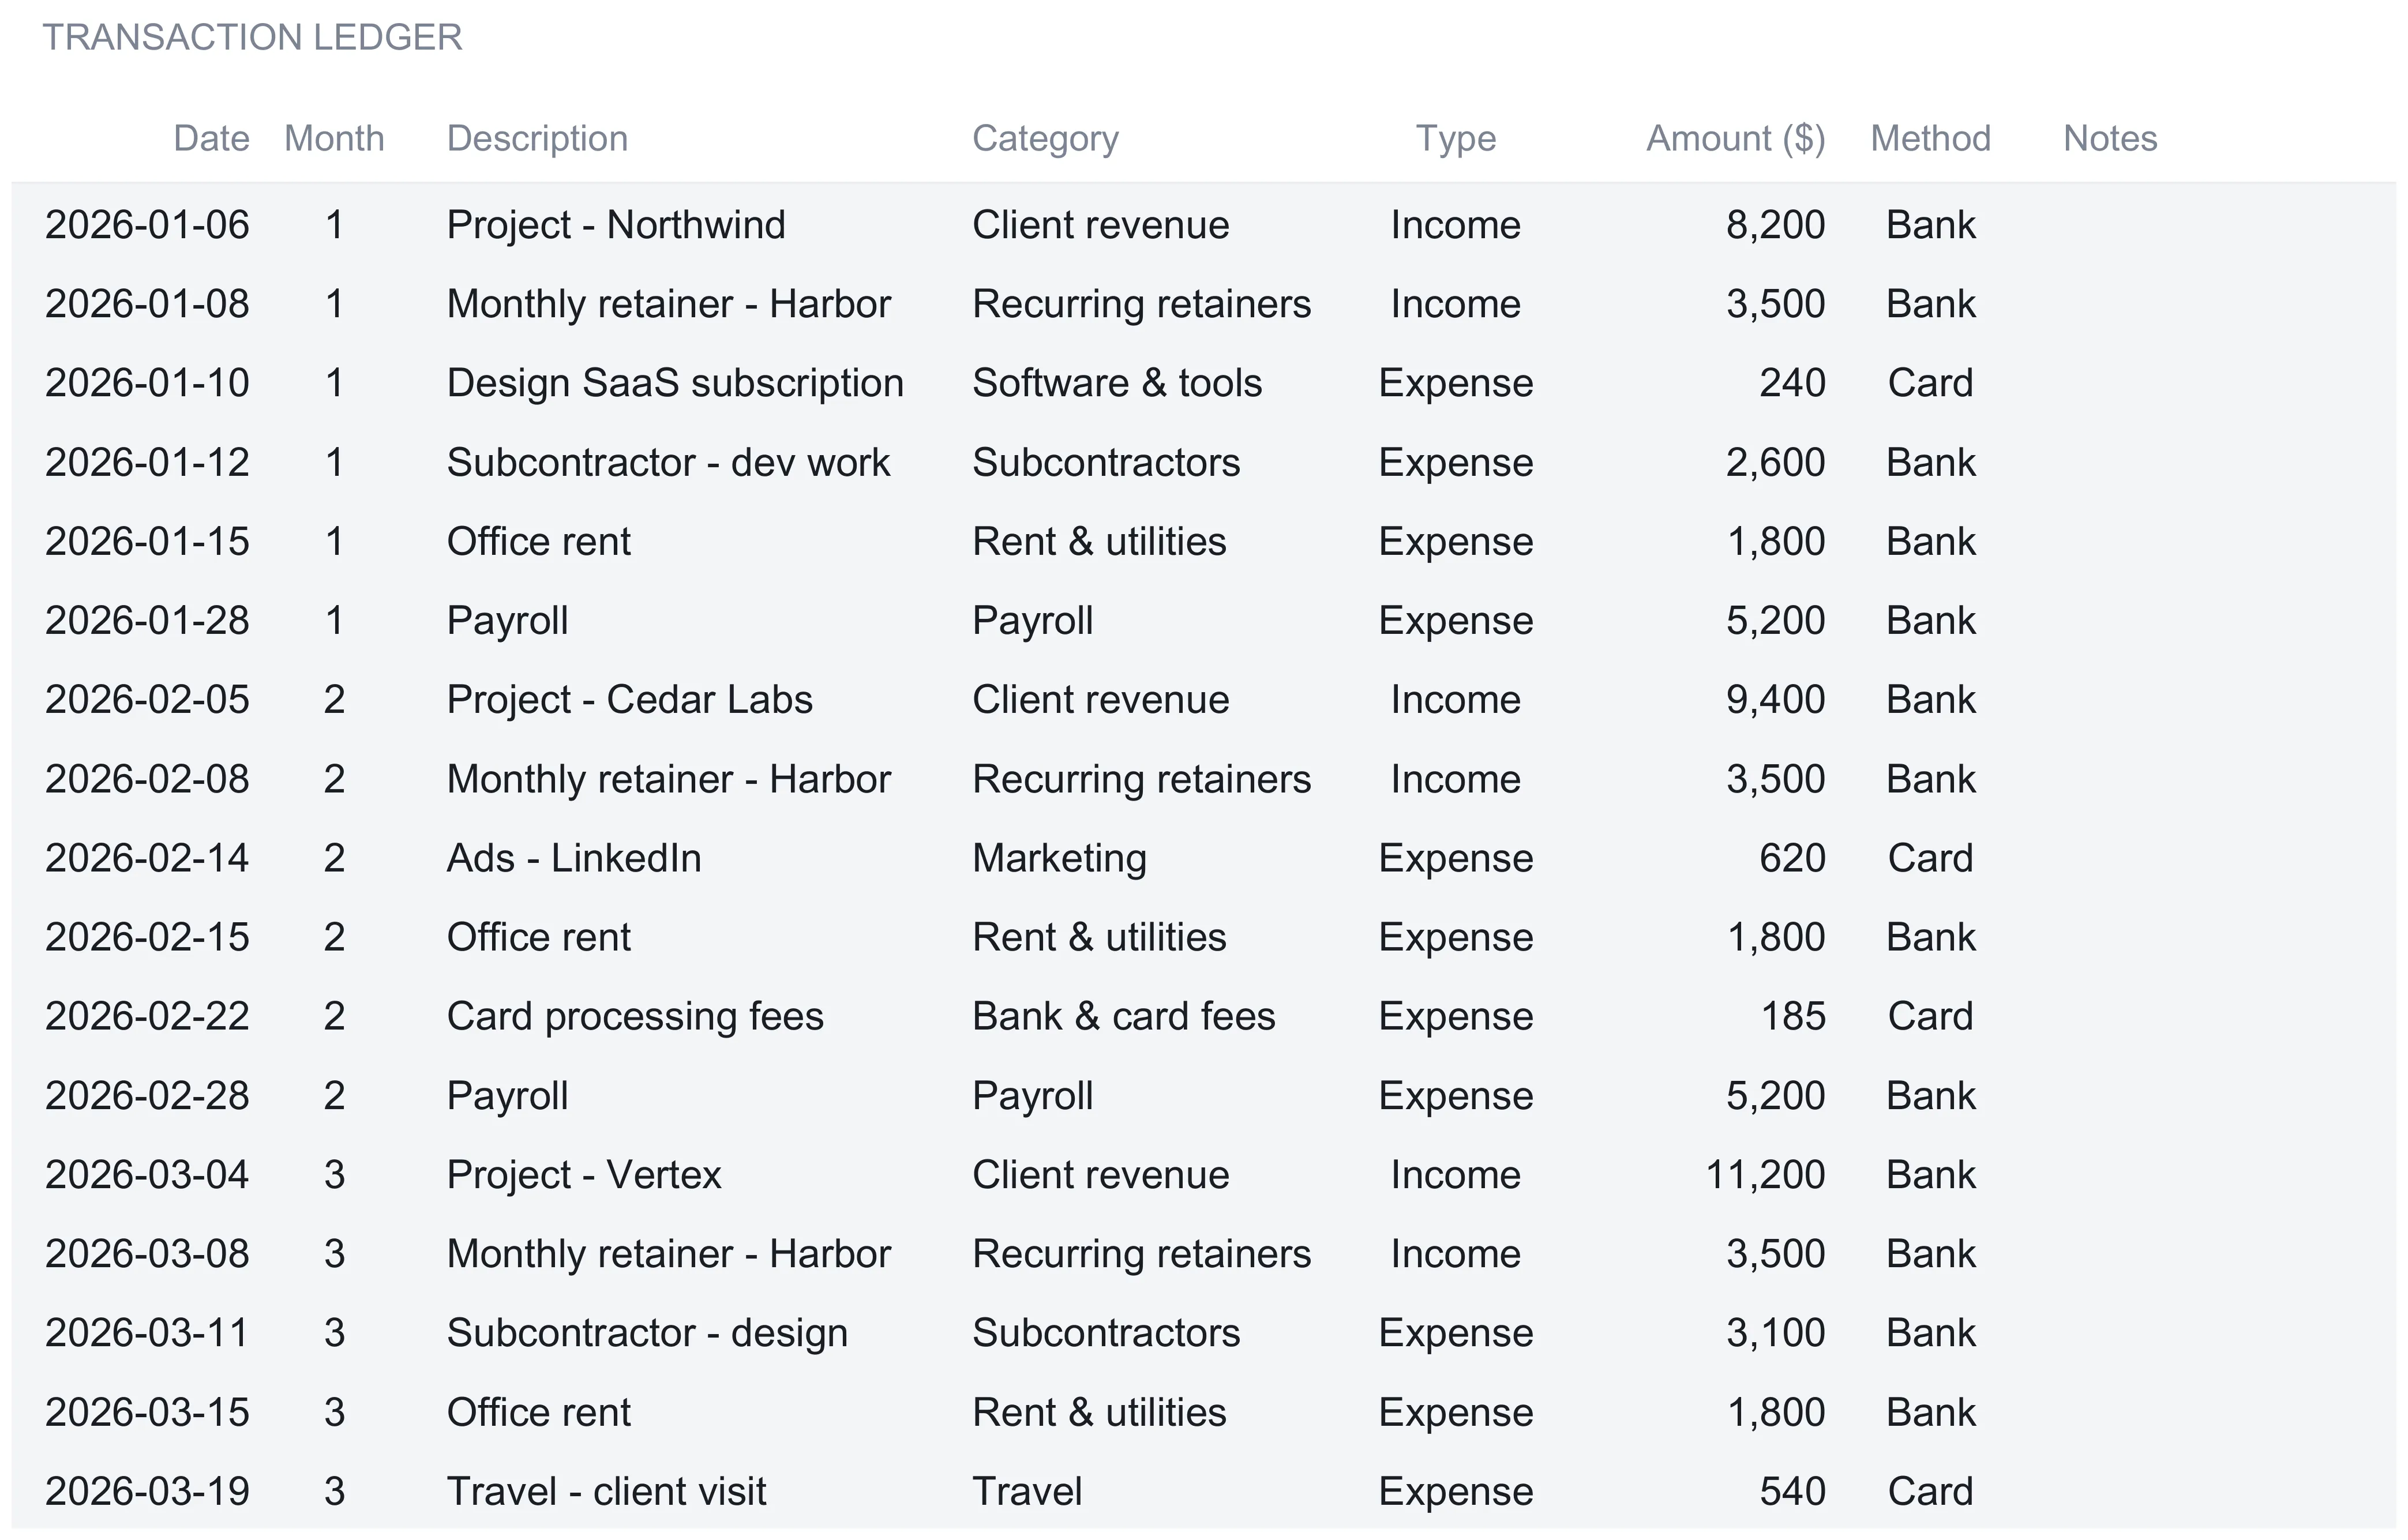
The Transactions sheet is the ledger, and it is the only place a transaction is ever typed. Every other number in the workbook traces back to a row here. Each row has eight columns:
- Date and Month. The date is the full calendar date; the Month column is a plain number from 1 to 12. That number is what the monthly report groups on, so entering it correctly is what lets a transaction land in the right month.
- Description. A free-text note such as “Project - Northwind” or “Office rent” for your own reference.
- Category and Type. Both come from dropdowns. Category offers the account names from the chart of accounts, and Type is Income or Expense. Picking from the lists rather than typing keeps the spelling exact, which matters because the reports match on those names. A payment filed under a misspelled category simply drops out of its account total with no error showing, the kind of silent gap that makes hand-rolled ledgers hard to trust over a full year, and dropdowns close it.
- Amount. The value of the transaction, always entered as a positive number. The Type column, not a minus sign, is what tells the workbook whether the amount adds to income or to expenses.
- Method and Notes. Method records how the money moved, Bank or Card in the sample, and Notes is a spare column for anything else.
One stretch of the sample year makes the flow concrete. January opens with a payment of 8,200 from Project - Northwind, filed under Client revenue as Income, followed by a 3,500 Harbor retainer under Recurring retainers. Then the costs: a 240 software subscription, a 2,600 subcontractor, 1,800 of office rent, and 5,200 of payroll. Those six rows are all that January is: 11,700 in and 9,840 out. Across the whole sample the ledger holds 40 entries, 15 income and 25 expense, and its totals read 96,800 in income against 63,215 in expenses.
Two design details carry over to any version you build yourself. The ledger runs 200 rows deep, and every one of the blank rows already carries the category matching and already sits inside every report total. The next transaction goes on the first free row and the whole workbook updates. And because every report reads this one ledger, they cannot disagree with each other. Spreadsheets that go wrong tend to go wrong precisely here, when a payment gets typed into a summary but not the ledger, or into two summaries with a different figure. Keeping one ledger as the single source removes that failure entirely.
What the ledger does not do is fill itself. There is no bank connection and no import, so each transaction is a handful of typed cells. At 40 entries a year that is a few minutes a month. A business running hundreds of transactions across several accounts is where connected accounting software earns its keep, by pulling the feed in automatically. The trade is the familiar one: automation against transparency. A connected app suits an owner who wants the data to arrive on its own; a spreadsheet suits one who wants to see every formula, change any of them, and keep the file on their own machine.
Read the year by month: the Monthly sheet
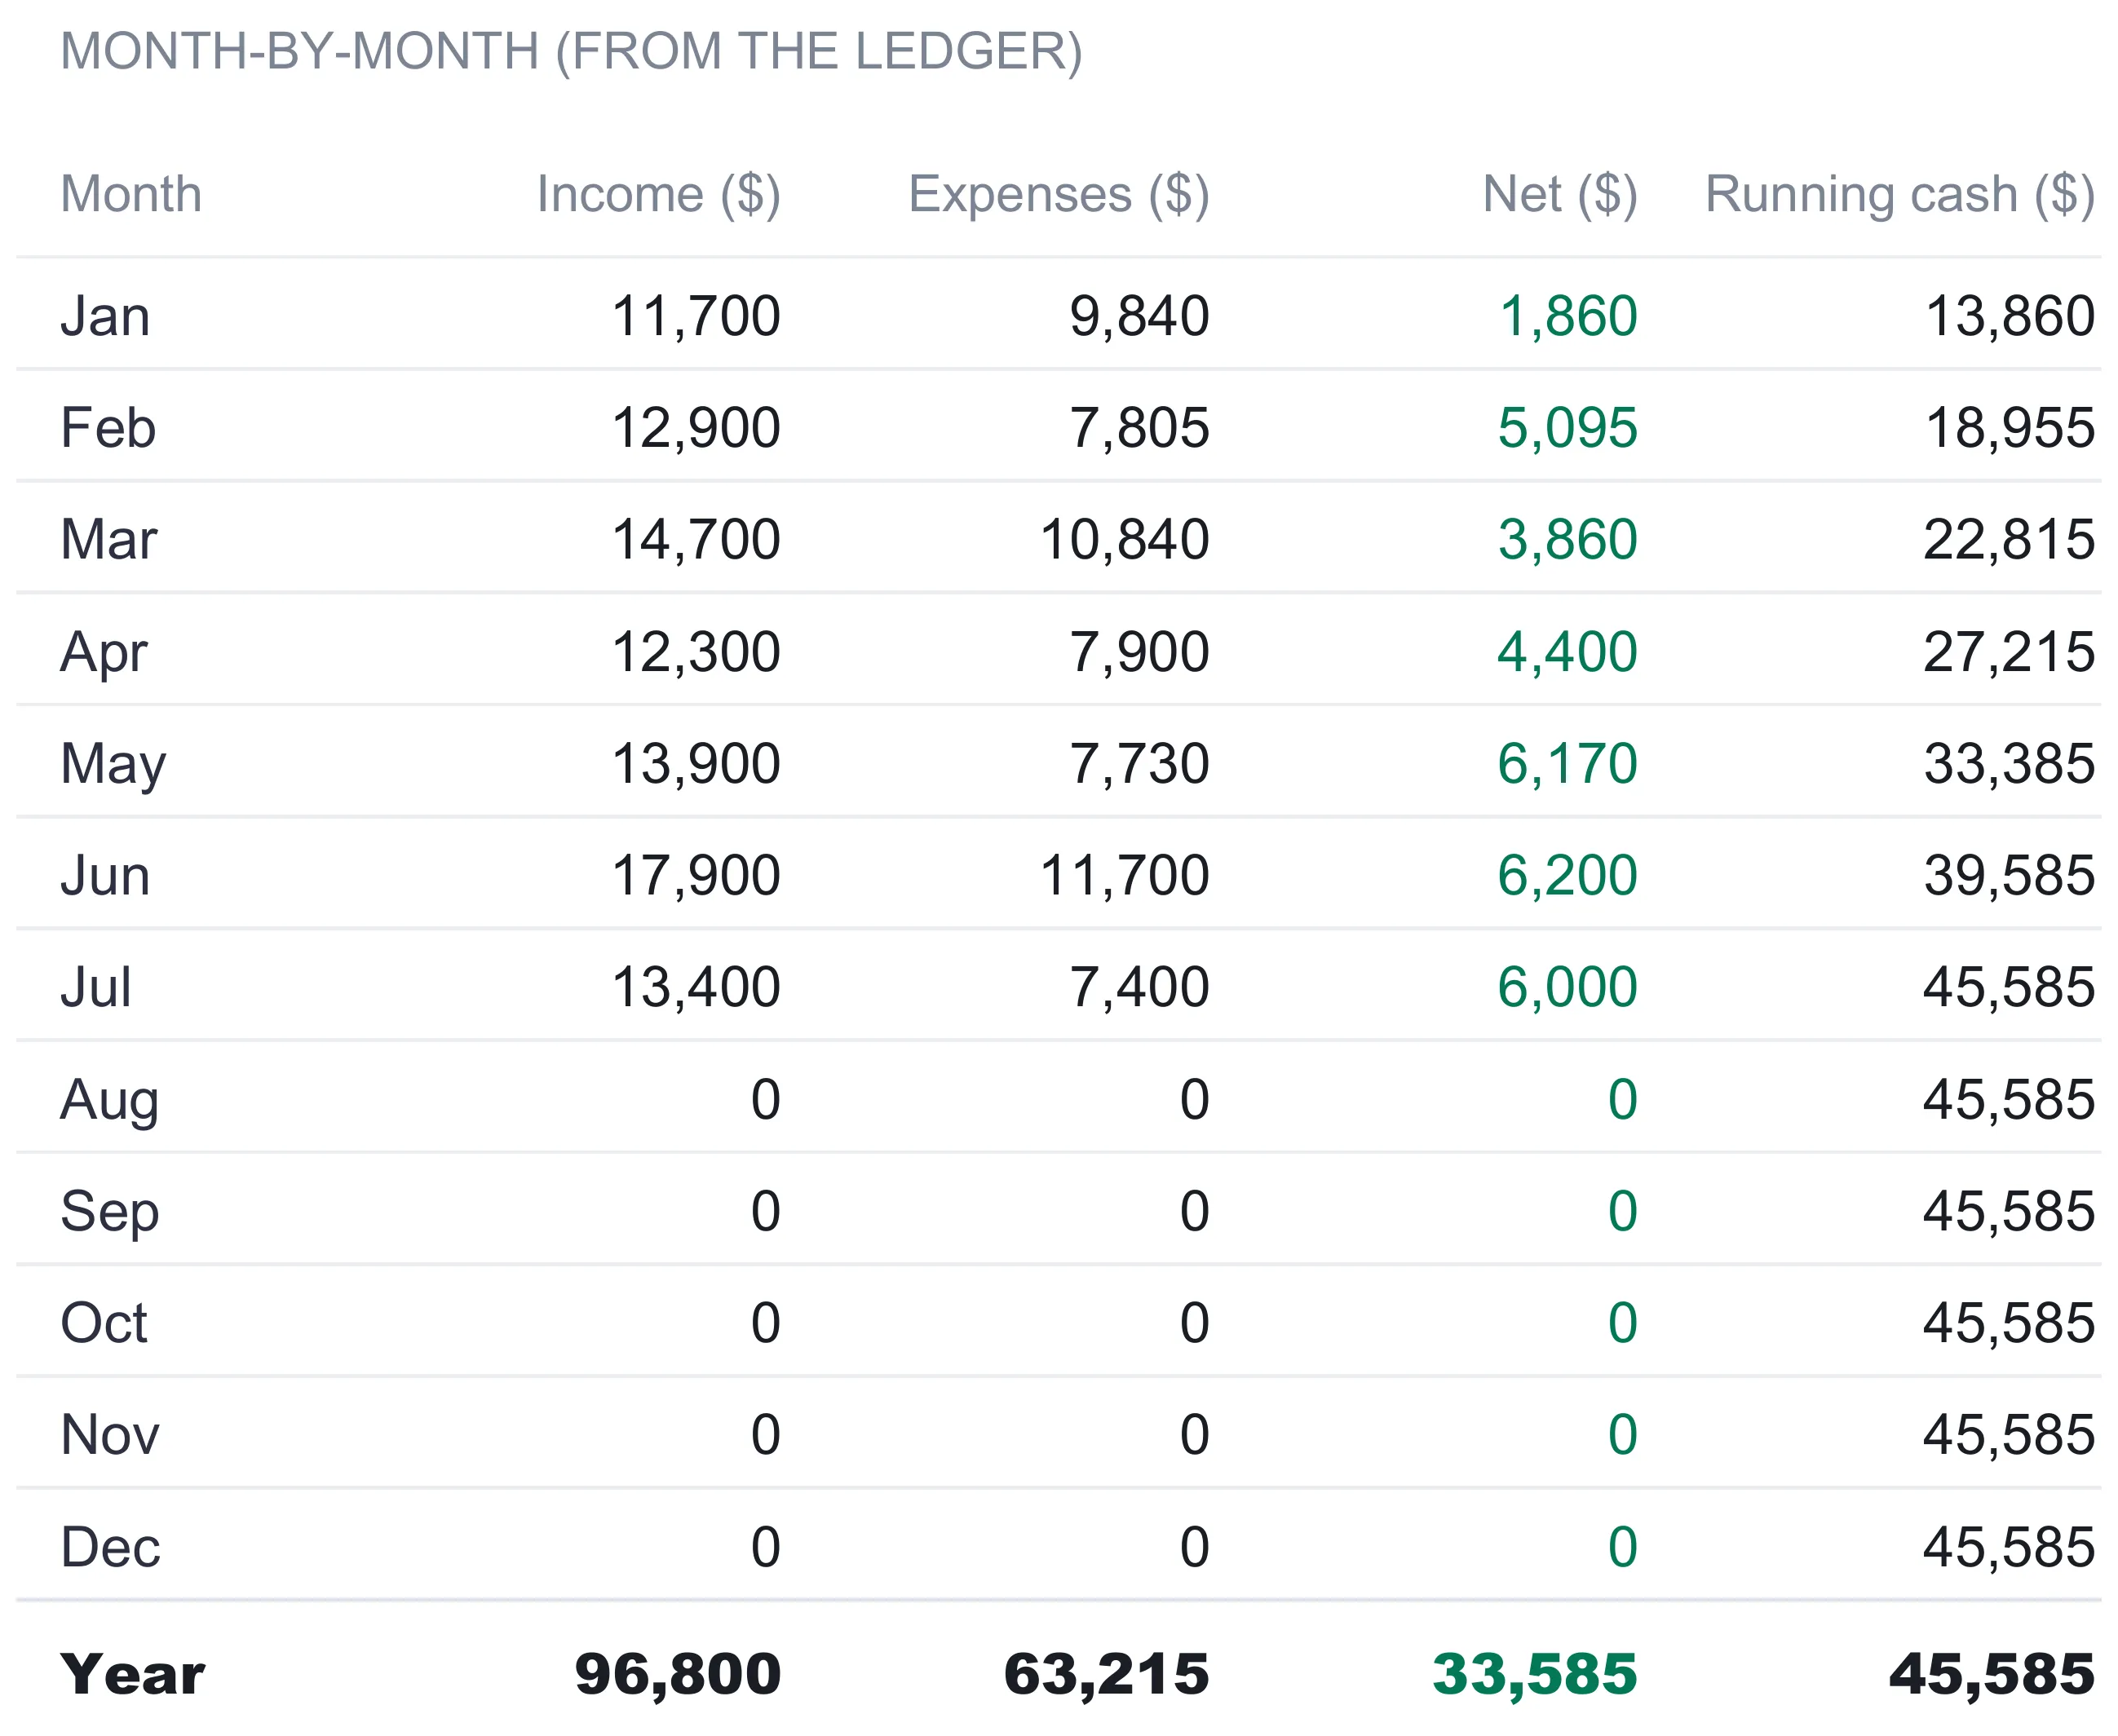
The Monthly sheet rolls the ledger up by the Month column into a twelve-row table, one row per calendar month plus a year total. Every cell is computed; nothing here is typed. Each month shows four numbers: income, expenses, net, and running cash.
Income and expenses for a month are the sums of the ledger rows carrying that month number and the matching type. Net is simply income minus expenses for the month. Running cash is the one figure that carries across rows: it takes the opening cash balance from Settings and adds every month’s net up to that point, so the column traces the cash position forward through the year.
The sample year makes the shape easy to read. January nets 1,860 and lifts running cash from the 12,000 opening balance to 13,860. February adds 5,095 to reach 18,955. The climb continues through a strong June, where 17,900 of income against 11,700 of costs nets 6,200. It lands at 45,585 by the end of July, which is as far as the sample data runs. August through December sit at zero, waiting for entries. The year total row confirms the whole: 96,800 of income, 63,215 of expenses, 33,585 of net, and 45,585 of running cash, which is the same cash figure the dashboard reports.
See the profit picture: the P&L Summary
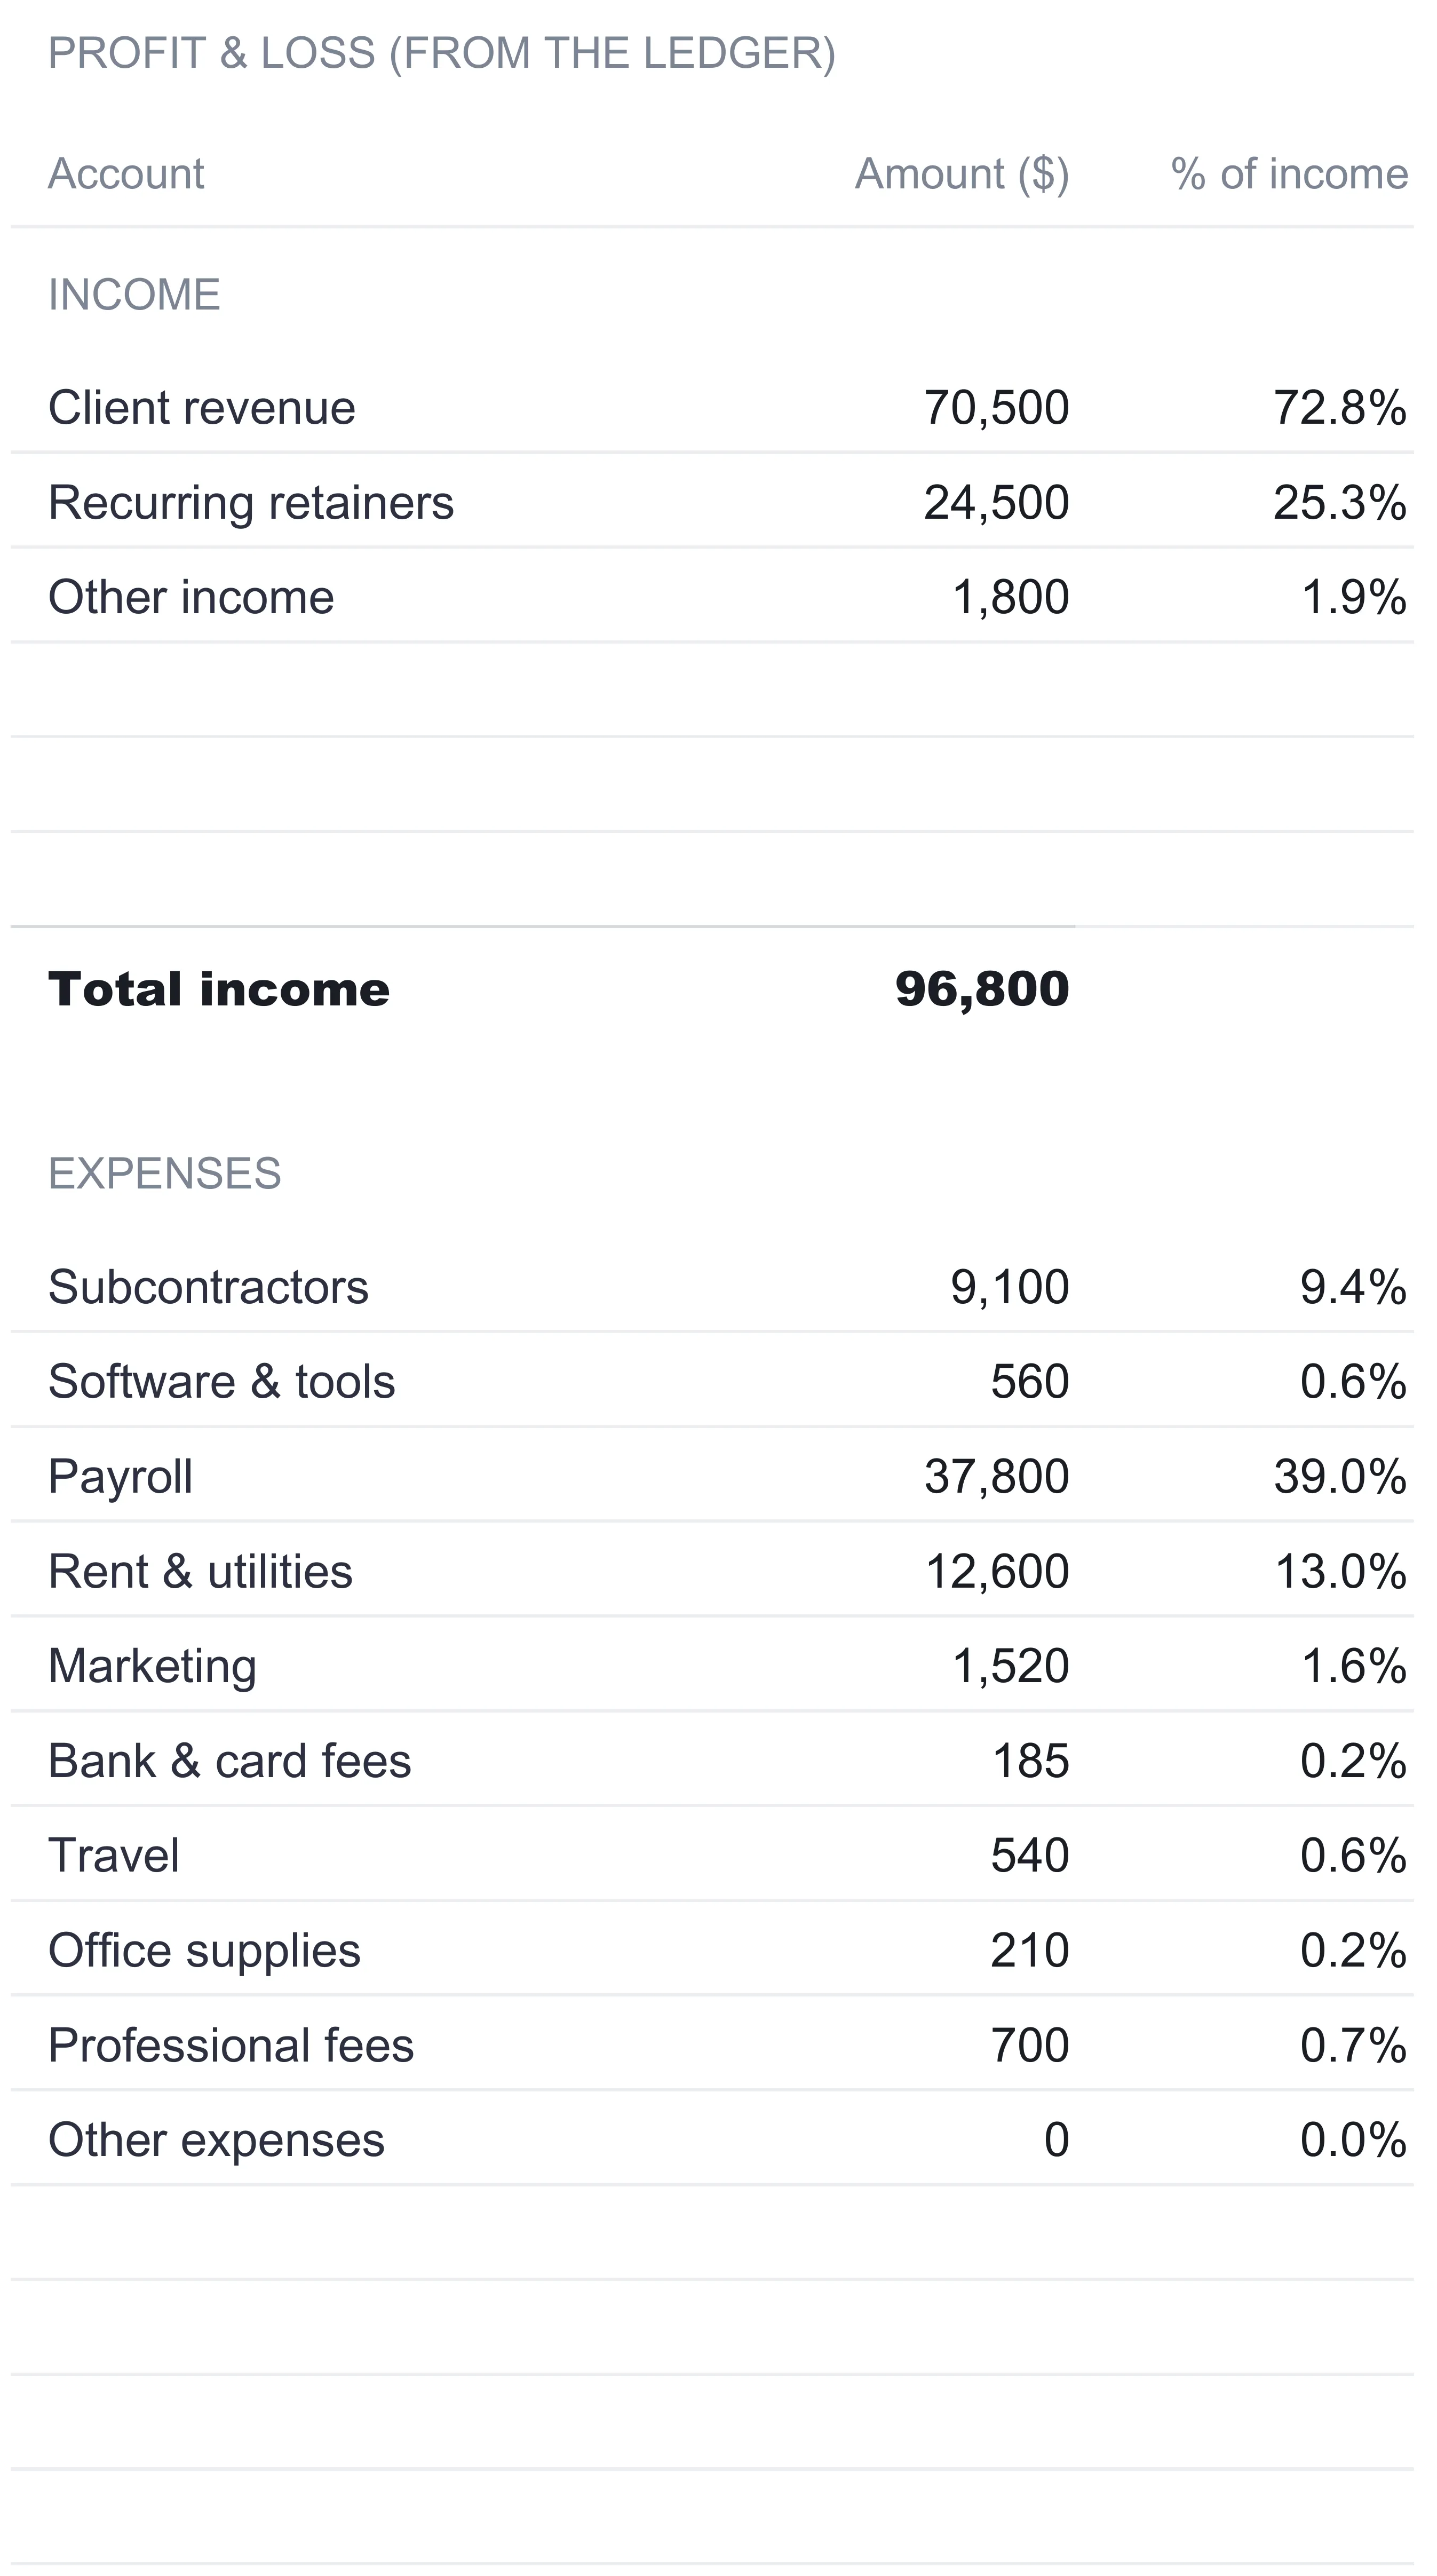
Where the Monthly sheet reads the year across time, the P&L Summary reads it by account. This is the profit and loss statement, and it lays the chart of accounts out in the classic order: income accounts first, then expense accounts, with a net profit at the bottom. Account names and amounts come straight from the Categories sheet, so renaming an account there renames its line here.
The sheet adds one column the Categories sheet does not have: each account as a percentage of total income. That single column is what turns a list of totals into something you can compare across a year or against another business. In the sample, Client revenue is 72.8 percent of income and Recurring retainers 25.3 percent, which says at a glance how much of the top line leans on project work versus steady retainers. On the expense side, Payroll is 39.0 percent of income and Rent & utilities 13.0 percent, while smaller lines like Bank & card fees sit at a fraction of a percent. Total income of 96,800 less total expenses of 63,215 leaves a net profit of 33,585, which is 34.7 percent of income. That last figure is the net profit margin, the share of every revenue dollar the business keeps after all recorded costs.
The dashboard: seven numbers and a status line
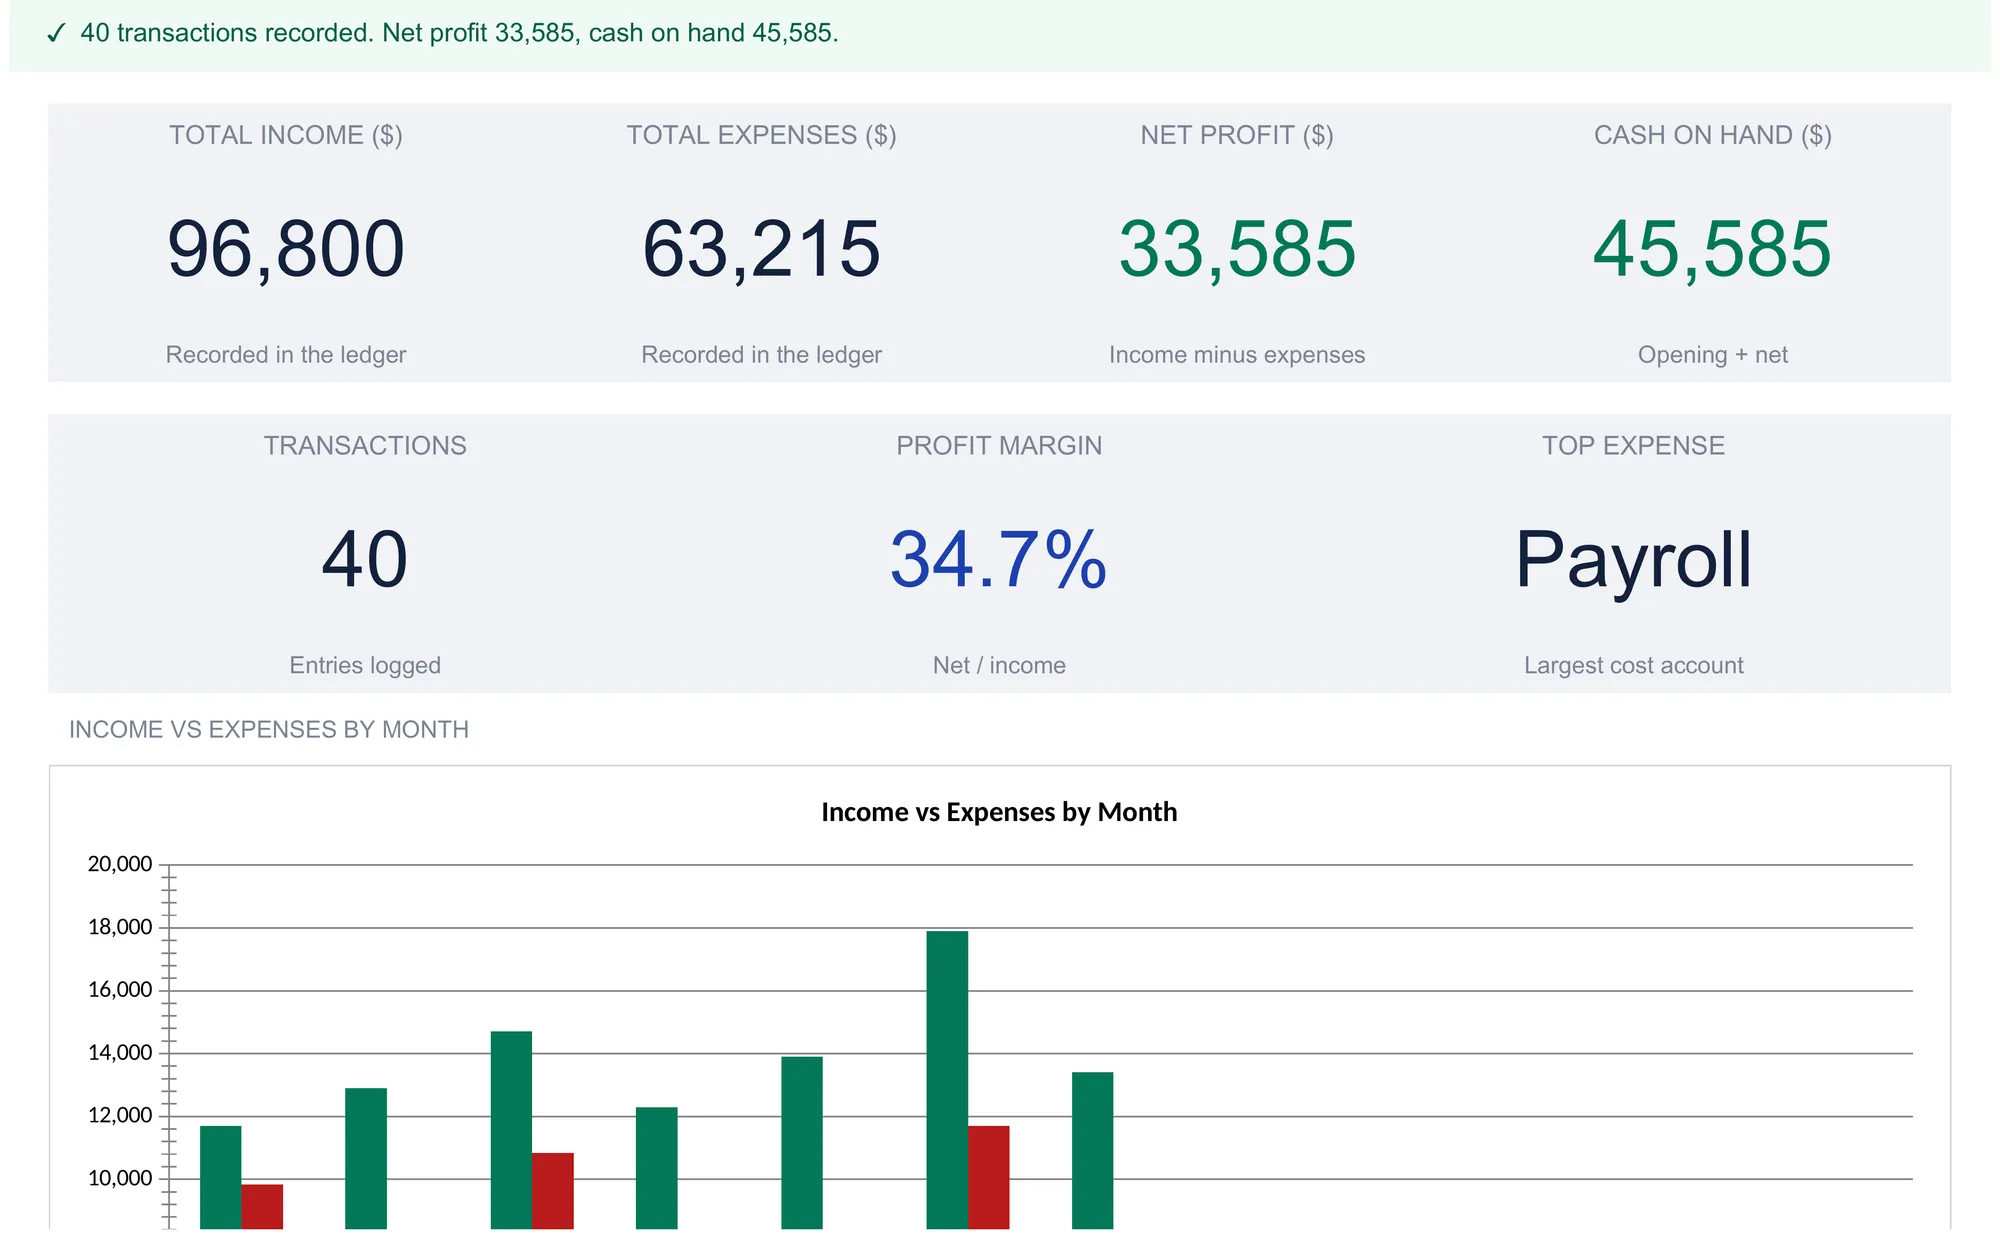
With Settings filled and the ledger populated, the Dashboard computes the year and puts it on one screen. A status line runs across the top, stating the year in a sentence: in the sample it reads that 40 transactions are recorded, net profit is 33,585, and cash on hand is 45,585. It is built to flip. If total expenses ever outrun total income, the line switches to a warning that reports the net loss instead, so a year that has gone underwater says so the moment the file opens.
Below the status line sit seven tiles, shown in full at the top of this article. Each is a plain division or sum of numbers the ledger already holds.
| Tile | Sample value | What it means |
|---|---|---|
| Total income | 96,800 | Every income row added up |
| Total expenses | 63,215 | Every expense row added up |
| Net profit | 33,585 | Income minus expenses |
| Cash on hand | 45,585 | Opening balance plus net |
| Transactions | 40 | Entries logged in the ledger |
| Profit margin | 34.7% | Net profit divided by income |
| Top expense | Payroll | The largest single expense account |
The top expense tile is the one that does a little detective work: it scans the expense accounts, finds the largest, and names it. In the sample that is Payroll at 37,800, comfortably the biggest cost, which the tile surfaces without anyone hunting for it. Beneath the tiles the dashboard charts the year, plotting income against expenses by month and expenses by category, so June’s peak and the weight of payroll are visible at a glance rather than only in the tables.
The number no bank statement shows is the one in the middle: net profit. A bank balance tells you cash moved; it has no idea which of that was revenue and which was a bill. Seeing 96,800 of income and 33,585 of profit on the same screen, with the cash position beside them, is most of the reason to keep books at all.
Net profit, profit margin, and cash on hand in plain terms
Three of the dashboard figures carry a little accounting weight, and all three are simple arithmetic on numbers the ledger already holds.
Net profit (96,800 minus 63,215 equals 33,585) is what is left after every recorded expense comes out of income. It is the single clearest answer to “did the business make money this year.”
Profit margin (33,585 divided by 96,800 equals 34.7 percent) restates net profit as a share of income. Two businesses of very different sizes can be compared on margin even when their raw profit figures are worlds apart, which is why it travels better than the dollar amount alone.
Cash on hand (12,000 opening plus 33,585 net equals 45,585) tracks the money position rather than the profit. Profit and cash differ whenever timing does, so keeping both in view stops a profitable-looking year from hiding a cash squeeze, or the reverse.
What this template is, and what it isn’t
Knowing where a tool stops is part of using it well, and this one draws a clear line. It is single-entry bookkeeping: each transaction is one row with one amount and a type of Income or Expense, and the reports add those rows up in different ways. That is a genuine method, and for a service business tracking money in and money out it is often all that is needed. What it is not is double-entry bookkeeping, where every transaction is recorded twice, as a debit to one account and a credit to another, and the books are kept in permanent balance. Double-entry is what dedicated accounting packages are built around, and a business carrying inventory, loans, or accrual accounting usually reaches for one.
Two more boundaries are worth naming up front. The workbook tracks one business per file. Settings holds a single business name, currency, and opening balance, and the reports describe that one set of books, so a second company is a second copy of the file rather than a second tab. And the figures reflect what has been entered, not a live bank balance. The cash on hand tile is the opening balance plus the income and expenses recorded in the ledger, which means it is only as current as the last row typed. None of that is a shortcoming so much as a description: a spreadsheet ledger is a clear, auditable record of transactions a person enters, and it stays clear precisely because it is not trying to be a live accounting system.
Seen that way, the sample year reads as a small services business having a solid stretch. Income leans on project work, with Client revenue at 70,500 against 24,500 of steadier retainer income, and the single heaviest cost is Payroll at 37,800. The reports do not judge any of that; they total it, sort it, and put it where it can be read. What an owner does with a 34.7 percent margin or a payroll line that large is a business decision the sheet has no opinion on. Its job is to make the numbers visible and consistent, which is the part that is genuinely hard to do from memory once the entries pile up.
Excel or Google Sheets for bookkeeping
The template is an .xlsx file built on ordinary formulas, with no macros and no add-ons, so it behaves the same in Microsoft Excel and in Google Sheets after an upload. Google Sheets suits an owner who wants to enter a transaction from a phone on the way back from a supplier, or share the file with an accountant who works in the browser. Excel suits someone who prefers a local file and heavier keyboard work. The structure described here, one ledger feeding a chart of accounts and a set of reports, is equally buildable in either program, and this walkthrough works the same whichever you open it in.
Where the books meet tax time
The reason to keep the categories clean shows up at year end. The IRS Recordkeeping guidance states that a business may choose any recordkeeping system that clearly shows income and expenses, that purchases, sales, payroll, and other transactions generate the supporting documents behind the books, and that the owner is responsible for substantiating what a return claims. A ledger that totals income and expenses by account, with a receipt or invoice behind each row, is exactly the kind of system that language describes.
Many small businesses that operate as a sole proprietor report the result on a Schedule C, which sets out profit or loss from a business, and the expense accounts on the Categories sheet line up with the way that form groups costs. Arriving at filing time with income and categorized expenses already totaled turns preparation into a copy job rather than a reconstruction. Which form a specific business files, and which costs are deductible, is a question a tax professional can settle for the situation.
Which template fits the job
- Business Bookkeeping Spreadsheet Template ($29) is the workbook this walkthrough follows: the transaction ledger, the chart of accounts, the monthly and profit and loss reports, and the seven-tile dashboard, ready for a single business in Excel or Google Sheets.
- Profit & Loss Statement Spreadsheet Template ($29) goes deeper on the reporting side for an owner whose main question is margins rather than day-to-day entry. Where the bookkeeping template derives a P&L as one of several reports off the ledger, the dedicated Profit & Loss Statement Spreadsheet Template is built around gross profit, operating margin, and a forecast measured against actuals month by month, with a variance sheet and best, expected, and worst case scenario cards.
Related
- QuickBooks vs Wave for Freelancers - where dedicated accounting software fits against a spreadsheet
- Google Sheets vs Excel for Business Cash Flow - the same platform question, applied to cash tracking
- Cash Flow Forecast Template for Business - the forward-looking companion to a backward-looking ledger
Frequently asked questions
What is a chart of accounts in a bookkeeping spreadsheet?
A chart of accounts is the list of categories a business sorts its money into, split by type: income accounts such as client revenue and recurring retainers, and expense accounts such as payroll, rent, and software. In this template it lives on the Categories sheet, where each account name has a running total that sums every ledger row tagged with it. The account names on that sheet are the same ones the ledger's Category dropdown offers, so a category typed on a transaction always matches an account that reports it.
Is a spreadsheet single-entry or double-entry bookkeeping?
This template is single-entry: each transaction is one row with one amount and a type of Income or Expense, and the reports add those rows up. Double-entry bookkeeping records every transaction twice, as a debit and a credit across two accounts, and is what dedicated accounting software is built around. Single-entry suits a small service business tracking cash in and cash out, while a company carrying inventory, loans, or accrual accounting usually outgrows it.
Can I add my own income and expense categories?
Yes. The Categories sheet ships with named accounts and several blank spare rows underneath each section. Naming a blank row adds that account everywhere at once: its total starts calculating, and it appears on the P&L Summary and in the ledger's Category dropdown. Renaming an existing account carries the new name through every report, because the reports read the account names from that one sheet rather than storing their own copies.
How does the running cash figure work?
The Settings sheet holds an opening cash balance, 12,000 in the sample. The Monthly sheet then adds each month's net to that starting figure to show a running cash line, and the dashboard's cash on hand tile is the opening balance plus total income minus total expenses. It is a record of cash movement through the ledger, not a live bank feed, so it reflects what has been entered rather than a real-time balance.
Does bookkeeping in a spreadsheet work for taxes?
Income and categorized expenses totaled by account is the raw material most tax preparation starts from. The IRS states that a business may choose any recordkeeping system that clearly shows income and expenses, and that the owner is responsible for substantiating the entries. A spreadsheet ledger with supporting documents behind each row fits that description, though whether a given business files a Schedule C or another form, and which expenses are deductible, is a question for a tax professional.
Sources
- Recordkeeping - Internal Revenue Service
- About Schedule C (Form 1040), Profit or Loss from Business (Sole Proprietorship) - Internal Revenue Service
About this article
Template sheets, inputs and outputs checked on 2026-09-10 against the shipped Business Bookkeeping Premium workbook (Dashboard, Transactions, Categories, P&L Summary, Monthly, Settings, How to Use tabs). IRS Recordkeeping and Schedule C references checked against the live IRS pages at writing time. Last reviewed September 2026.