A credit card payoff spreadsheet takes a list of cards and one extra payment, then computes the whole plan: which card is cleared first, the month each is gone, the interest paid, and how utilization falls along the way. This walkthrough follows our Credit Card Payoff Ultimate ($29) using its own sample data, four cards totaling $12,600 that clear in 20 months for $2,646 of interest, and covers the strategy comparison, the balance transfer model, and the utilization tracker that a card-specific plan needs. Built on plain formulas for Excel and Google Sheets.
Someone carrying four credit cards can usually recite the total they owe and the minimums that come due each month. The harder questions are the ones a statement never answers. If there is a spare $200 a month to throw at the pile, which card should it land on? How many months until the last one clears, and what does the interest add up to on the way? Would moving one balance to a promotional rate actually help once the transfer fee is counted? And what happens to the balances against the limits, the ratio that quietly shapes a credit score, while all this plays out? None of that is obvious from a drawer of paper, but every piece of it is arithmetic, and arithmetic is what a spreadsheet is for.
A credit card payoff spreadsheet takes the list of cards and one extra payment and turns them into a dated plan. The examples below come from our Credit Card Payoff Ultimate Spreadsheet Template ($29), which computes the payoff order, a month-by-month schedule, a side-by-side comparison of three payoff strategies, a balance transfer model, and a utilization projection, all from the cards you enter. The structure is reproducible by hand if you would rather build your own, and the walkthrough follows the sheets in the order the file lays them out.
What a credit card payoff spreadsheet has to hold
Strip the plan down and there are only a few moving parts:
- The cards. For each one: a name, the current balance, the APR, the credit limit, the minimum the issuer requires, and what you plan to actually pay. This is everything you type.
- One extra payment. A single monthly amount, above all the planned payments, that drives the plan and rolls forward as cards clear.
- The schedule. A month-by-month projection of what gets paid on every card and what remains, with the extra piling onto one target card at a time.
- The card-specific read-outs. The payoff order and dates, the interest under different orderings, a balance transfer comparison, and a utilization projection. These are all calculated, never typed.
The template gives each of these its own sheet. Card Setup holds the inputs, the Payoff Schedule is the engine, and Strategy Comparison, Balance Transfer, and the Utilization Tracker are three different card-specific ways of reading the result, with a Dashboard on top and a How to Use sheet carrying the instructions.
Start with the cards: the Card Setup sheet
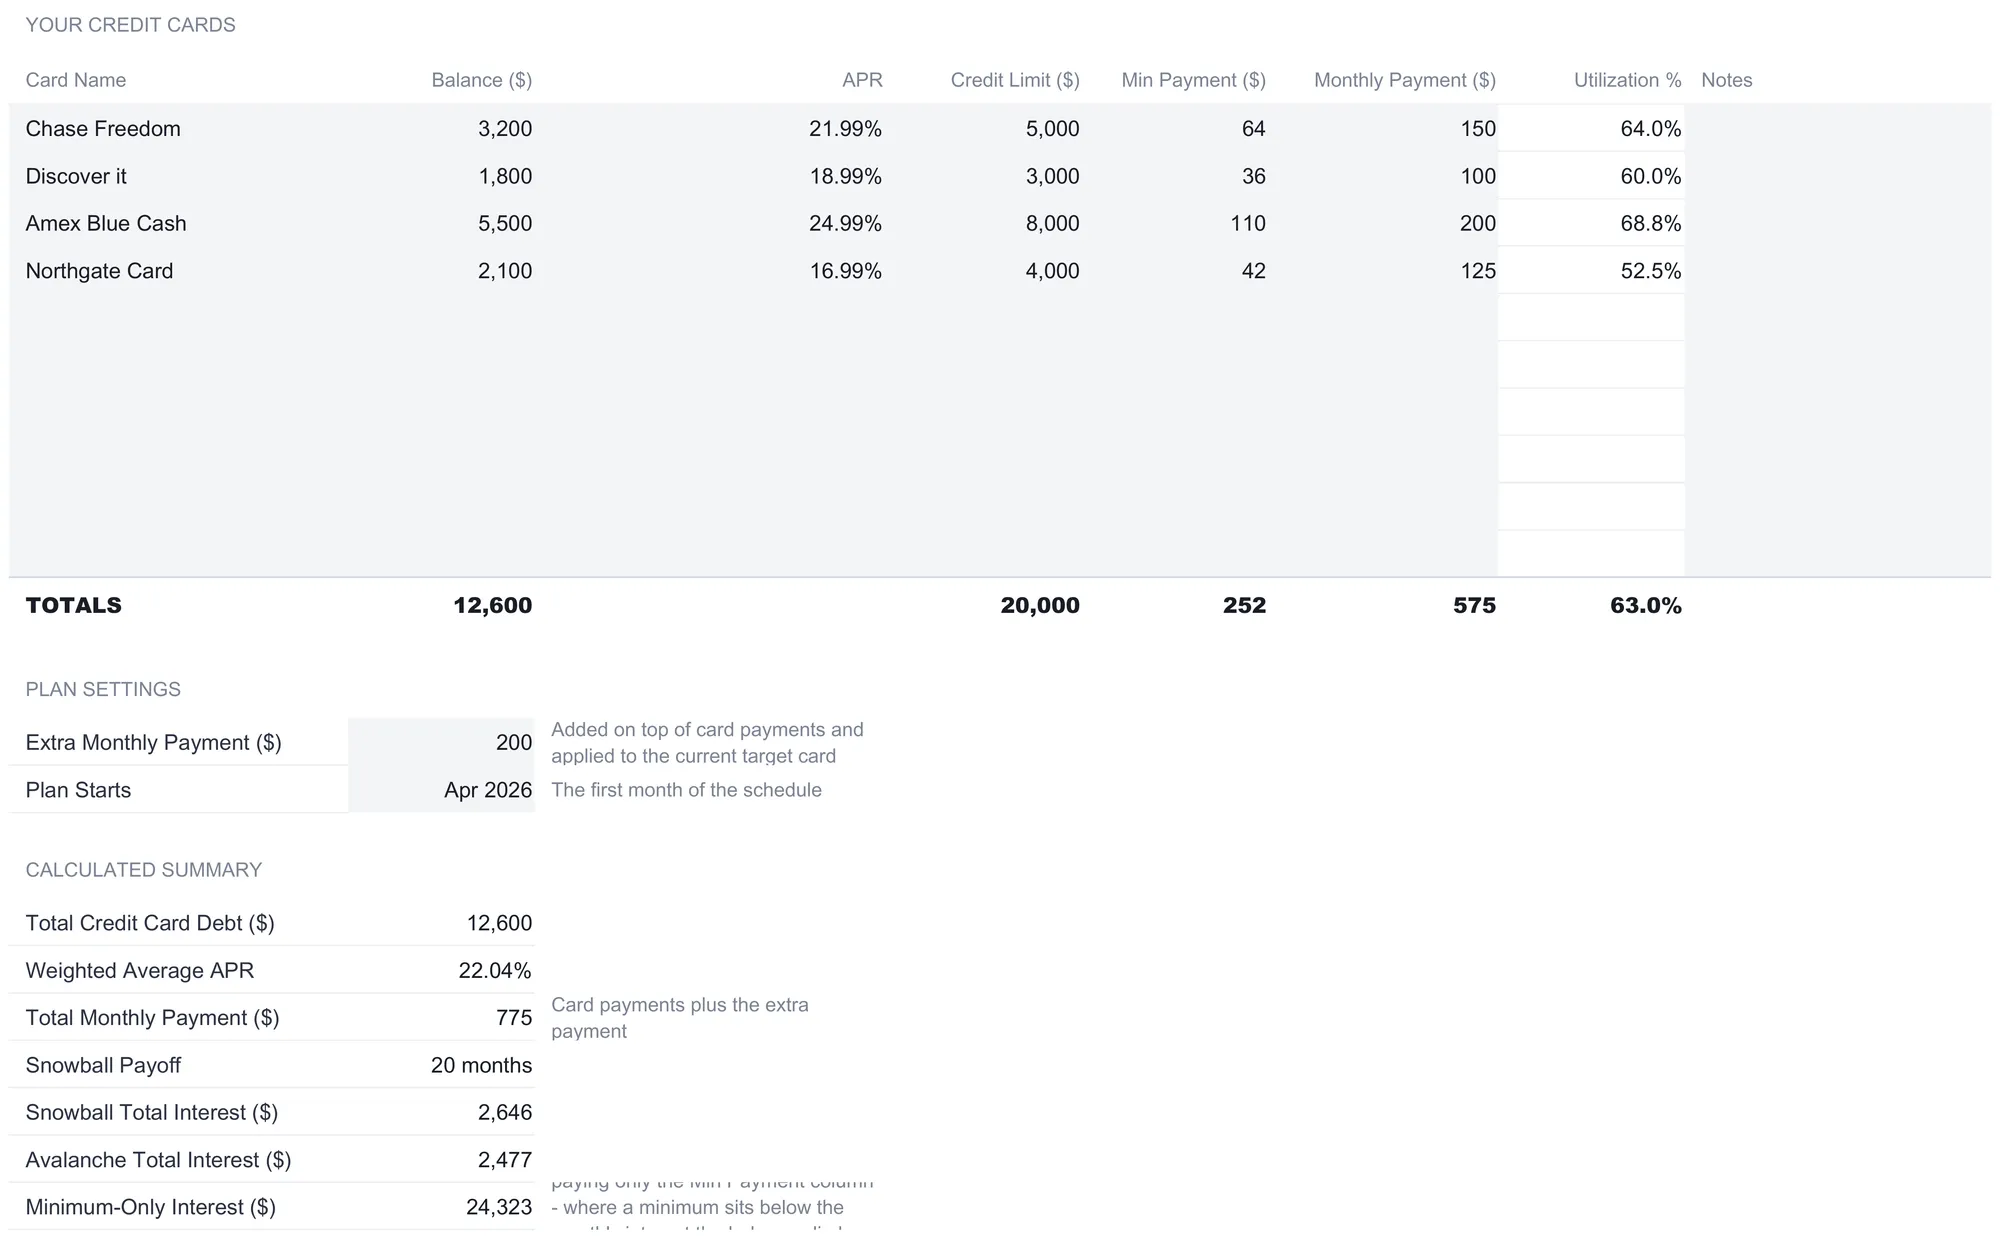
Everything begins on Card Setup. Up to 10 cards are supported, one per row, and the sheet keeps the same slot order everywhere, so card one is the first row on every other sheet. The sample fills four rows:
| Card | Balance ($) | APR | Credit limit ($) | Min payment ($) | Monthly payment ($) | Utilization |
|---|---|---|---|---|---|---|
| Chase Freedom | 3,200 | 21.99% | 5,000 | 64 | 150 | 64.0% |
| Discover it | 1,800 | 18.99% | 3,000 | 36 | 100 | 60.0% |
| Amex Blue Cash | 5,500 | 24.99% | 8,000 | 110 | 200 | 68.8% |
| Northgate Card | 2,100 | 16.99% | 4,000 | 42 | 125 | 52.5% |
| Totals | 12,600 | 20,000 | 252 | 575 | 63.0% |
The utilization column on the right fills itself for each row, dividing the balance by the credit limit, so the Amex at $5,500 against an $8,000 limit reads 68.8 percent while the Northgate card reads 52.5 percent. The totals row sums the money columns and computes an overall utilization of 63 percent, $12,600 of balances against $20,000 of limits.
Two of the columns look similar and are easy to conflate, but the sheet treats them very differently, and the distinction is the one worth getting right first. Min Payment is what the issuer requires each month, and it does one job only: it feeds the minimum-only comparison that the interest-saved figure is measured against. Monthly Payment is what you plan to actually put toward the card, and it is the number the payoff schedule runs on. In the sample the four minimums total $252, but the planned monthly payments total $575, and it is that $575 the plan uses. A card whose planned payment is left at its minimum simply pays the minimum; a card set higher pays more, and the schedule reads whatever is entered.
Below the card list sits the single most important input, the Extra Monthly Payment, set to $200 in the sample and described on the sheet as the amount added on top of the card payments and applied to the current target card. That one cell is the engine’s fuel. A Plan Starts date, April 2026 in the sample, sets the first month of the schedule, and every dated read-out (the payoff date, the utilization months) counts forward from it.
Underneath, a Calculated Summary block turns the inputs into headline numbers before you have opened any other sheet:
| Summary figure | Sample value |
|---|---|
| Total Credit Card Debt | $12,600 |
| Weighted Average APR | 22.04% |
| Total Monthly Payment | $775 |
| Snowball Payoff | 20 months |
| Snowball Total Interest | $2,646 |
| Avalanche Total Interest | $2,477 |
| Minimum-Only Interest | $24,323 |
| Interest Saved vs Minimum | $21,677 |
The weighted average APR is balance-weighted, so the big high-rate Amex pulls the blended figure up while the smaller low-rate Northgate card pulls it down, landing at 22.04 percent. The total monthly payment is the $575 of planned card payments plus the $200 extra, which is $775, the amount leaving the account every month until the last card clears. The minimum-only interest figure is worth reading with the sheet’s own footnote in mind. It is the interest charged over 120 months paying only the Min Payment column. Where a minimum sits below the month’s interest the balance climbs rather than falls, which is how the figure reaches $24,323. The interest-saved number is that minimum-only figure less the snowball interest, and because the minimums do not actually clear the cards inside the schedule, the sheet describes the saving as a floor rather than the whole of it.
The engine: the Payoff Schedule
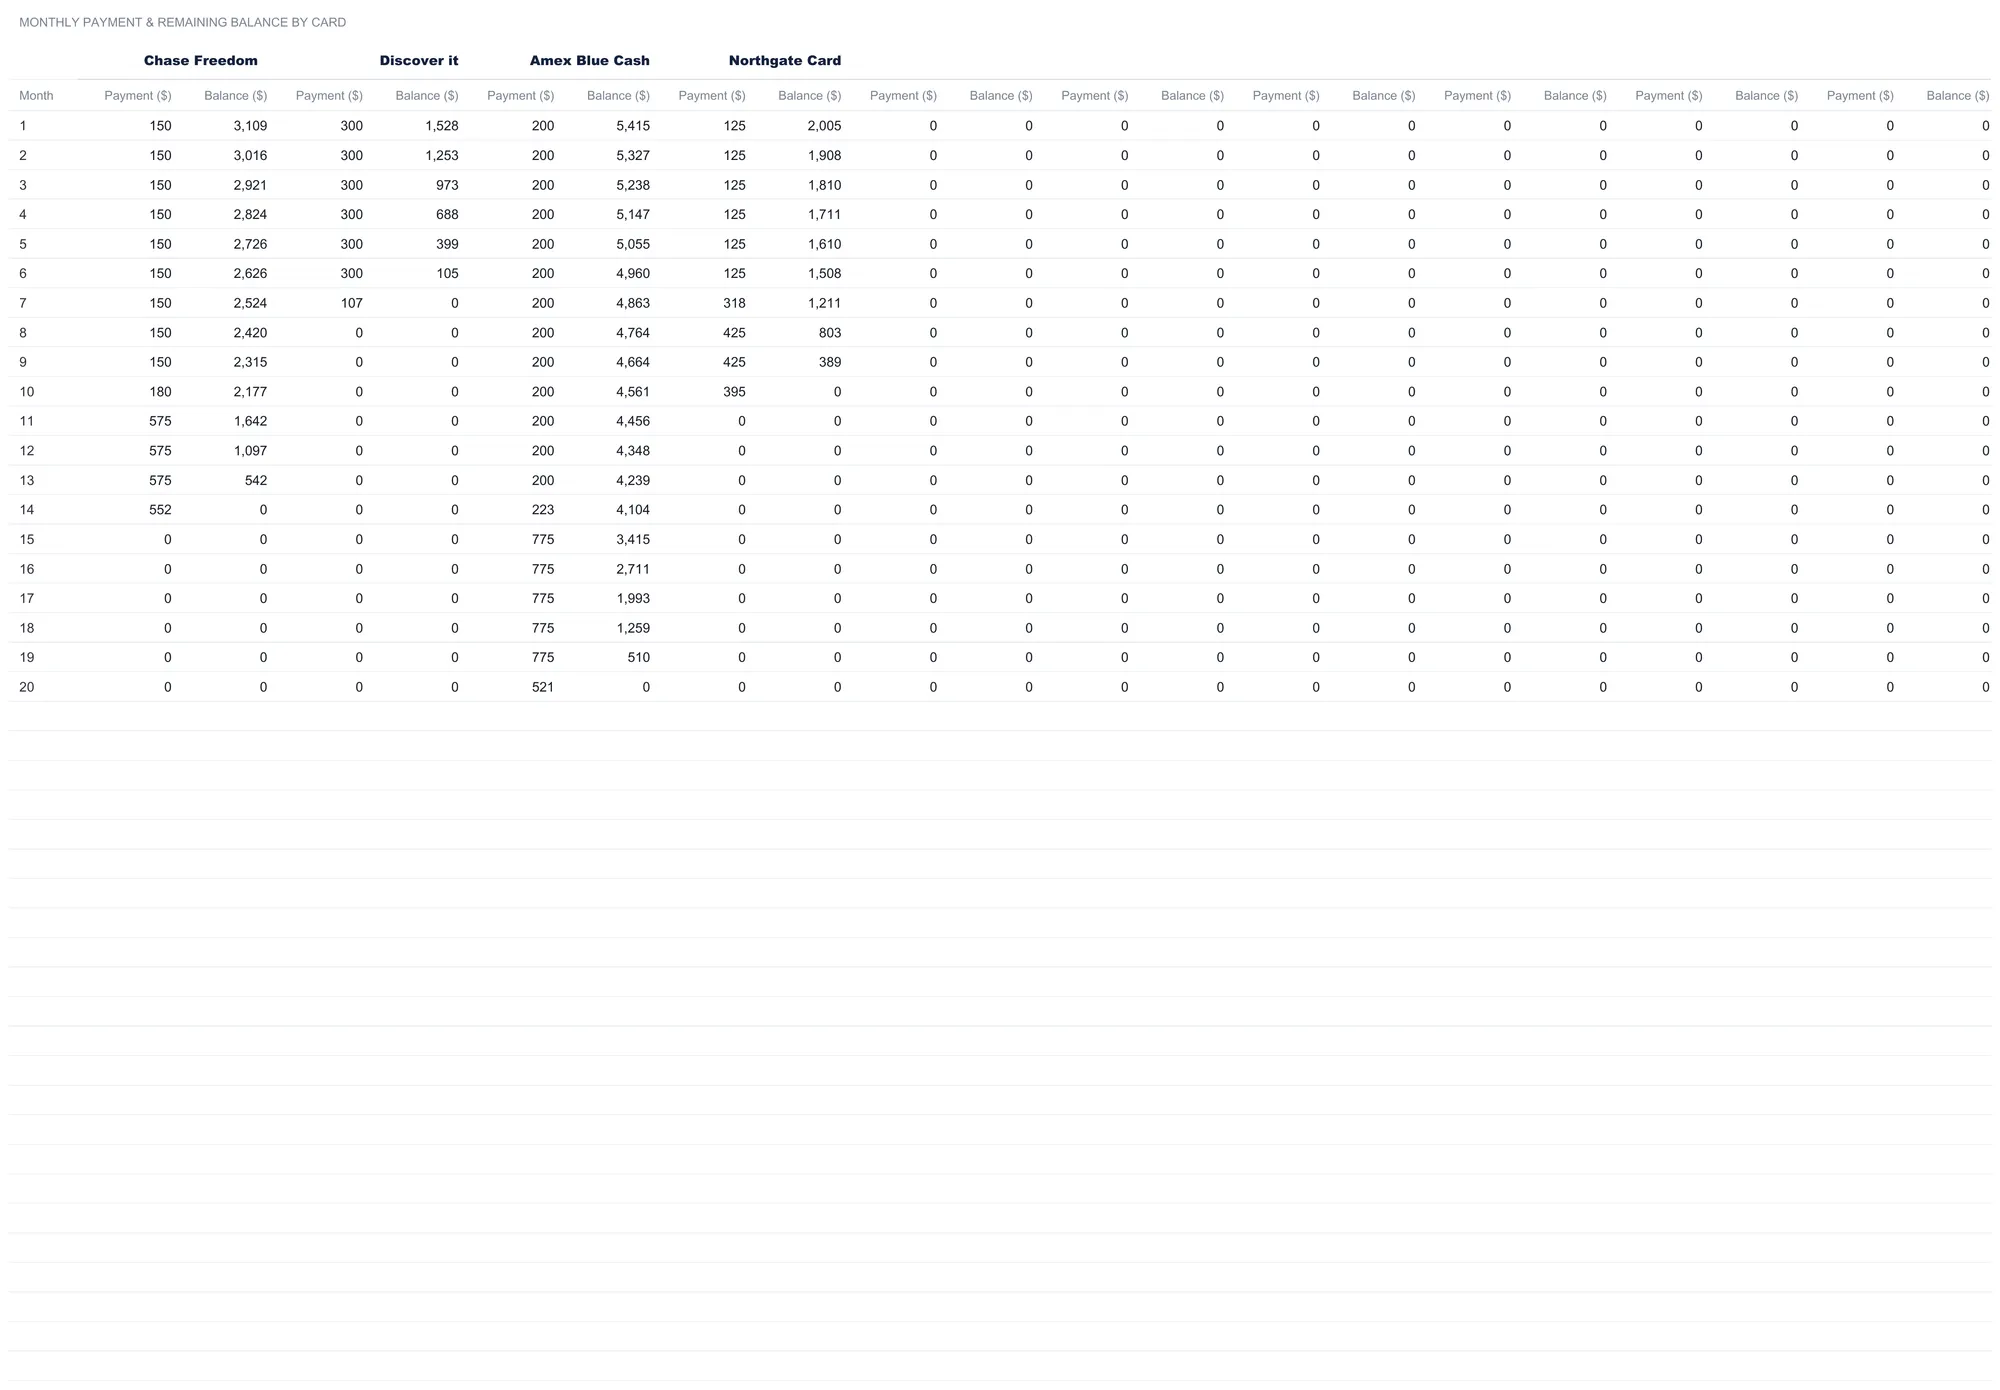
The Payoff Schedule is where the plan plays out. It runs a 120-month grid with one Payment and one Balance column for every card slot, in the order the cards were entered. The columns take their names from Card Setup, and the rows stop once nothing is owed, so a schedule is only as long as the plan needs. In the sample, 20 rows carry numbers.
The strategy the schedule runs is the snowball: pay each card’s planned amount, then aim the extra at the smallest balance until it is gone, and roll each freed-up payment onto the next-smallest card. That ordering comes from the balances, not the rates, which is why the queue reads Discover it first ($1,800), then Northgate ($2,100), then Chase ($3,200), then Amex ($5,500). The dashboard’s Snowball Order column numbers the cards that way rather than in row order, so the Discover row carries a 1, Northgate a 2, Chase a 3, and the Amex a 4.
Trace the sample month by month and the mechanism is concrete:
- The smallest balance goes first. The Discover it card has a $100 planned payment, but the $200 extra piles on top, so it is paid $300 a month. Its balance runs $1,528, $1,253, $973, $688, $399, and $105, clearing in month 7.
- The freed payment rolls forward. When Discover it clears, its $100 and the $200 extra, $300 together, move to the Northgate card. Northgate had been paying $125; from month 8 it pays $425, and its balance falls from about $803 to $389 and then to zero in month 10.
- The snowball keeps growing. Northgate’s $125 now joins the pool. Chase Freedom, which had been paying $150, jumps to $575 a month from month 11 and clears in month 14. Finally the Amex absorbs everything at $775 a month, the full monthly budget, and clears in month 20.
Laid out as the amount landing on the current target, the snowball is one growing column of money:
| Target card | Payment on the target ($) | Cleared in month |
|---|---|---|
| Discover it | 300 | 7 |
| Northgate Card | 425 | 10 |
| Chase Freedom | 575 | 14 |
| Amex Blue Cash | 775 | 20 |
That last figure is the tell. By the end the entire $775 is landing on a single card. Nothing about the household budget changed over those 20 months; the same $775 went out every month. What changed is that each cleared card handed its payment to the next, so the amount hitting the target grew from $300 to $775. Watching the payment column step up each time a balance reaches zero is the clearest way to see it. The schedule shows the honest edge case too: a payment smaller than a month’s interest leaves that balance rising rather than falling, and the grid displays that instead of hiding it.
Three orders, one budget: the Strategy Comparison sheet
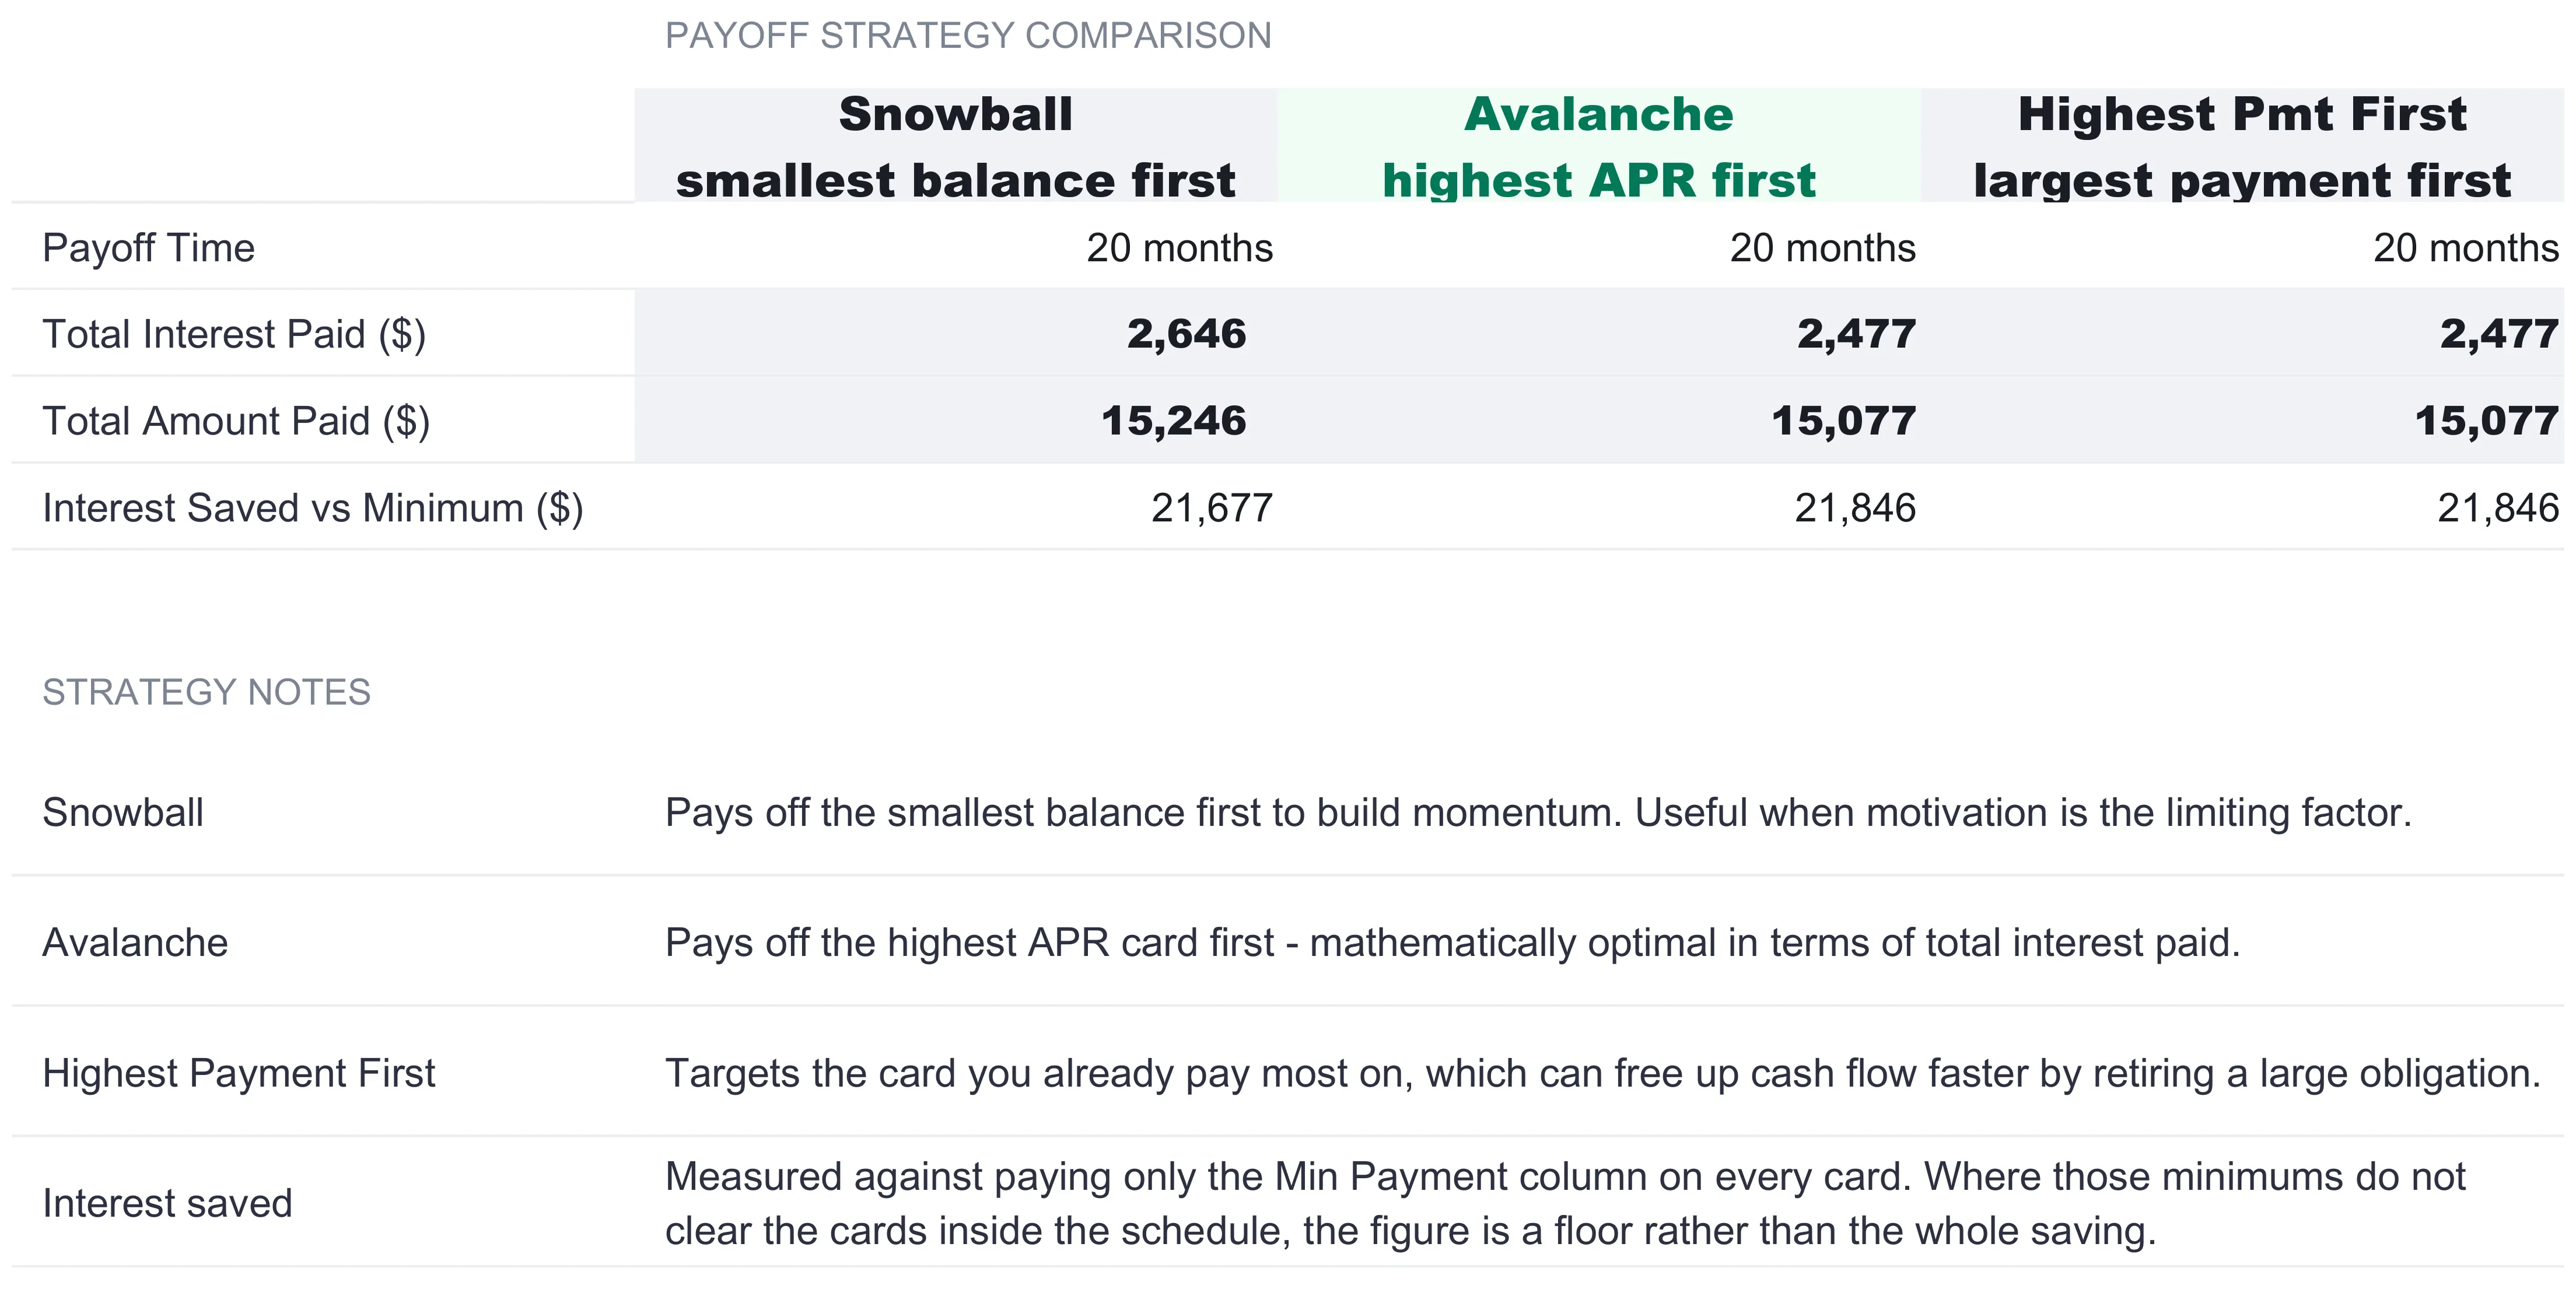
The snowball is one way to order the payoff, but it is not the only one, and a payoff date on its own does not say whether the ordering was the cheapest available. The Strategy Comparison sheet answers that by running three orderings on the same cards and the same total monthly outlay, changing only which card the extra payment attacks first.
| Measure | Snowball | Avalanche | Highest payment first |
|---|---|---|---|
| Payoff time | 20 months | 20 months | 20 months |
| Total interest paid ($) | 2,646 | 2,477 | 2,477 |
| Total amount paid ($) | 15,246 | 15,077 | 15,077 |
| Interest saved vs minimum ($) | 21,677 | 21,846 | 21,846 |
The three columns read across cleanly. The snowball targets the smallest balance first, which the sheet notes is useful when motivation is the limiting factor. The avalanche targets the highest APR first, described on the sheet as mathematically optimal in terms of total interest paid. The highest-payment-first order attacks the card already carrying the largest payment, which can retire a big obligation and free cash flow sooner. In this particular set of cards the avalanche and highest-payment orders happen to produce the same result, and both finish at $2,477 of interest against the snowball’s $2,646, a gap of about $169. All three clear the cards in the same 20 months, because the total money going out each month is identical; only the interest differs, and it differs because the extra lands on a higher-rate balance sooner under the avalanche.
That the snowball costs more here is not a verdict, it is a property of these balances and rates. The sheet leaves the choice open, and the interest-saved row on every column is measured against the same baseline, paying only the Min Payment column on every card, with the same caveat that where those minimums do not clear the cards, the figure is a floor rather than the whole saving. What the comparison does is put the trade-off on one screen, so the difference between clearing the smallest card first for momentum and clearing the priciest card first for cost is a number you can read rather than a debate you have to settle in your head. The Consumer Financial Protection Bureau lays out both orderings and leaves the decision to the reader.
Model an offer: the Balance Transfer sheet
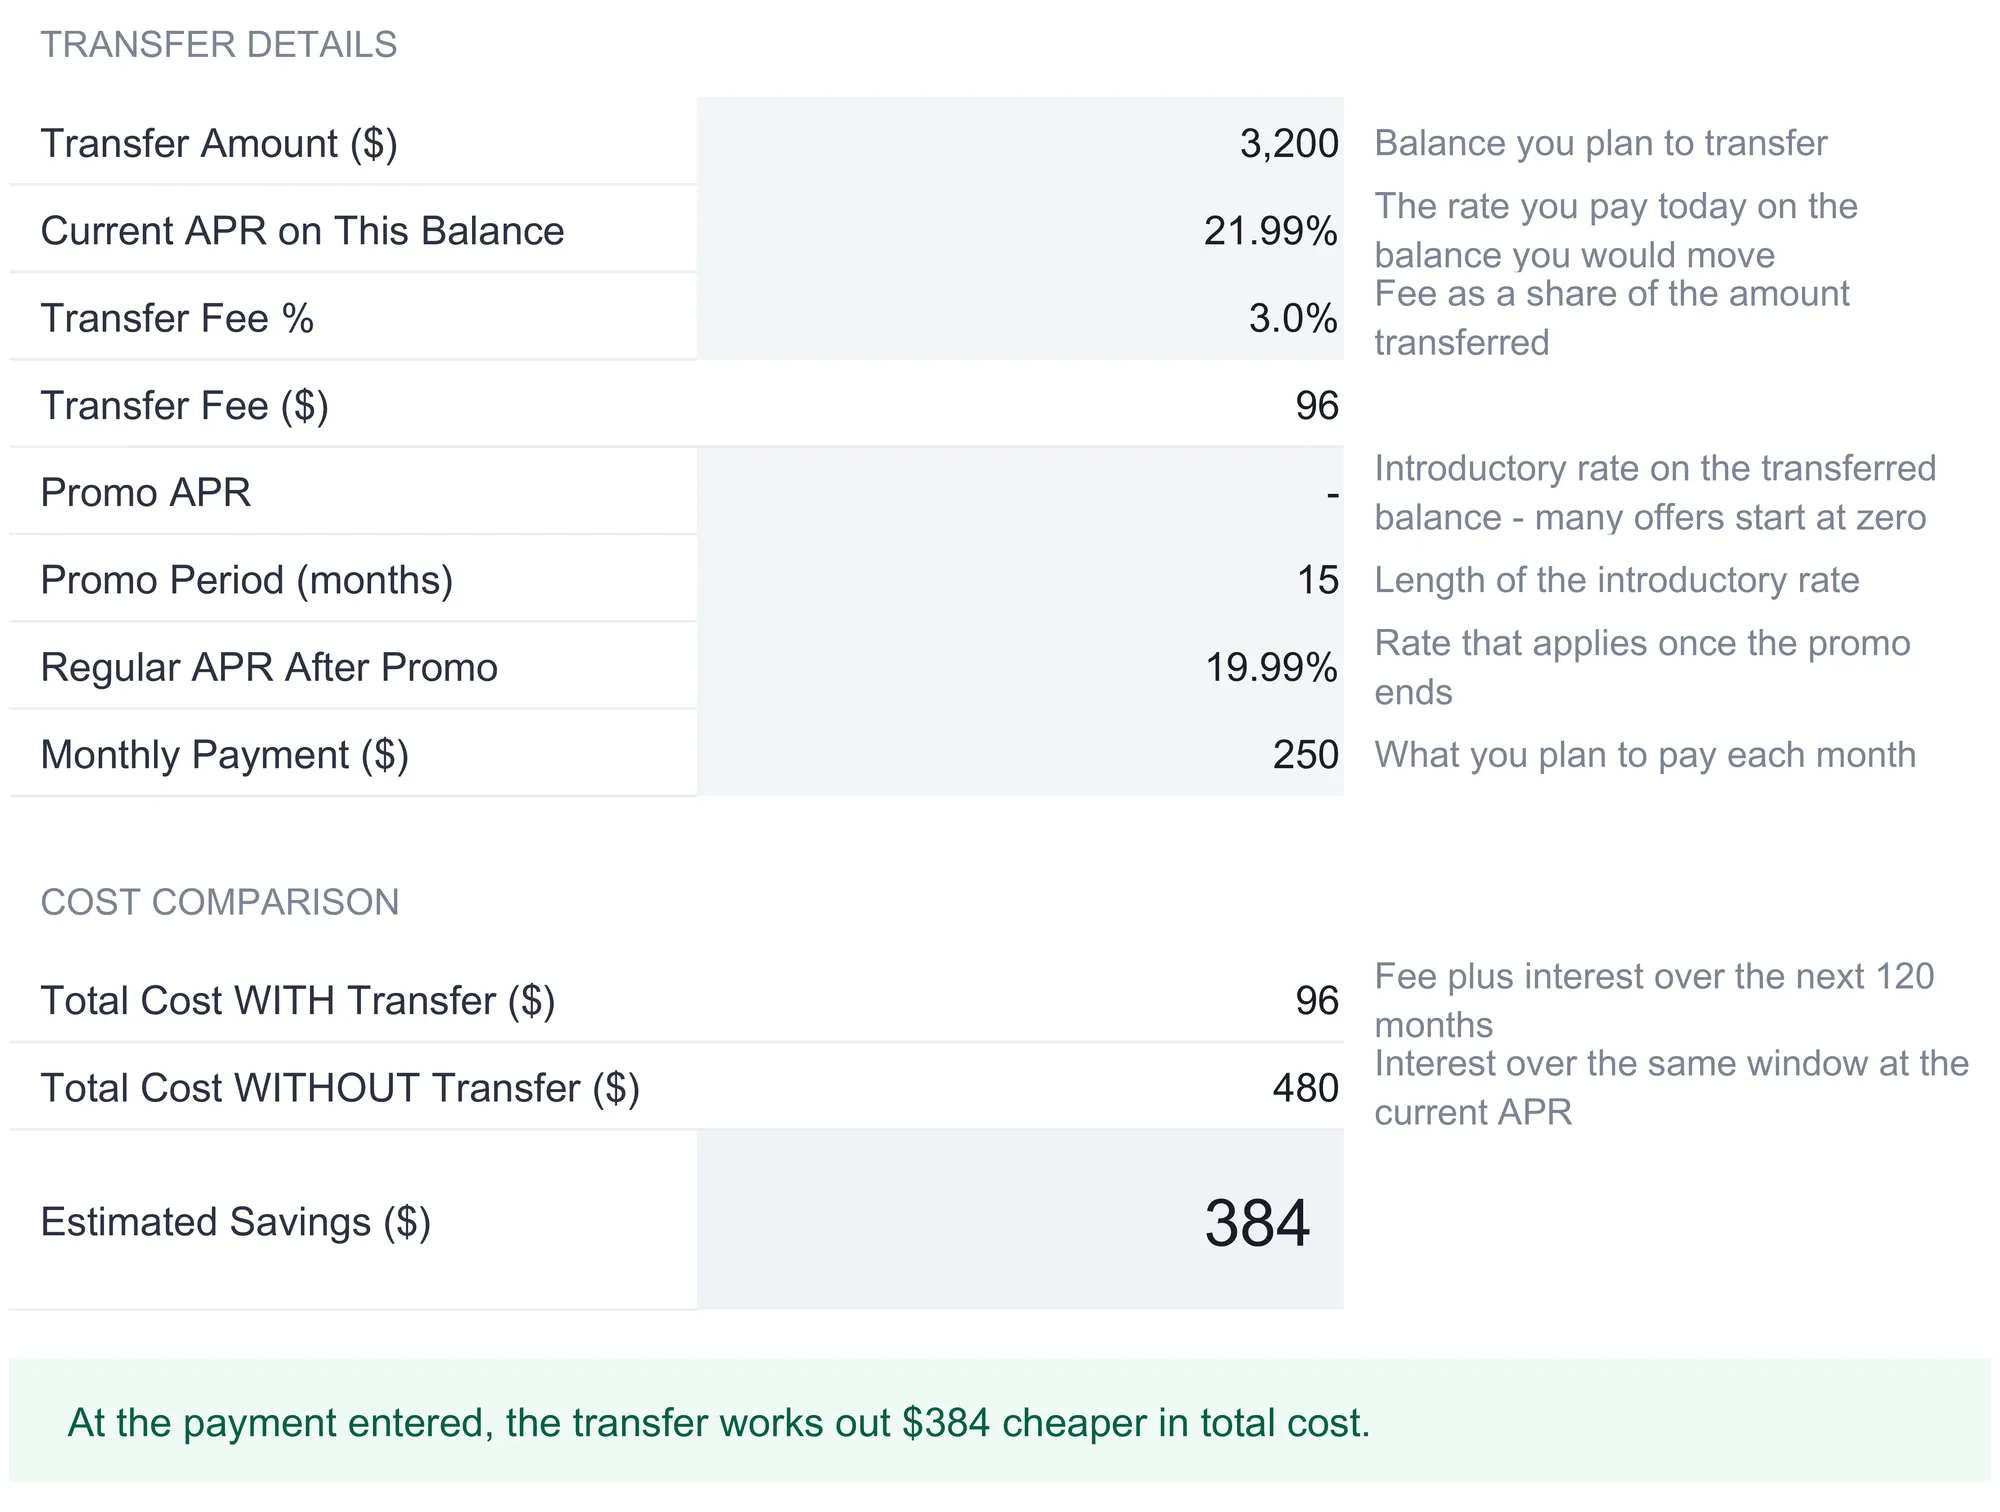
A promotional balance transfer is one of the few levers that can change the interest a card plan pays, and it is also the one most likely to look better than it is, because the fee is easy to forget and the rate after the promo is easy to overlook. The Balance Transfer sheet models a single offer from the figures you enter and states the result in total-cost terms.
The sample fills those inputs with the Chase Freedom figures, typed in rather than pulled from Card Setup:
| Input | Sample value |
|---|---|
| Transfer amount | $3,200 |
| Current APR on this balance | 21.99% |
| Transfer fee % | 3.0% |
| Transfer fee | $96 |
| Promo APR | 0% |
| Promo period (months) | 15 |
| Regular APR after promo | 19.99% |
| Monthly payment | $250 |
The transfer fee calculates itself as the amount moved times the fee percentage, so $3,200 at 3 percent is $96. From there the sheet compares two totals over the same 120-month window: the Total Cost With Transfer, which is the $96 fee plus whatever interest still accrues, and the Total Cost Without Transfer, which is the interest at the current 21.99 percent APR. In the sample those come out at $96 with the transfer against $480 without, so the transfer avoids enough interest to more than cover its fee, and the banner underneath states it plainly: at the payment entered, the transfer works out $384 cheaper in total cost. A break-even line puts the same idea another way, noting the transfer pays for itself once the interest it avoids passes the $96 fee.
The sheet is careful about the parts of an offer that bite. It flags that if the balance is not cleared before the promo period ends, the regular APR applies to whatever is left, which is why the Regular APR After Promo cell is the one to read twice. It notes that some cards apply a minimum transfer fee as well as a percentage, so the offer terms are worth checking. And it points out that both totals cover the same window, so a balance still outstanding at the end of it is not double-counted. The output is a comparison, not a recommendation: it tells you what one offer costs against leaving the balance where it is, and the numbers move the moment any input changes.
Watching the ratio: the Utilization Tracker
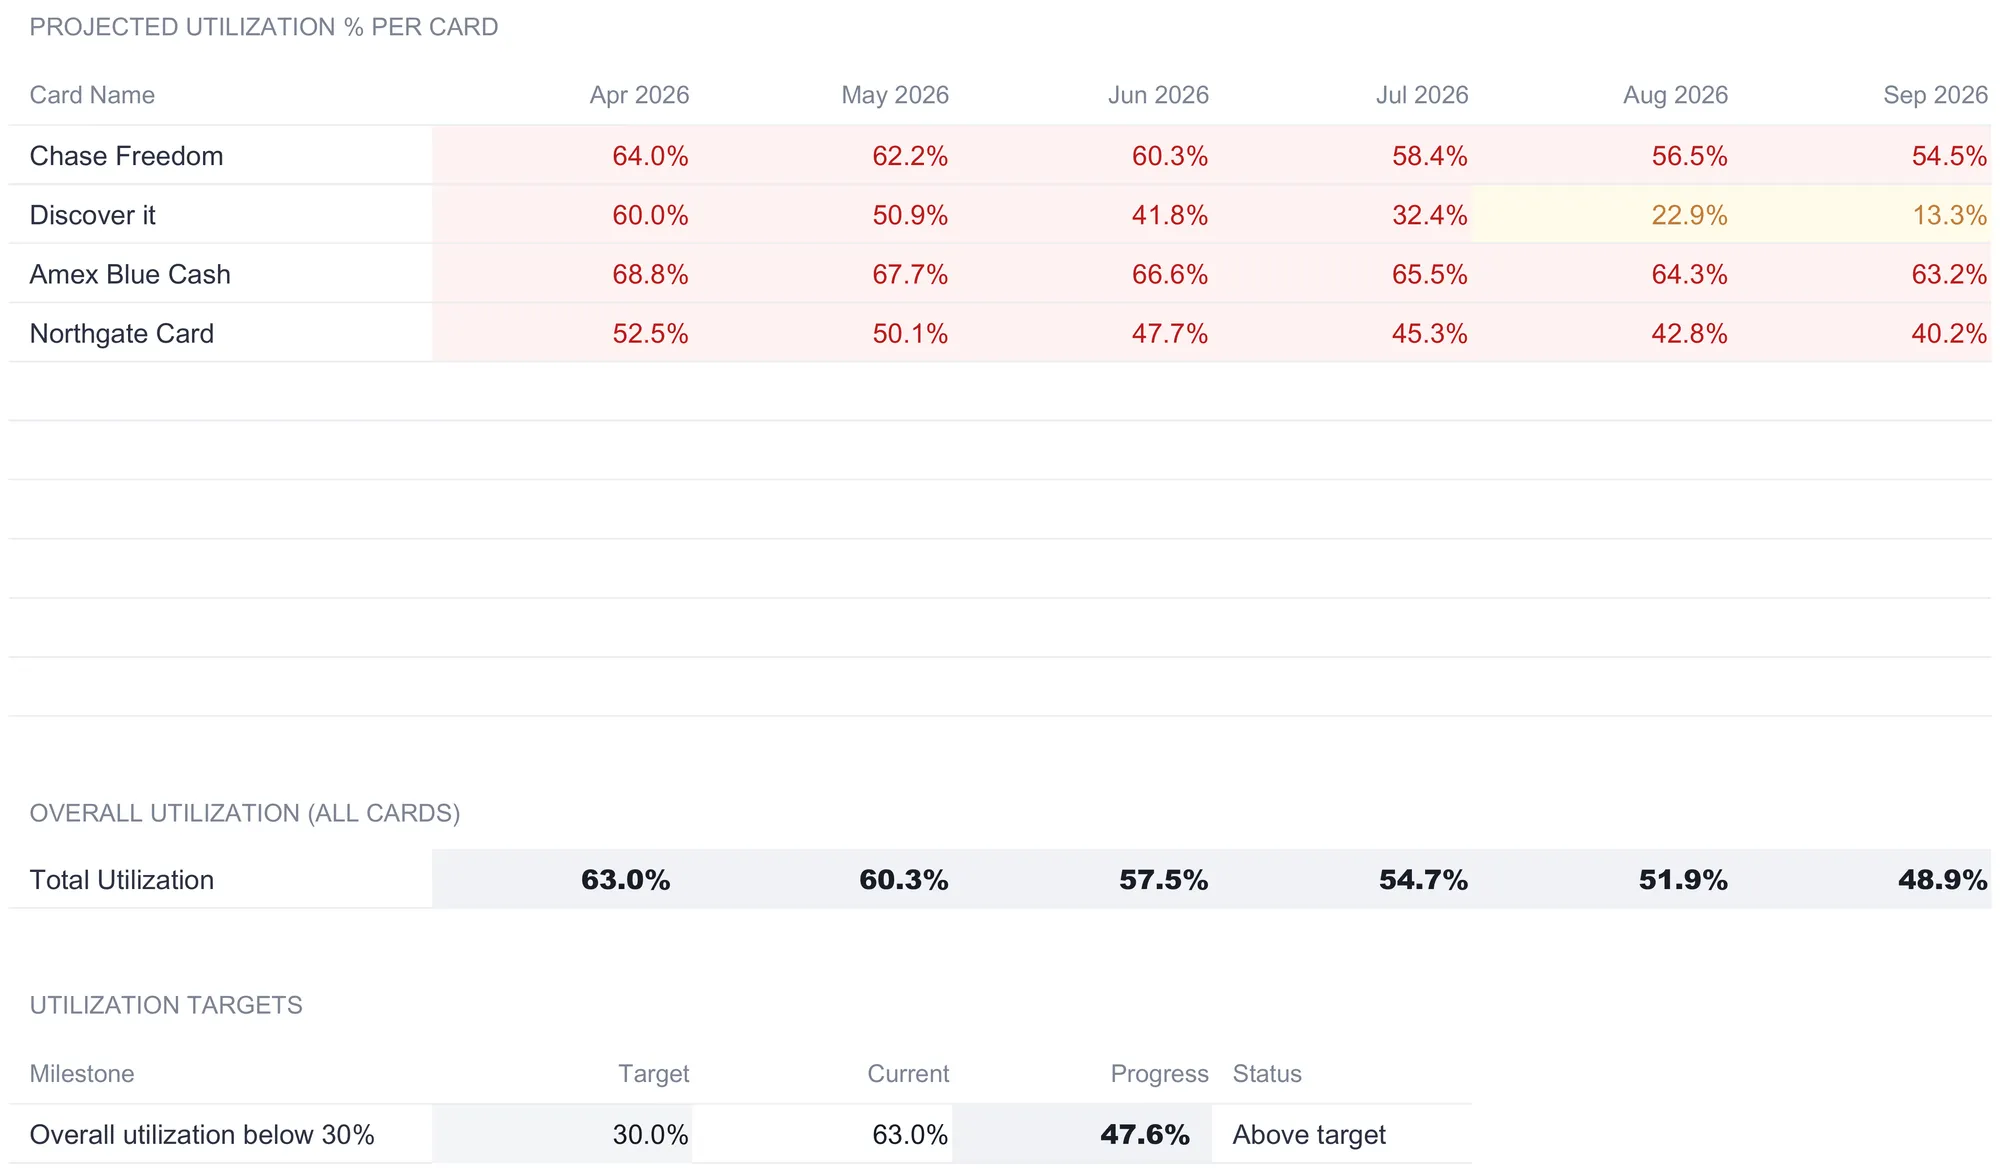
Card debt has a second dimension that installment loans do not, and it is the one a snowball schedule alone does not surface: utilization, the balance on a card set against that card’s limit. The Utilization Tracker projects it forward, reading the falling balances off the payoff schedule and turning each into a percentage of the limit, card by card, across the first six months of the plan.
| Card | Apr 2026 | May 2026 | Jun 2026 | Jul 2026 | Aug 2026 | Sep 2026 |
|---|---|---|---|---|---|---|
| Chase Freedom | 64.0% | 62.2% | 60.3% | 58.4% | 56.5% | 54.5% |
| Discover it | 60.0% | 50.9% | 41.8% | 32.4% | 22.9% | 13.3% |
| Amex Blue Cash | 68.8% | 67.7% | 66.6% | 65.5% | 64.3% | 63.2% |
| Northgate Card | 52.5% | 50.1% | 47.7% | 45.3% | 42.8% | 40.2% |
| Overall | 63.0% | 60.3% | 57.5% | 54.7% | 51.9% | 48.9% |
The shape of the snowball shows up here in a way the balance grid does not. The Discover it card, the first target, drops from 60 percent to 13.3 percent over the six months because it is absorbing the extra payment, while the Amex, last in the queue, barely moves from 68.8 to 63.2 because it is only paying its planned amount until its turn comes. Color coding makes the pattern legible at a glance: the sheet shades a cell red above 30 percent, amber between 10 and 30 percent, and green below 10 percent, so the Discover row is the one visibly cooling from red toward amber while the others stay red. Empty card slots stay blank.
Below the projection, a Utilization Targets table compares the live figures from Card Setup against fixed thresholds. The overall ratio gets two lines, one at 30 percent and one at 10 percent, and the first two card slots get a line each at 30 percent. In the sample all four lines read above target, since the overall 63 percent and both of those cards sit well over 30 percent at the start, and a Progress column shows how far each has to travel. The 30 percent line is not an arbitrary one: the CFPB notes that a credit utilization ratio is your total card balances divided by your credit limits, and that keeping it under 30 percent shows lenders you have available credit. The tracker states the same relationship the workbook computes, and the How to Use sheet adds a plain note that lower utilization tends to be reflected positively in credit scores. The sheet reports the ratio and its trajectory; what to do about either is left to the reader.
The Dashboard: six numbers and two charts
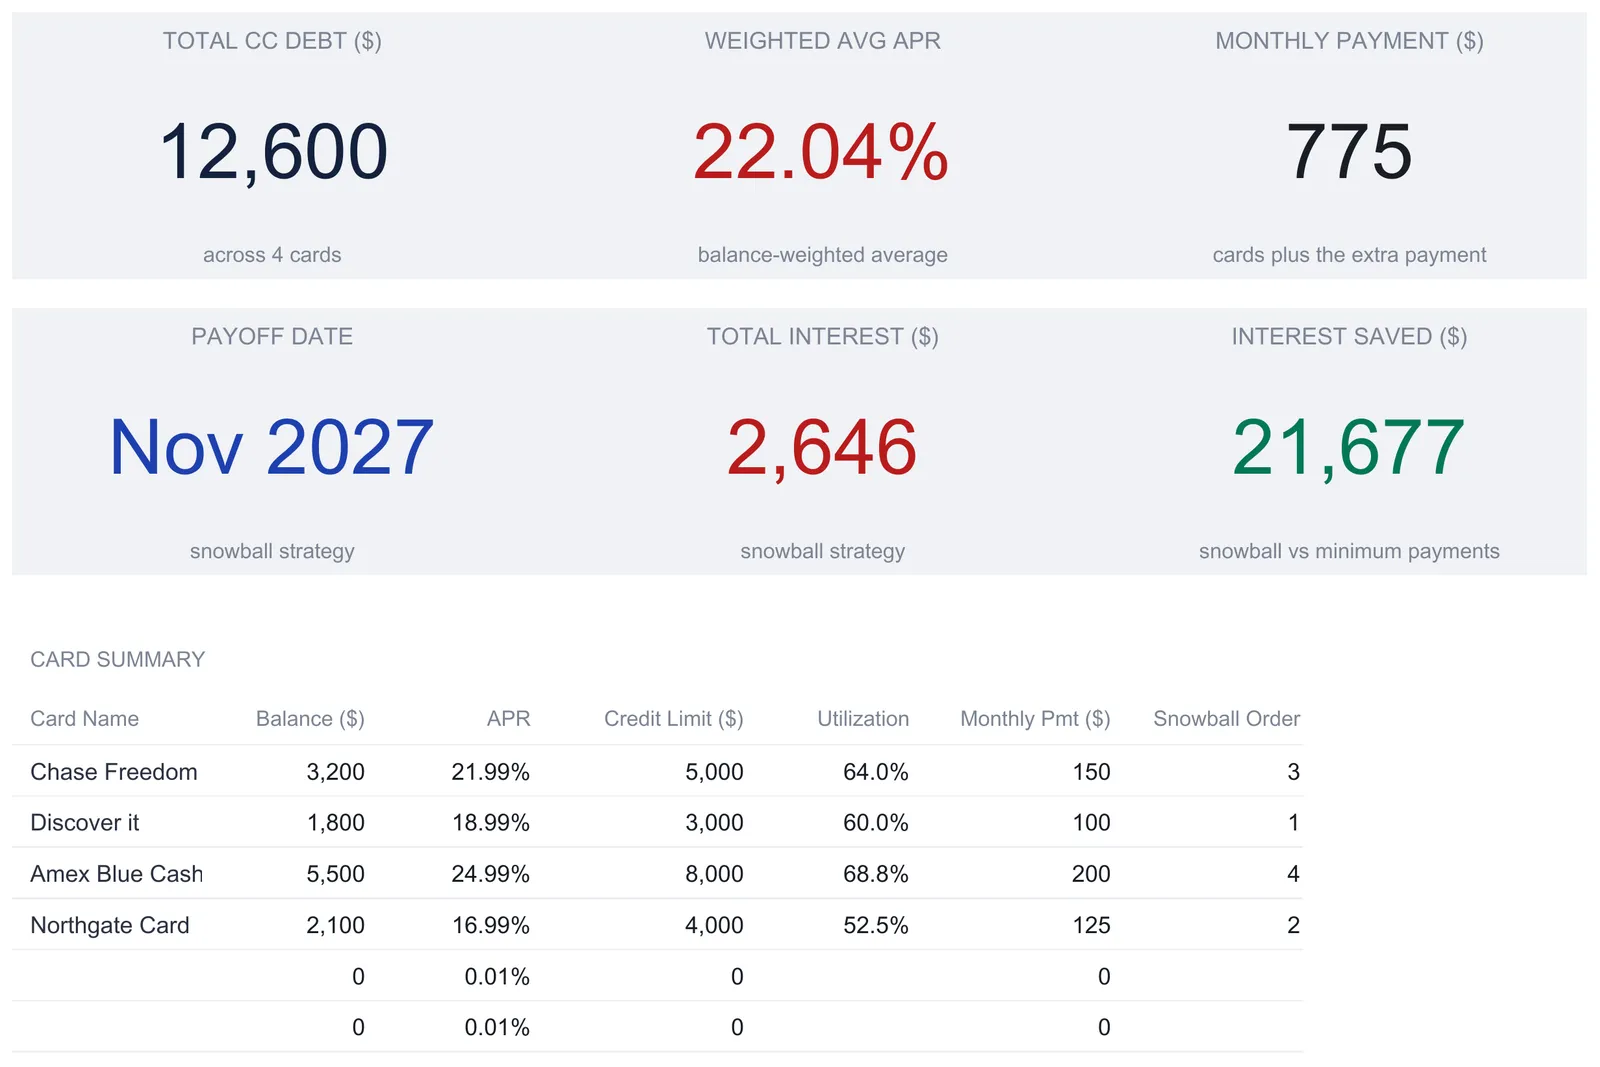
With the cards entered, the Dashboard, shown at the top of this article, states the plan in one screen. A line above the tiles summarizes it, reading “Snowball plan across 4 cards, at the payments entered” for the sample, and six KPI cards carry the headline figures:
| KPI | Sample value | What it means |
|---|---|---|
| Total CC Debt | $12,600 | Sum of all balances, across 4 cards |
| Weighted Avg APR | 22.04% | Balance-weighted blended rate |
| Monthly Payment | $775 | Planned card payments plus the extra |
| Payoff Date | Nov 2027 | When the last card clears under the snowball |
| Total Interest | $2,646 | Interest paid under the snowball |
| Interest Saved | $21,677 | Versus paying only the minimums |
The Payoff Date is the schedule’s length dropped onto the calendar: a 20-month plan starting in April 2026 finishes in November 2027, and if the cards cannot be cleared inside 120 months the tile reads “Beyond 120 months” instead. The pairing of Total Interest and Interest Saved answers two different questions, one the cost of the snowball itself and the other what that plan avoids against doing nothing extra, with the same floor caveat attached to the saving.
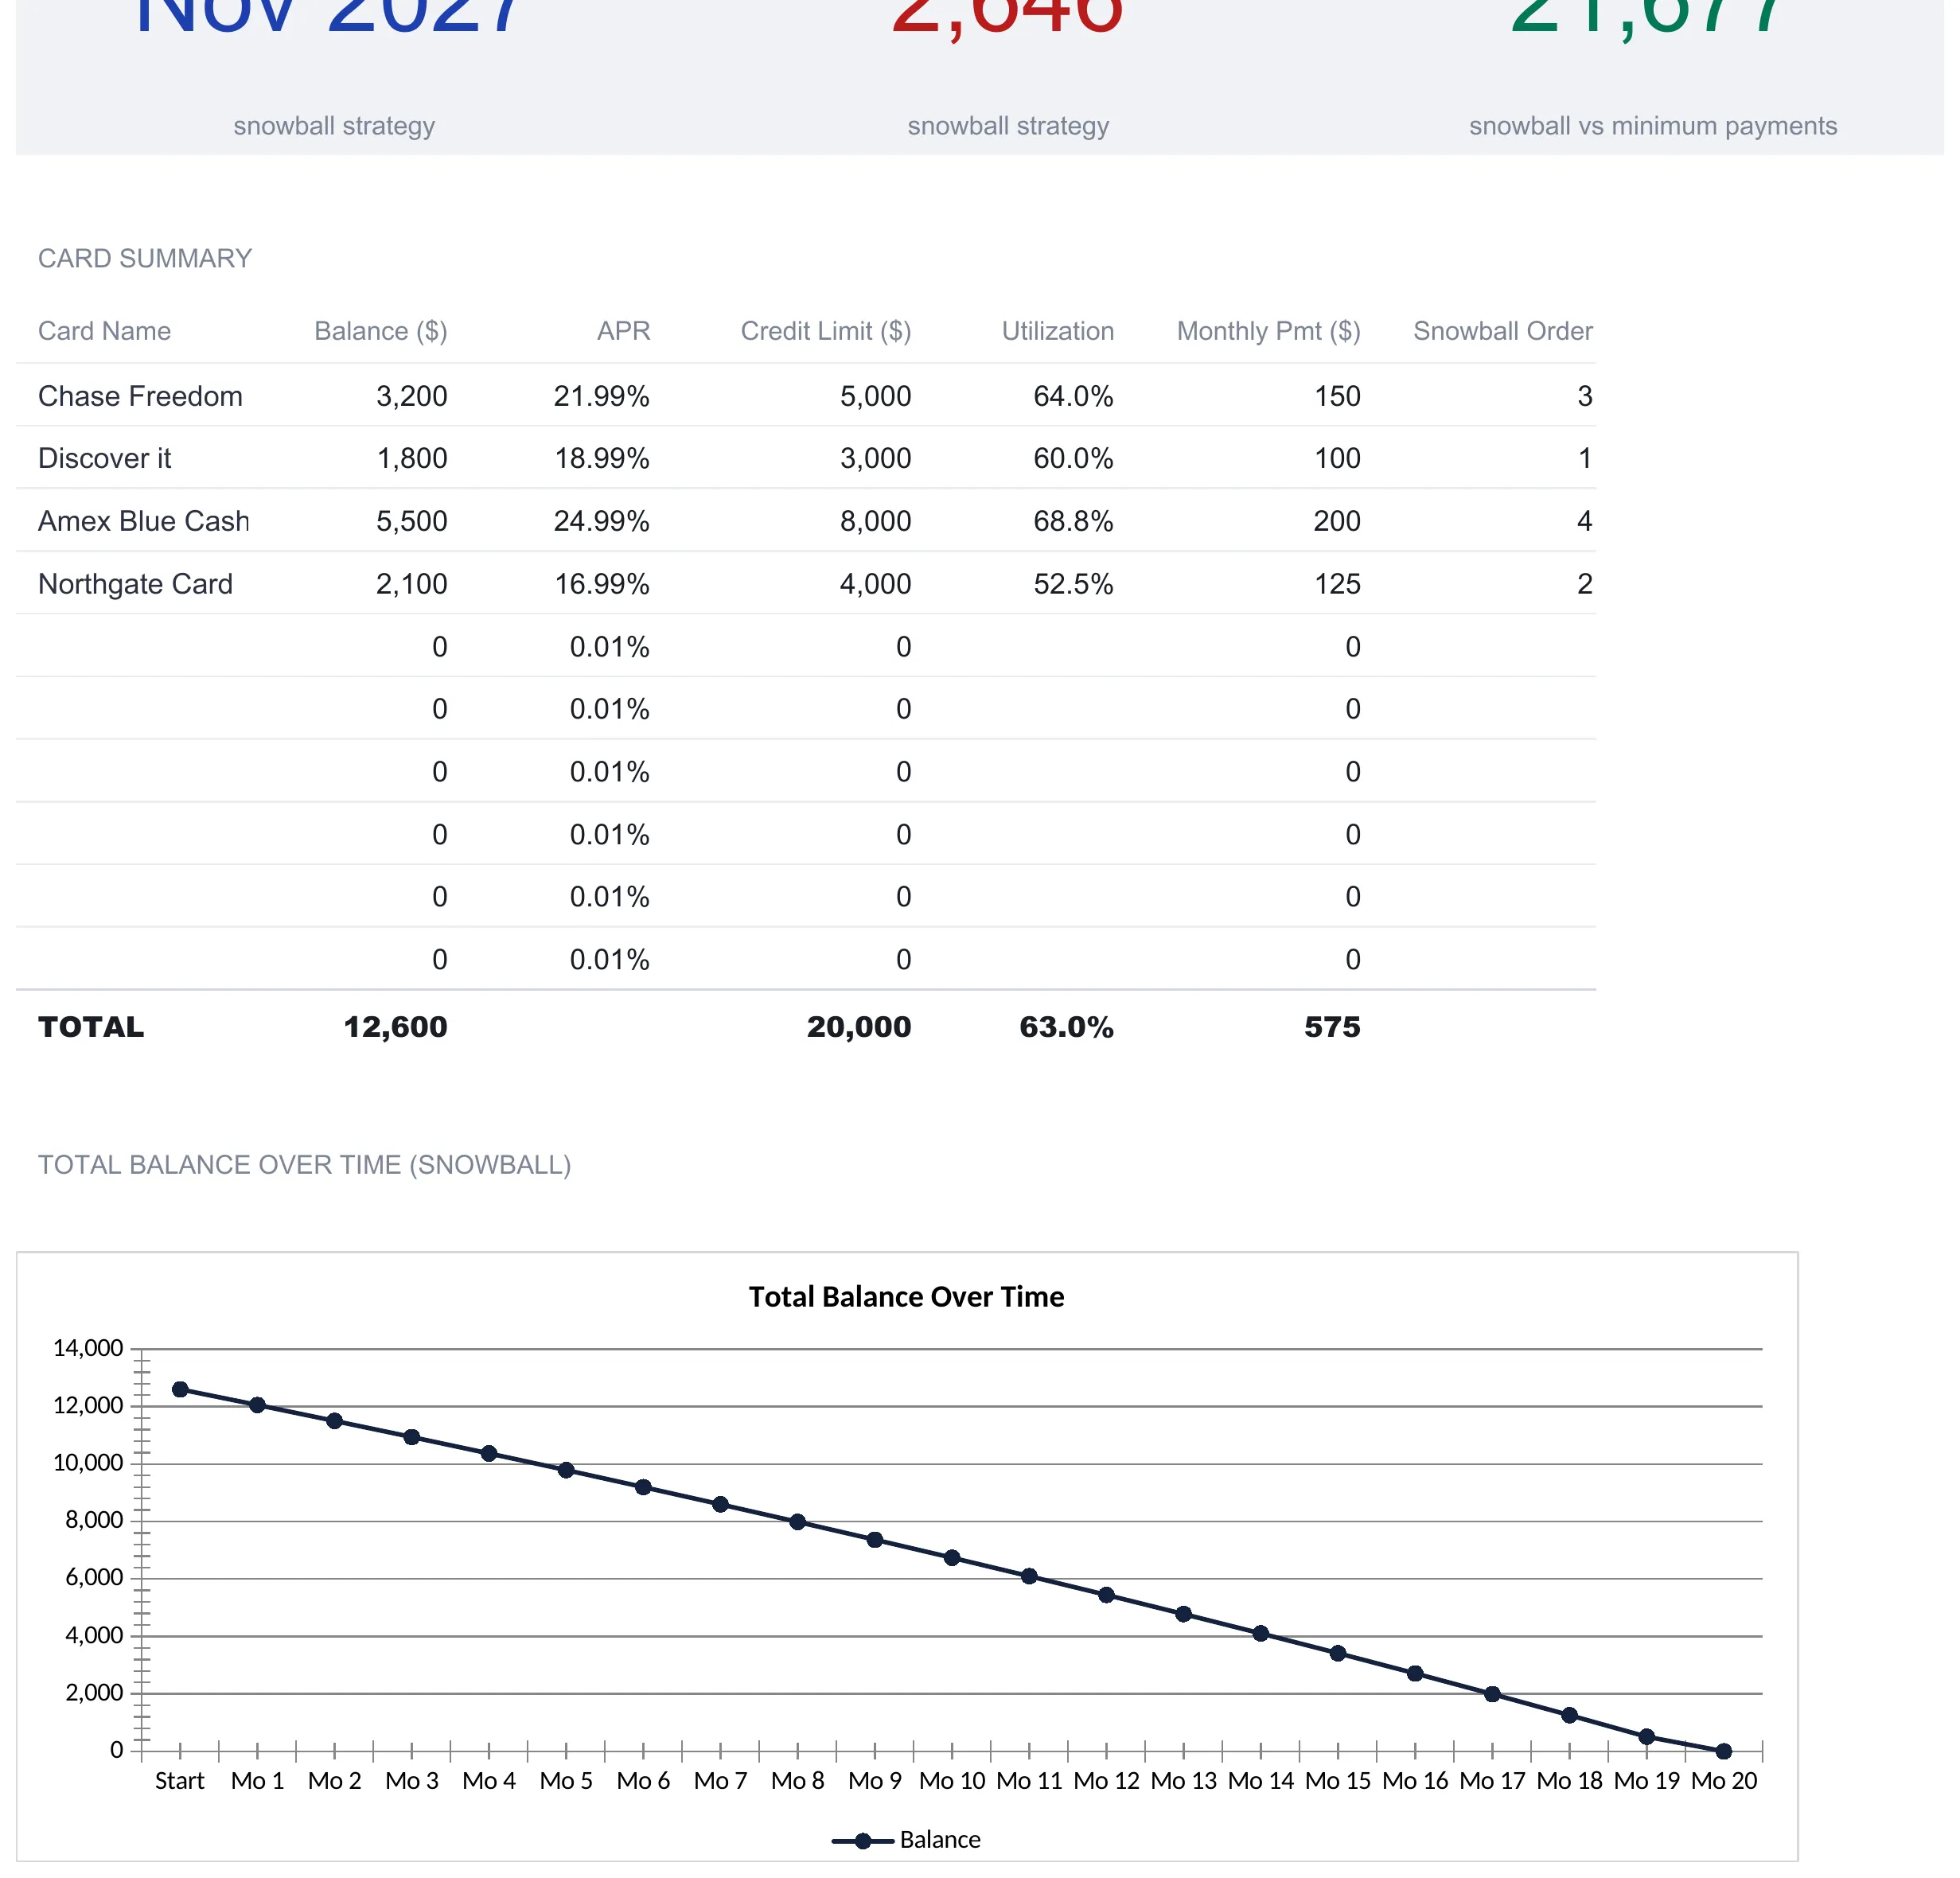
Below the cards, a Card Summary table lists every card slot with its balance, APR, limit, utilization, monthly payment, and its Snowball Order, and that order re-ranks itself from the balances beside it, so editing a balance moves the card in the queue on the spot. Two charts sit under the table. The first, “Total Balance Over Time,” plots the schedule’s running total as it falls from $12,600 to zero by month 20, and the second, “Balance by Card,” compares the current balances side by side. None of these outputs is typed. Every one recalculates from Card Setup, so nothing on the dashboard is a fixed example; change a balance, a rate, or the extra payment and the whole screen moves.
APR, utilization, and minimum payments in plain terms
Three ideas do most of the work in a credit card payoff spreadsheet, and it helps to keep them straight.
APR is the annual percentage rate the card charges, and it is how the schedule grows a balance each month. The CFPB explains that a daily periodic rate is generally used to calculate interest, found by dividing the APR by 360 or 365, and that interest compounds daily. The template works at the monthly level for a clean projection, applying a twelfth of the APR to each balance, which is why the Amex at 24.99 percent accrues more each month than the Northgate card at 16.99 percent even before any payment lands.
Utilization is the balance on a card divided by its credit limit, the ratio the tracker projects. It is the piece of the picture that a balance alone misses: a $2,000 balance on a $10,000 limit and the same $2,000 on a $2,500 limit are very different in utilization terms, and the template computes the ratio for each card and across all of them so the plan’s effect on it is visible.
The minimum payment is what the issuer requires, and in this template it is a comparison baseline rather than the plan. The schedule runs on the Monthly Payment column, the amount you plan to pay; the Min Payment column feeds only the minimum-only run that the interest-saved figure is measured against. Keeping the two apart is what lets the sheet show how much faster a plan clears the cards than the slow path of paying minimums alone.
Excel or Google Sheets for a credit card payoff spreadsheet
The template is an .xlsx file built on plain formulas, with no macros and no add-ons, so it runs the same way in Microsoft Excel and in Google Sheets after upload, and in LibreOffice Calc as well. A currency dropdown on the Dashboard relabels every money column and KPI across the workbook; it changes the label shown, not the underlying numbers, so it does not convert anything. Whichever program you prefer, the structure described here, a card list feeding a rolling schedule feeding a set of card-specific read-outs, is the same, and it is buildable by hand in either if you would rather assemble your own spreadsheet template than start from a finished one.
Which debt template fits
- Credit Card Payoff Ultimate Spreadsheet Template ($29) is the workbook this walkthrough follows: the card list, the rolling 120-month schedule, the three-way strategy comparison, the balance transfer model, and the utilization tracker, all driven by one extra-payment cell. There is also a free Credit Card Payoff template that handles one card on a single sheet, turning a balance, an APR, and a fixed monthly payment into months to payoff and total interest. An Essentials version ($19) sits between them, with the setup, schedule, and dashboard in the same family.
- Debt Snowball Ultimate Spreadsheet Template ($29) is the sibling for someone whose debts are a mix of cards, loans, and balances rather than mostly cards. It runs the same rolling snowball across any list of debts and adds milestone tracking and a what-if tester, but it leaves out the card-specific views this file carries, the balance transfer model and the utilization tracker. The debt snowball walkthrough covers it sheet by sheet.
Related
- Credit Card Payoff Calculator: See Your Payoff Date - the lighter calculator take on the same payoff-date question
- Debt Snowball vs. Debt Avalanche: Which Actually Works? - the strategy debate the comparison sheet lays out in numbers
- Debt Consolidation Calculator Spreadsheet - the other side of the balance-transfer question, rolling multiple balances into one
Frequently asked questions
How does the spreadsheet decide which card to pay off first?
The payoff schedule uses the snowball order, smallest balance first, ranked straight from the balances you type on the Card Setup sheet. In the sample that targets the $1,800 Discover it card ahead of the $5,500 Amex even though the Amex carries the higher rate. The Snowball Order column on the dashboard re-ranks itself whenever a balance changes, so the queue always follows the numbers rather than a fixed list.
What is the difference between the Min Payment and Monthly Payment columns?
They do two different jobs. Min Payment is what the issuer requires, and it only drives the minimum-only comparison the interest-saved figure measures against. Monthly Payment is what you plan to actually pay, and it is the figure the payoff schedule runs on. In the sample the four minimums total $252 while the planned monthly payments total $575, and the schedule uses the $575 plus the $200 extra.
Does the template compare the avalanche method as well as the snowball?
Yes. The Strategy Comparison sheet runs three orderings on the same cards and the same total outlay: snowball (smallest balance first), avalanche (highest APR first), and highest payment first. In the sample all three clear the cards in 20 months, but the avalanche and highest-payment orders each finish at $2,477 of interest against the snowball's $2,646, a difference the sheet lays out in one place.
How does the balance transfer sheet work out whether a transfer is worth it?
It models one offer from the figures you enter (the amount moved, a fee percentage, a promotional APR, how long the promo lasts, the rate afterward, and a monthly payment) and compares the total cost with and without the transfer over the same window. In the sample it computes a $96 fee on a $3,200 transfer against $480 of interest avoided, so the banner reads that the transfer works out $384 cheaper at the payment entered. A break-even line notes the fee is recovered once the interest avoided passes it.
What does the utilization tracker measure?
Utilization is the balance on a card divided by that card's credit limit, and the tracker projects it for each card across the first six months of the plan, reading the falling balances off the schedule. It also shows the overall figure across all cards, $12,600 against $20,000 of limits, which is 63 percent in the sample. A targets table flags the overall ratio against a 30 percent and a 10 percent threshold, and the first two card slots against 30 percent.
Sources
- What does it mean to pay off my credit card in full each month? - Consumer Financial Protection Bureau
- Credit score myths that might be holding you back from improving your credit - Consumer Financial Protection Bureau
About this article
Template sheets, inputs, figures, and formulas checked on 2026-09-10 against the shipped Credit Card Payoff Ultimate workbook (Dashboard, Card Setup, Payoff Schedule, Strategy Comparison, Balance Transfer, Utilization Tracker, How to Use tabs). The credit card interest and utilization definitions checked against the live Consumer Financial Protection Bureau pages at writing time. Last reviewed September 2026.