
Build it across three tabs: an Inputs sheet for your age, balances and assumptions; a Projections sheet that compounds each account year by year (ending balance equals last year's balance plus contributions, grown by the expected return, minus any withdrawals); and a Dashboard for charts and what-if scenarios. Run one row per year, layer in Social Security, pensions and one-time events, then stress-test a single assumption at a time. Every formula is written cell-by-cell below, or the $39 Retirement Financial Planning Projections template covers the same ground with one combined savings balance, pension income and a what-if panel already built.
In this article
- The three sheets a complete retirement plan needs
- Inputs that actually matter (and which are noise)
- The compound-growth formula written cell-by-cell
- The withdrawal-phase formula and how the 4 percent rule plugs in
- How to add Social Security, pensions, and one-time events
- A worked example: 35 year old, $80,000 income, retiring at 65
- Common mistakes and what to do instead
This is a long post. If you’d rather skip building from scratch, the Retirement Financial Planning Projections template ($39 once) arrives with its own projection already wired up. If you want to build it yourself, every section below is what to put in each cell.
The three sheets
A complete retirement plan in a spreadsheet needs three connected sheets. Calling them anything is fine; we use these names.
Inputs. All your assumptions and balances live here. Nothing on the other sheets gets edited; they read from Inputs. This means changing a single number (retirement age, expected return, contribution rate) re-runs the entire projection without breaking formulas.
Projections. A year-by-year grid covering accumulation (today through retirement) and withdrawal (retirement through end of plan). 40 rows for a 40-year plan, plus a row per account type.
Dashboard. Charts and summary numbers that read from Projections. End balance at retirement. Years of expenses covered. Probability of running out (if you add Monte Carlo, but a deterministic plan is fine for most people).
Three tabs, each does one thing, no formulas crossing back into Inputs. Keep it that way; the alternative is a fragile workbook that breaks the next time you tweak an assumption.
The Inputs sheet
The honest list of what matters. Sixteen cells.
| Cell | Label | Example value |
|---|---|---|
| B1 | Current age | 35 |
| B2 | Retirement age | 65 |
| B3 | End of plan age | 95 |
| B4 | Years to retirement | =B2-B1 |
| B5 | Years in retirement | =B3-B2 |
| B6 | Current balance: taxable | $20,000 |
| B7 | Current balance: tax-deferred (401k, trad IRA) | $80,000 |
| B8 | Current balance: Roth | $15,000 |
| B9 | Annual contribution: taxable | $5,000 |
| B10 | Annual contribution: tax-deferred | $19,500 |
| B11 | Annual contribution: Roth | $7,000 |
| B12 | Employer match | $4,000 |
| B13 | Expected return (real, after inflation) | 6 percent |
| B14 | Inflation rate | 3 percent |
| B15 | Annual retirement spending (today’s $) | $60,000 |
| B16 | Withdrawal rate | 4 percent |
Sixteen cells. That’s the entire input set. Everything else is calculated.
You’ll notice we separate accounts by tax treatment. Taxable, tax-deferred, and Roth grow the same way pre-retirement but withdraw differently. If you don’t want that level of detail, collapse them into one balance. The formulas are the same shape; the dashboard loses some nuance.
The Projections sheet
This is where the math happens. Rows are years; columns are account balances and totals.
Header row (row 1): Year, Age, Taxable Balance, Tax-Deferred Balance, Roth Balance, Total Balance, Annual Contribution, Annual Withdrawal.
Row 2 (year 0, today): Reads starting balances from Inputs.
- A2 = current year (e.g., 2026)
- B2 =
=Inputs!B1(current age) - C2 =
=Inputs!B6(taxable starting) - D2 =
=Inputs!B7(tax-deferred starting) - E2 =
=Inputs!B8(Roth starting) - F2 =
=C2+D2+E2 - G2 = 0
- H2 = 0
Row 3 (year 1): First year of projection.
- A3 =
=A2+1 - B3 =
=B2+1 - C3 =
=IF(B3<Inputs!$B$2, C2*(1+Inputs!$B$13)+Inputs!$B$9, IF(B3<Inputs!$B$3, C2*(1+Inputs!$B$13)-WithdrawalFromTaxable, 0))
That last formula is the meat. Translated: “If we’re still in accumulation (age below retirement age), grow last year’s balance by the expected return and add this year’s contribution. If we’re in retirement, grow last year’s balance by the expected return and subtract this year’s withdrawal from taxable. If we’re past end of plan, zero out.”
The same logic applies to D3 (tax-deferred) and E3 (Roth) with their own contribution and withdrawal cells. F3 sums them. G3 reports total contributions for the year. H3 reports total withdrawals.
Then drag rows 3 down to row 62 (or wherever year 60 lands). Forty plus years of projections, computed automatically.
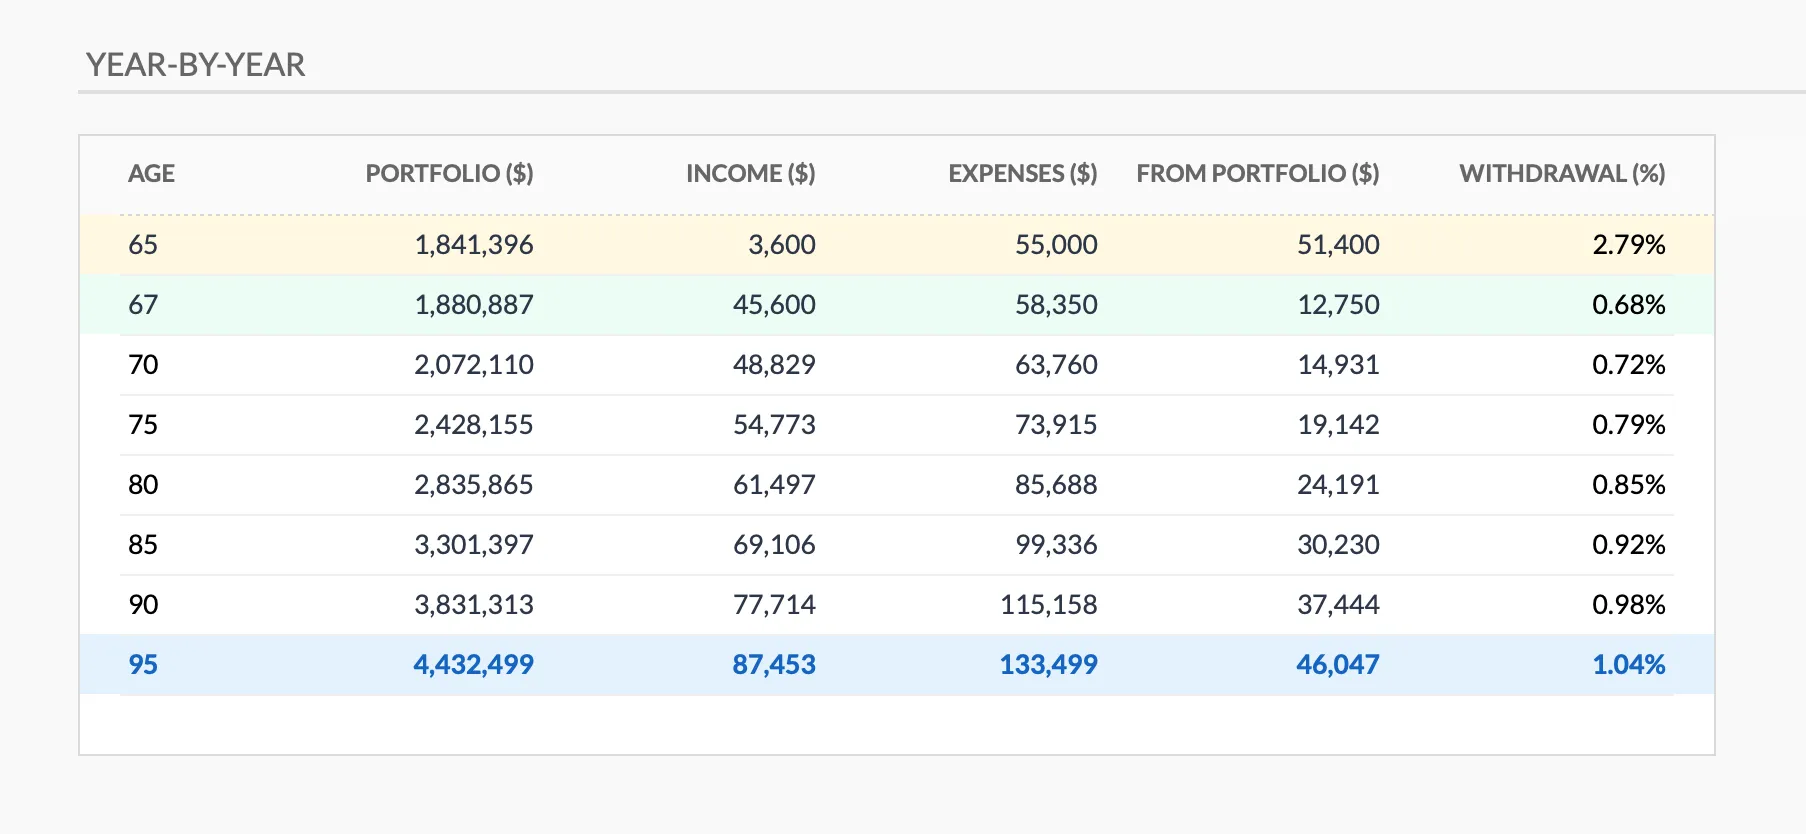
The year-by-year grid in the Premium Retirement Financial Planning Projections template. It runs from the retirement age to the life expectancy you enter (65 to 95 here), with income, expenses, the amount taken from the portfolio and the resulting withdrawal rate on each row.
The withdrawal formula
The 4 percent rule (or whatever rate you use) is just a starting withdrawal, and it also sets the portfolio target if you work backwards from spending, which is the FIRE number idea. Each year’s withdrawal is the prior year’s withdrawal grown by inflation:
Withdrawal_year_n = Withdrawal_year_n-1 * (1 + InflationRate)The first withdrawal is your target retirement spending (Inputs!B15). Each subsequent year grows by inflation.
So if your starting retirement spending is $60,000 in today’s dollars and inflation is 3 percent, year 1 of retirement withdraws $60,000, year 2 withdraws $61,800, year 3 withdraws $63,654, and so on.
In the Projections sheet, the Withdrawal cell (H column) for retirement years is:
=IF(B3>=Inputs!$B$2, IF(B3=Inputs!$B$2, Inputs!$B$15, H2*(1+Inputs!$B$14)), 0)“If retired and it’s the first retirement year, withdraw the target spending. If retired and not the first year, withdraw last year’s amount times one plus inflation. Otherwise zero.”
The order of withdrawals across account types matters for tax efficiency (taxable first, then tax-deferred, then Roth is the common rule). For a basic projection, you can pull from a combined balance and not worry about it. That is the route the Retirement Projections template takes: one combined savings balance, with tax drag handled through net-of-tax return assumptions rather than an account-by-account ordering rule.
Adding Social Security
Social Security is a stream of inflation-adjusted income starting at a chosen age. You can claim as early as 62 or as late as 70, with a permanently reduced benefit before full retirement age and delayed retirement credits after it. Adding it to the spreadsheet is one column.
Inputs additions:
- B17: Social Security claim age
- B18: Social Security annual benefit (in today’s dollars)
Projections sheet new column (I):
- I3 =
=IF(B3>=Inputs!$B$17, Inputs!$B$18*(1+Inputs!$B$14)^(B3-Inputs!$B$17), 0)
That column shows your annual Social Security income, growing with inflation from the claim year forward.
Then update the withdrawal formula in H to subtract Social Security from required spending:
H3 = max(0, target_spending_for_year - I3)Effect: Social Security covers part of your retirement spending; you draw down portfolio balances only for the gap.
Adding pensions
Same approach. One input cell for pension annual benefit (in today’s dollars), one input for pension start age, one column on Projections sheet that calculates current-year pension income, and an adjustment to the withdrawal formula.
For inflation-adjusted pensions (rare in private sector, common in some public plans), the formula uses (1+InflationRate)^years. For non-inflation-adjusted pensions, the benefit is constant in nominal dollars, which means it loses purchasing power over time. The spreadsheet should reflect that; otherwise you’ll overestimate your future income.
Adding one-time events
Inheritances, home sales, college costs, healthcare emergencies. Treat each as a one-time inflow or outflow on a specific year.
Inputs: A small table with Event Name, Year, Amount (positive for inflow, negative for outflow).
Projections: A new column that looks up the event for each year and adds it to the appropriate balance.
A common one: a $400,000 home sale at age 70 with proceeds rolling into taxable. That’s a single-cell event on the Inputs table; the Projections sheet handles it via lookup.
A worked example
Maya is 35. She’s working in tech, earning $130,000.
Inputs:
- Current age: 35
- Retirement age: 65
- End of plan age: 95
- Taxable balance: $25,000
- Tax-deferred (401k): $95,000
- Roth IRA: $18,000
- Annual contributions: $6,000 taxable, $19,500 tax-deferred, $7,000 Roth
- Employer match: $5,000 (added to tax-deferred)
- Expected real return: 6 percent
- Inflation: 3 percent
- Annual retirement spending: $70,000 (today’s dollars)
- Withdrawal rate: 4 percent
- Social Security: $36,000 starting at 67
Projection result at age 65:
| Account | Balance (today’s $) |
|---|---|
| Taxable | $476,000 |
| Tax-deferred | $1,975,000 |
| Roth | $580,000 |
| Total | $3,031,000 |
Years of expenses covered: 43 years at $70,000/yr (with inflation), assuming 6 percent real continued growth and Social Security from 67. Plan succeeds well past age 95.
What happens if return drops to 4 percent real? Total at 65 falls to $2,180,000. Years covered drops to 31. Plan still reaches mid-90s. Tight but not failed.
What happens if she retires at 60 instead? Total at 60 is $2,290,000. Years covered drops to 35 because she has 5 fewer years of accumulation and 5 more years of withdrawal. Plan reaches mid-90s. Still works.
These three “what if” scenarios are the main reason to have the spreadsheet. The base case answer is rarely the interesting one; the sensitivity to one or two changes is what informs decisions.
Common mistakes
Mixing nominal and real returns. Pick one. Real returns (after inflation) with target spending in today’s dollars is the cleaner approach because the withdrawals stay constant in real terms. Nominal returns with inflation-adjusted withdrawals also works but is harder to read.
Assuming the same return rate for all account types. Fine for a base case. If you have a conservative bond-heavy taxable account and an aggressive stock-heavy retirement account, separate the assumptions; the projection changes meaningfully.
Forgetting the employer match. Free money that compounds for 30 years. Don’t leave it out.
Using too high a return assumption. 7 percent real is the long-run US stock market average; 10 percent nominal. Many people plug in 10 percent real, which produces a fantasy projection. Stick with 5 to 7 percent real for a base case; run a 4 percent scenario for a stress test.
Ignoring sequence-of-returns risk. The deterministic projection assumes a smooth return. Real markets aren’t smooth. A bad first decade in retirement is more damaging than a bad last decade because there’s less balance to recover from. The spreadsheet won’t capture this; only Monte Carlo will. Running a “what if 4 percent return” scenario is a reasonable stand-in stress test, and the ProjectionLab alternative walkthrough shows how to keep even a deterministic projection auditable.
No spending update over time. People assume spending in retirement equals spending now. For most retirees, real spending is lower in 70s and 80s than in 60s (less travel, fewer big purchases) but spikes in late life (healthcare). A constant-spending model is approximate; a phased model is more accurate.
Sensitivity analysis
The most useful pages of the dashboard show what changes when one input moves.
Retirement age: Each year of delay adds roughly 6 to 8 percent to your end balance and reduces required portfolio by 5 percent. Massive lever for late savers.
Savings rate: Each percentage point of income saved adds about 6 percent to retirement balance over a 30-year horizon.
Return assumption: Each 1 percentage point change in real return moves the end balance by 25 to 30 percent. The single biggest uncertainty in any projection.
Spending in retirement: Each $5,000 of annual spending requires roughly $125,000 more in portfolio (4 percent rule). A 10 percent reduction in retirement spending often closes a tighter plan.
On a dashboard these read best as scenario columns. The Retirement Projections template compares three of them (conservative, base case, optimistic) built off the same inputs, and adds a panel of single-change what-ifs.
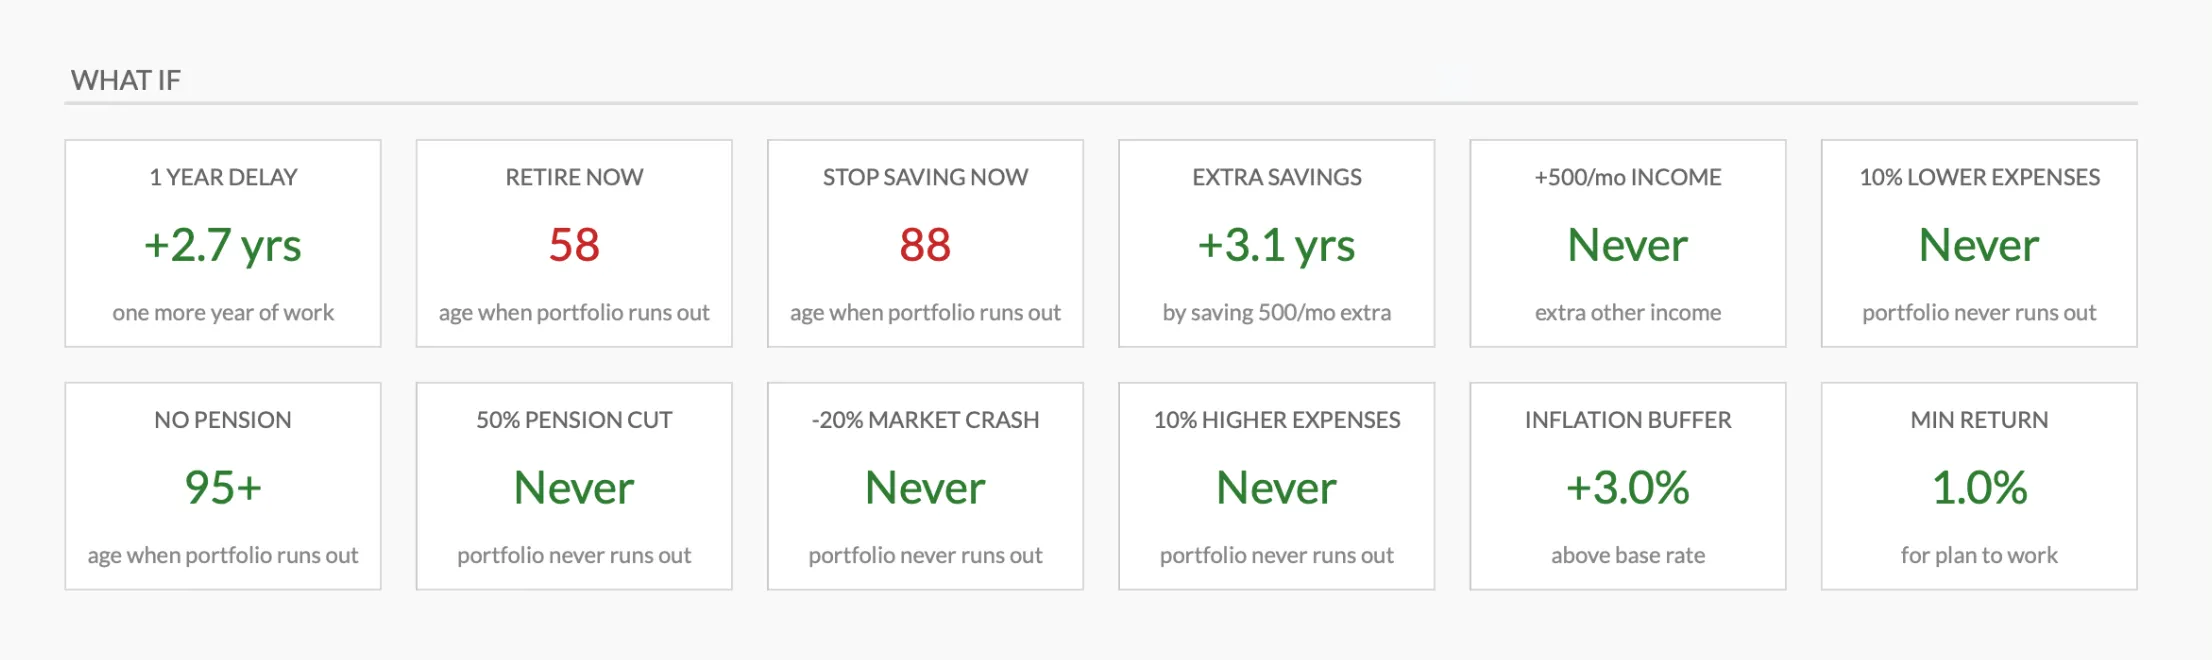
The what-if panel in the Premium Retirement Financial Planning Projections template. Each tile is a single-input change (delay a year, cut the pension, drop returns) so the sensitivity of the plan reads at a glance.
If you want a quick base-case number before building the full grid, this calculator runs the same accumulation-then-withdrawal logic in the browser:
Where to go next
Two ways to skip the cell-by-cell build:
- Retirement Financial Planning Projections ($39 once) - a Google Sheets projection running from your current age to the life expectancy you set, with configurable assumptions, three scenarios, the what-if panel and the savings milestones already wired in.
- Retirement Planning Bundle - Retirement Projections plus the Net Worth Tracker and Annual Tax Planner, for pairing the drawdown with the tax side.
Prefer to keep experimenting first? Run the base case in the Retirement Calculator embedded above, then rebuild it in your own sheet using the formulas in this guide.
Related
- Coast FIRE Calculator Explained: Formula and Three Worked Examples
- ProjectionLab Alternative: Retirement Projections in a Spreadsheet You Can Audit
- FIRE Calculator: Find Your Financial Independence Number
- Best FIRE Calculators and Spreadsheets Compared
- When Can I Retire? Calculator Plus Rule of Thumb
- Financial Independence Spreadsheet: 5 Options Ranked
Frequently asked questions
Should I build it from scratch or buy a template?
If you enjoy spreadsheet building and want to learn the math, building from scratch gets you most of the way there with the walkthrough above. If you want a working tool tonight, the $39 Retirement Financial Planning Projections template arrives already built, though it runs on a single combined savings balance rather than the per-account split above.
Does the spreadsheet handle Roth conversions?
A basic year-by-year projection doesn't model conversions on its own. Roth conversion planning is its own layer of complexity (tax-bracket management, IRMAA thresholds, ACA subsidy cliffs for early retirees), which is why it usually lives alongside a tax planner rather than inside the core projection.
What return rate is realistic to plug in?
A common range is 6 to 7 percent real for a stock-heavy portfolio, 4 to 5 percent real for a balanced 60/40 mix, and 2 to 3 percent real for a conservative bond-heavy allocation. Worth matching the rate to your actual allocation rather than the highest number the market has ever returned.
How often is the projection worth updating?
Once a year covers most situations. Within 5 years of retirement, some people revisit it quarterly. Monthly tends to be too often, because short-term market noise dominates the signal in a 40-year projection.
Can the spreadsheet model early retirement (FIRE)?
Yes. Set the retirement age to 50, 45, or whatever the target is, and the withdrawal phase covers the gap until penalty-free retirement-account access opens at 59.5. For a dedicated tool, the [FIRE Calculator](@route:templates.product:retirement:fire-financial-freedom-calculator) is free, and the paid Retirement Projections template carries the full year-by-year drawdown.
Can I build the same projection in Excel instead of Google Sheets?
Yes. Every formula shown here (IF, cross-sheet references with absolute ranges, the compound-growth expression) works the same in Excel. The main difference is that Google Sheets shares and version-controls in the browser, while Excel keeps the file local. The Retirement Financial Planning Projections template is built for Google Sheets.
Does the projection account for taxes on withdrawals?
The core deterministic model tracks gross balances by account type but doesn't apply a tax rate to each withdrawal. Adding taxes means estimating an effective rate per account (tax-deferred withdrawals as ordinary income, Roth tax-free, taxable at capital-gains rates) and grossing up the withdrawal to cover it. That is where separating accounts by tax treatment on the Inputs sheet earns its keep.
Sources
- Retirement Benefits: Starting Your Benefits Early or Late - Social Security Administration
- Topic no. 557, Additional tax on early distributions from traditional and Roth IRAs - Internal Revenue Service
About this article
Template price, tabs, inputs and outputs checked on 2026-09-10 against the shipped Retirement Financial Planning Projections Google Sheet (Summary, Inputs, Projections, Helpers, Instructions tabs) and the site's product data. Social Security claiming ages and the 59.5 early-distribution threshold checked against SSA.gov and IRS.gov. Last reviewed September 2026.