
Five specific, measurable financial goals for 2026: build a starter emergency fund, track every expense for 90 days, audit your subscriptions, calculate your personal savings rate, and calculate your net worth. Each one is built around visibility, seeing where your money actually goes, rather than prescribing what to do with it.
Every January, millions of people write down financial resolutions. By February, most have abandoned them. According to Motley Fool’s 2025 Financial New Year’s Resolution Report, only 27% of Americans stuck to their financial resolutions last year.
The problem usually isn’t motivation - it’s vagueness. “Save more money” isn’t a goal. It’s a wish.
What follows are five goals that many people find useful because they’re specific, measurable, and focused on visibility rather than prescription. These aren’t recommendations for what you ought to do - they’re examples of what clarity-focused financial goals can look like. If you’re setting intentions for the new year, our take on why 2026 is a good year to get your finances in order covers the mindset; these five goals are the concrete, trackable version of it.
1. Build a Starter Emergency Fund
This goal means setting aside enough to cover one to three months of essential expenses - rent, utilities, food, insurance, minimum debt payments. Not a full six-month cushion right away, just enough to handle a car repair or unexpected bill without derailing everything else.
According to Empower’s 2025 research, the median emergency savings for Americans is $500. One in three adults has no emergency savings at all. And Bankrate reports that 59% couldn’t cover a $1,000 unexpected expense without going into debt. An emergency fund creates a buffer between normal life and crisis mode. Vanguard research found that people with at least $2,000 in emergency savings reported 34% higher financial well-being scores - though correlation isn’t causation, and individual circumstances vary widely.
Some people calculate their monthly essential expenses, set a target amount, and track progress in a spreadsheet or savings tracker. The specific approach varies based on individual preferences. An Emergency Fund Calculator can help estimate how much might be needed based on monthly expenses.
2. Track Every Expense for 90 Days
This means recording every transaction (every coffee, every subscription, every purchase) for three months. The goal isn’t to change behavior during that period, just to observe it. What patterns emerge when you actually see where money goes?
Most people underestimate their spending. C+R Research found that consumers estimated they spent an average of $86/month on subscriptions. The actual number when itemized? $219 - more than 2.5 times higher. Tracking expenses doesn’t require changing anything. It’s purely observational. That visibility often reveals patterns: services forgotten about, small purchases that accumulate, categories where spending differs from expectations.
Methods vary - spreadsheets, apps, notebooks. Some people find it helpful to commit to a specific timeframe (like 90 days) and focus purely on observation rather than behavior change during that period. A dedicated expense tracker can simplify this: each transaction takes a category from a dropdown, and the Summary tab totals every category with its share of the month. And if you’d rather build your own, our guide to an advanced personal finance tracker in Google Sheets walks through the setup. Consistency matters for this kind of tracking - gaps in the data reduce its usefulness.
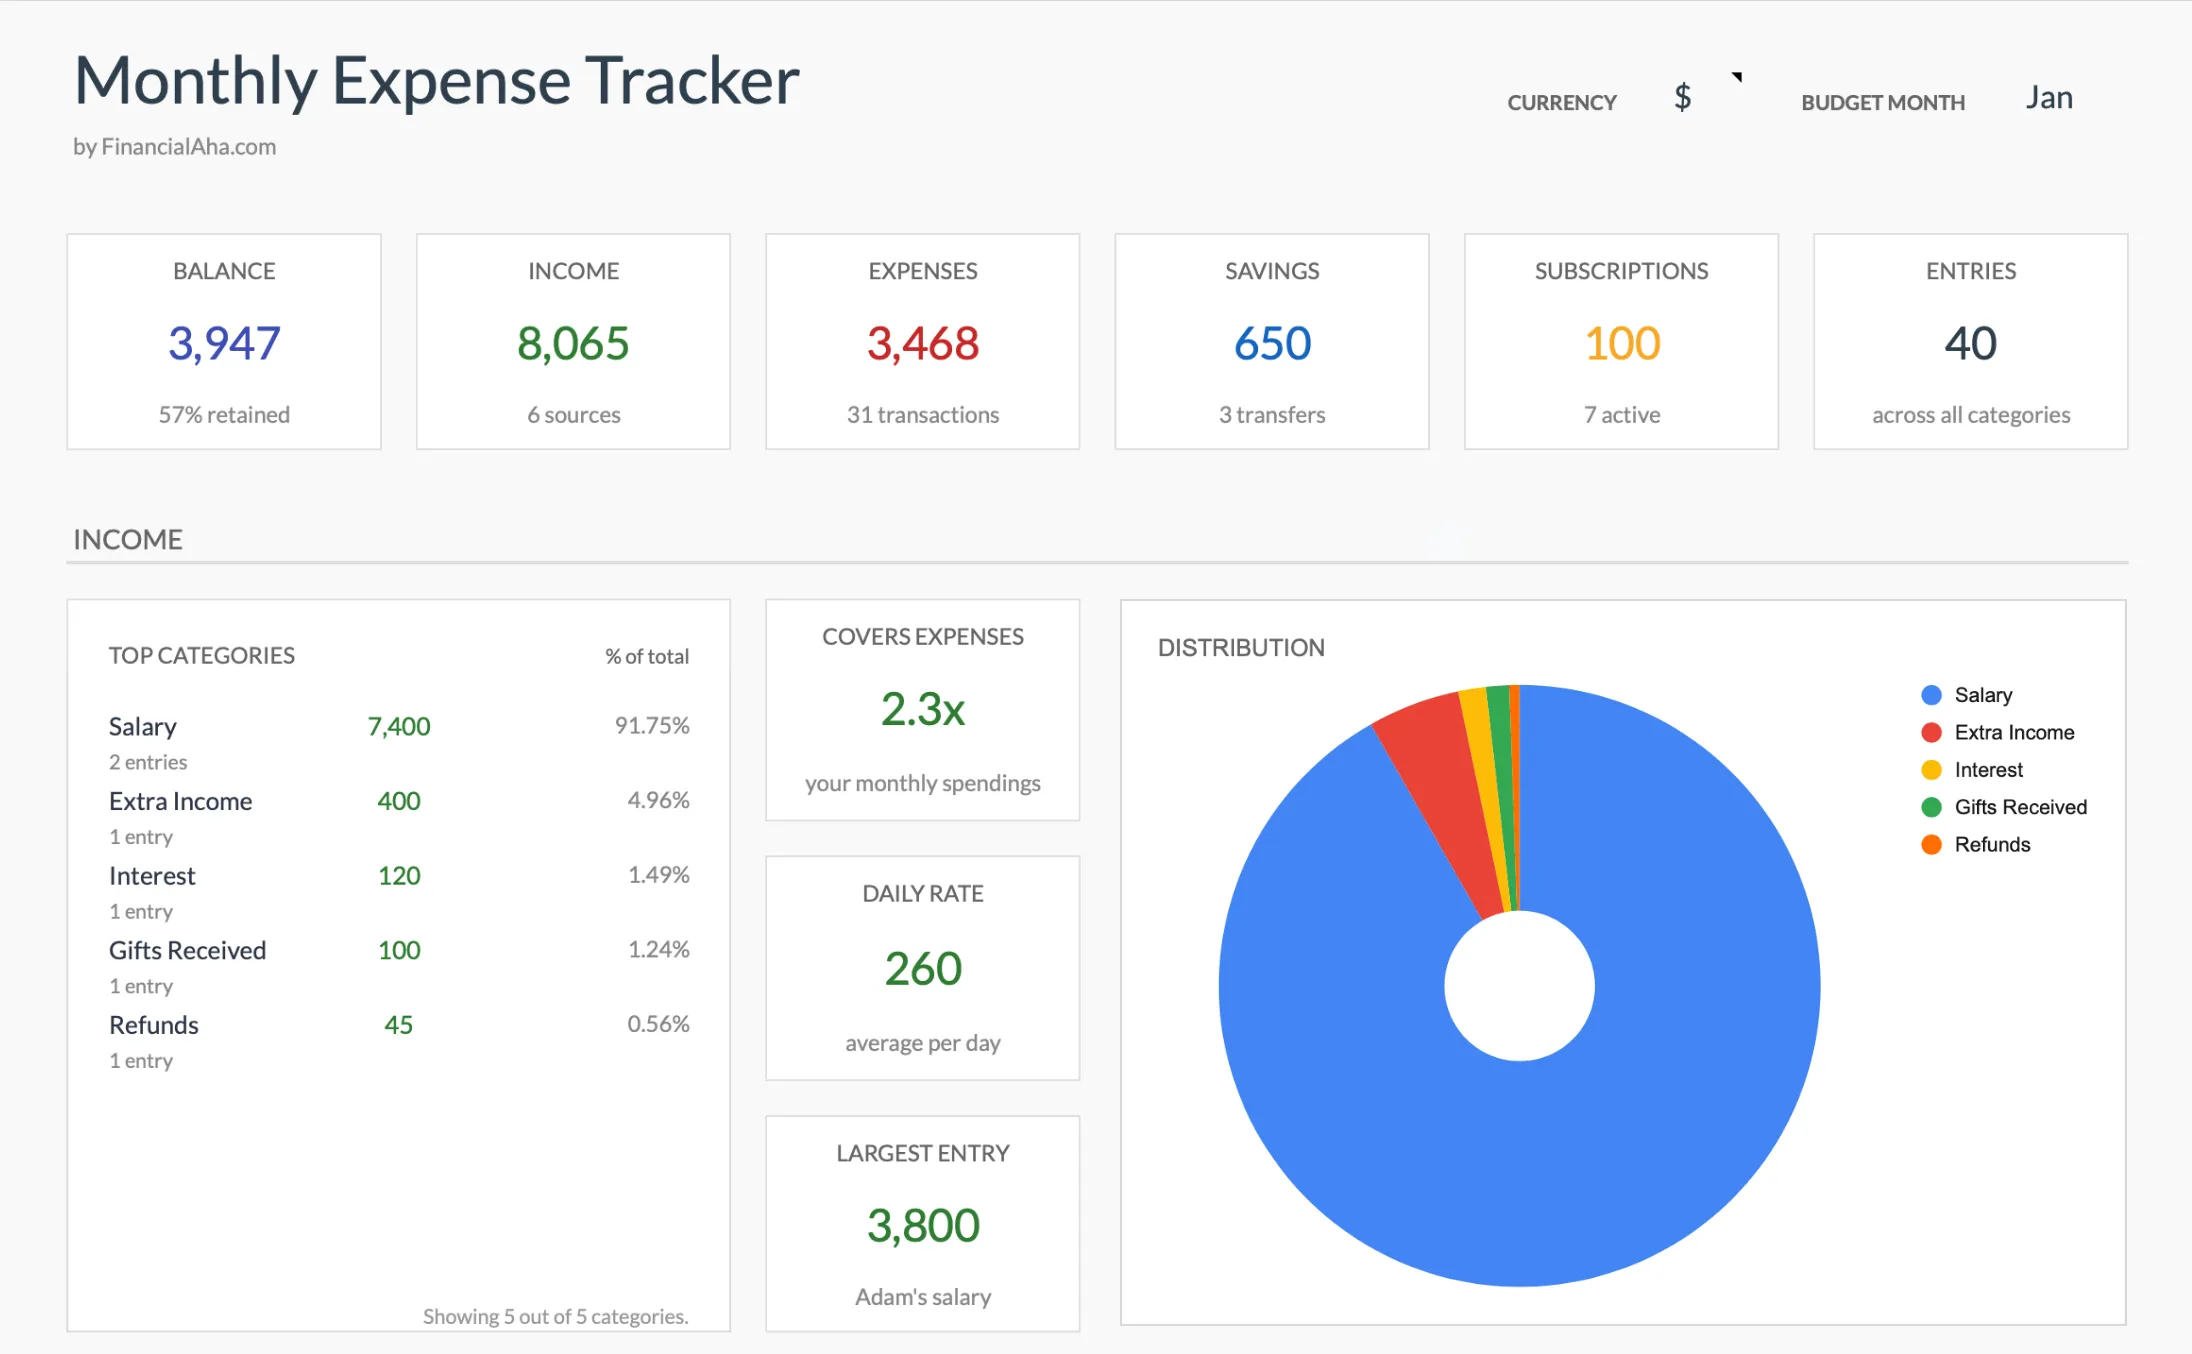 The Premium Monthly Expense Tracker covers one month at a time, so a 90-day run means starting a fresh month three times. Each month lands on a single dashboard with balance, income, expenses, savings, a count of active subscriptions, and the entry total.
3. Audit Subscriptions
A subscription audit means reviewing bank and credit card statements to identify every recurring charge, then evaluating which ones still provide value. It’s a one-time exercise that many people find revealing.
According to 2025 subscription economy data, the average consumer holds 5.6 active subscriptions. And C+R Research reports that 42% of people admit they’re paying for subscriptions they no longer use. Subscription creep happens gradually. Each individual charge may seem small. Research suggests 74% of consumers underestimate their total subscription spending. A periodic audit brings visibility to what can become a blind spot.
Some people pull statements from the past few months and list every recurring charge, noting which services they actually used. For streaming services, checking the last login date can be informative. An audit is about information, not necessarily cancellation - subscriptions that provide genuine value may be worth keeping. The point is having visibility into what’s being paid for.
4. Calculate a Personal Savings Rate
This goal involves calculating what percentage of income goes toward savings, whether in savings accounts, retirement funds, or investments, and observing how it changes over time. It’s a single number that captures the gap between income and spending.
The U.S. personal saving rate was 2.7% in June 2026, according to the Bureau of Economic Analysis. That’s down sharply from the pandemic highs of 2020-2021, when reduced spending pushed the rate above 30%. Some people find this number useful for understanding their financial patterns - though what constitutes an appropriate rate varies enormously based on income, expenses, life stage, and individual circumstances. There’s no universally “correct” savings rate.
The basic formula: monthly savings divided by monthly take-home pay, multiplied by 100. Some people track this monthly to observe patterns. If tracking full category detail feels like too much, a minimalist budget leans on this one savings-rate number and lets the rest flex. The number naturally fluctuates with seasonal spending, large purchases, and unexpected expenses. A Savings Calculator works on what happens next, projecting how a monthly contribution grows over time at a given rate. What matters more than any single month is the trend over time.
5. Calculate Net Worth
Net worth is simply assets minus liabilities. Add up everything you own (bank accounts, investments, property, vehicles) and subtract everything you owe (mortgage, car loans, credit cards, student loans). The result is a single number that represents your overall financial position.
While monthly budgets capture the flow of money, net worth captures accumulation - the result of financial decisions over time. It’s a different lens on the same picture. Tracking net worth over time can show whether the overall trend is moving in a particular direction. A negative net worth isn’t inherently problematic - many people begin adulthood with student debt. The value is in understanding the current position and observing changes.
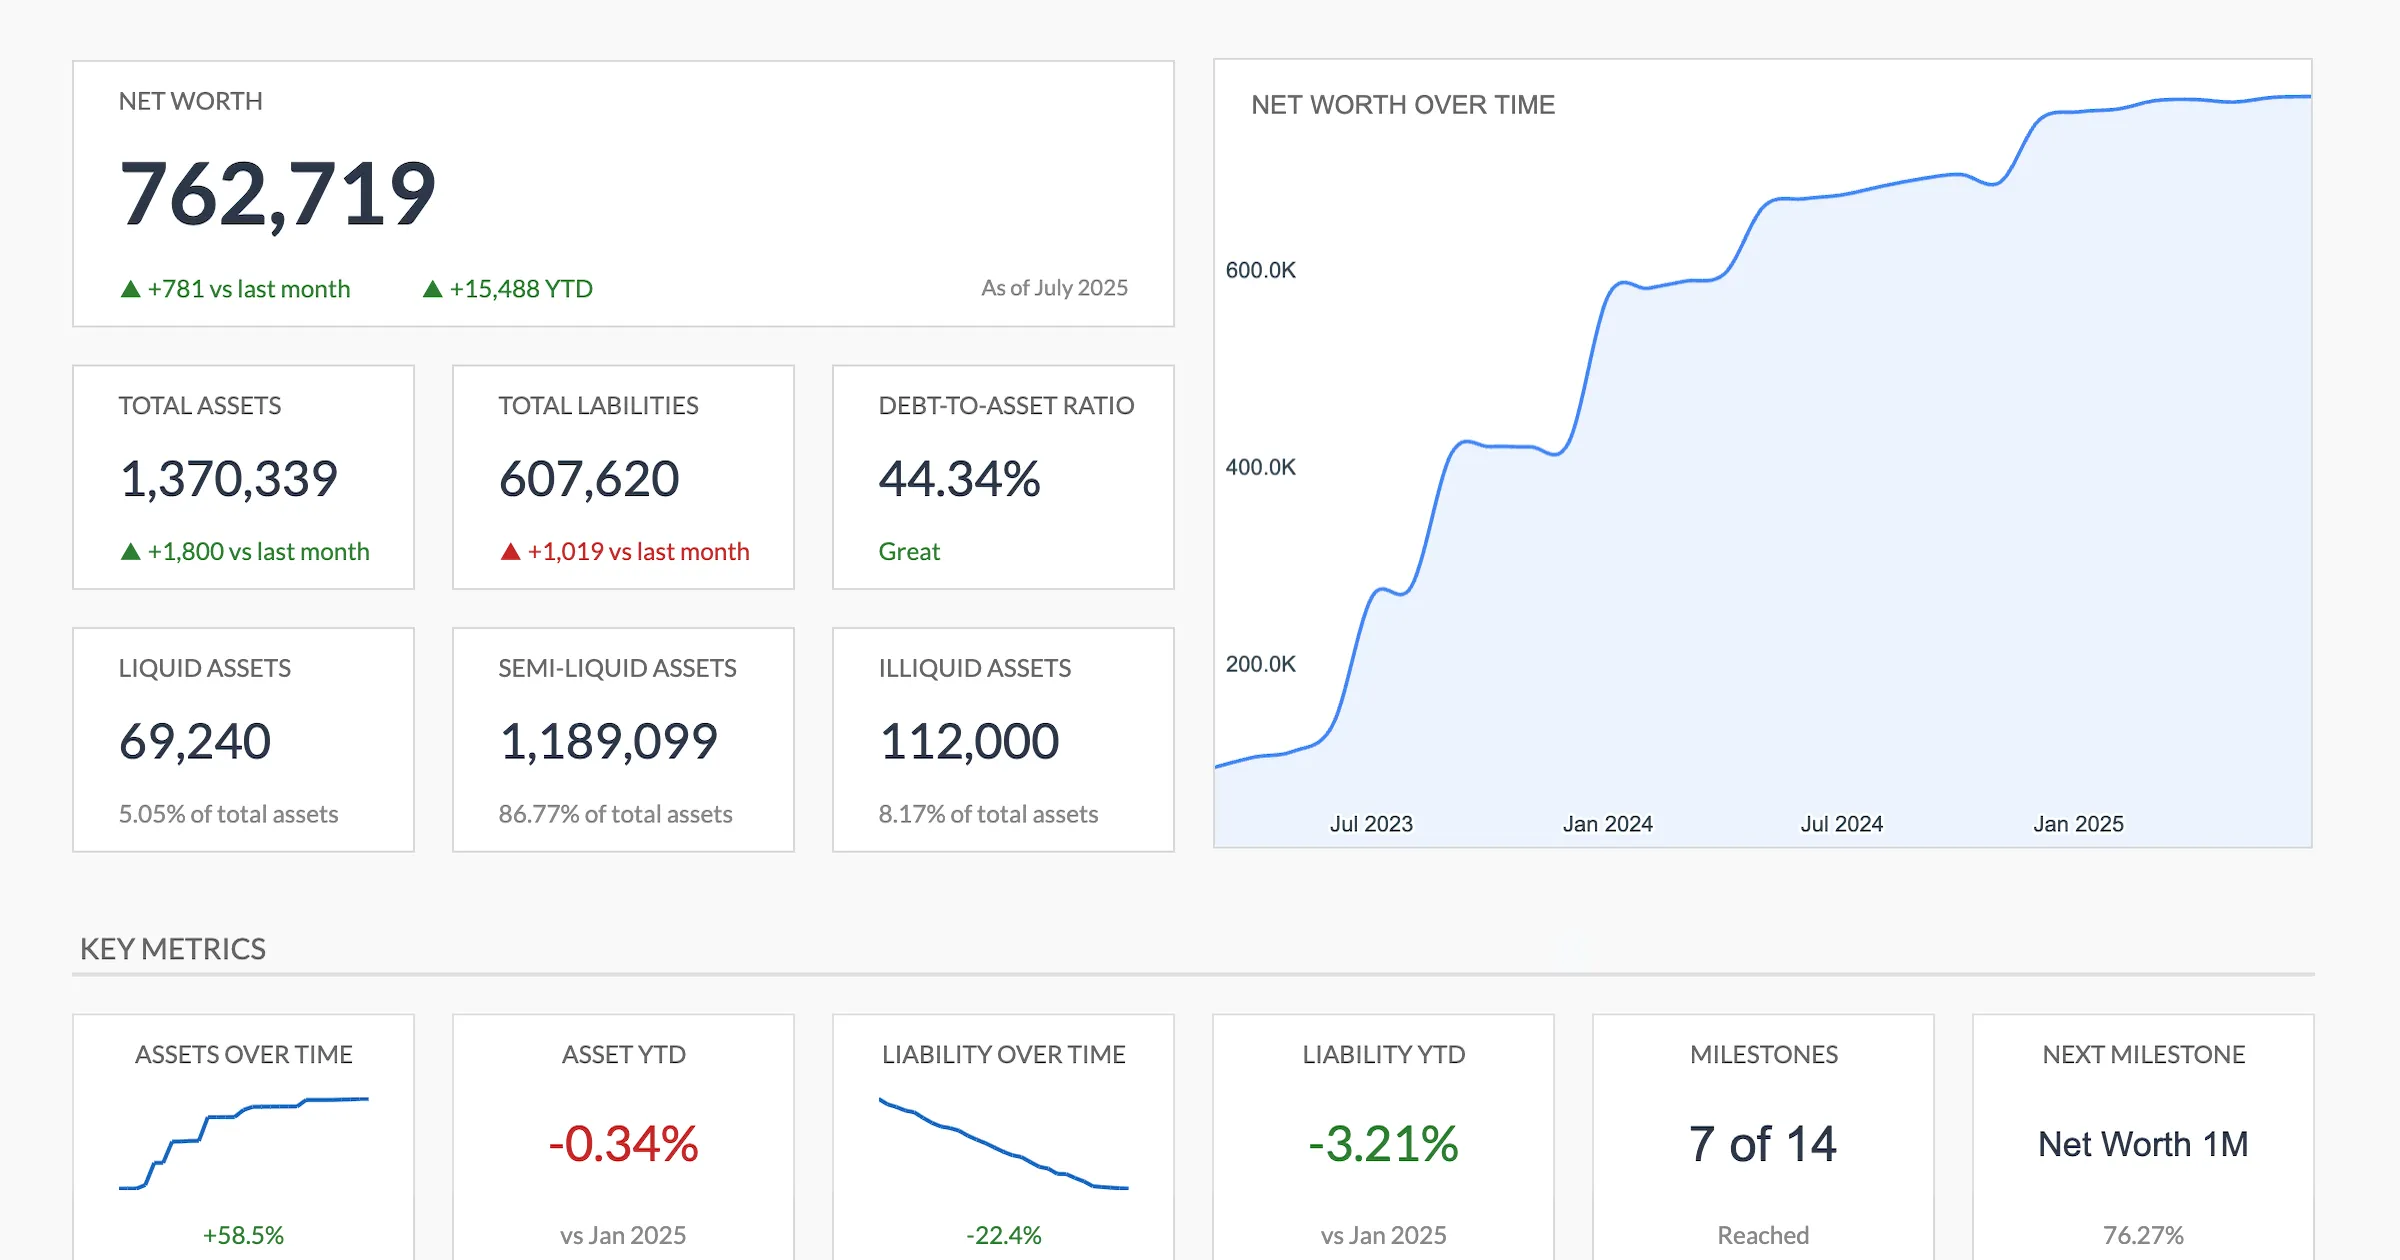 The Premium Net Worth Tracker turns the two-column assets-minus-liabilities calculation into a running trend over time.
Quarterly updates are common since net worth typically doesn’t change dramatically week to week. A simple spreadsheet with two columns (assets, liabilities) works for many people. Consistency in measurement approach matters more than frequency. For a quick snapshot, try the Net Worth Calculator. For ongoing tracking over time, a Net Worth Tracker can show how your position evolves. The first calculation can feel uncomfortable, especially if the number differs from expectations - that’s a common experience. The number is a data point, not a verdict.
What These Goals Have in Common
Notice that none of these goals prescribe what to do with money. They’re all about visibility - seeing a financial picture more clearly.
That’s intentional.
Clarity about where money goes, how much is being saved, what’s being paid for subscriptions, and what the overall financial position looks like - that information can inform decisions. But the decisions themselves depend on individual values, circumstances, and priorities that only you can weigh.
The Motley Fool research found that 43% of adults think they’ll stick to their financial resolutions in 2026. Confidence is lowest among younger adults (30% for Gen Z) and highest among boomers (60%). The difference may reflect experience: patterns that are specific and measurable tend to be easier to maintain than vague intentions.
Approaches That Some People Find Helpful
For those considering goals like these, a few approaches are commonly mentioned:
- Writing goals down. Goals that exist only mentally may be easier to forget.
- Using specific numbers or timeframes. “Build emergency fund” is less concrete than “save $2,000 by June.”
- Scheduling periodic reviews. Weekly or monthly check-ins can help maintain focus.
- Starting whenever it makes sense. January 1st is arbitrary. Any date works.
Finding a Starting Point
For those unsure where to begin, one approach is to consider where clarity feels most lacking:
- “I don’t know where my money goes.” Expense tracking provides that visibility.
- “I’m not sure what I could handle if something unexpected happened.” An emergency fund calculator is a starting point.
- “I suspect I’m paying for things I don’t use.” A subscription audit provides that information.
- “I want to understand my bigger financial picture.” Net worth calculation offers that view.
- “I want to see how a monthly contribution adds up.” A savings calculator projects the balance over time.
Whatever approach makes sense for your situation, progress tends to matter more than perfection. Small, consistent efforts often add up.
Tools for Tracking
Our spreadsheet templates include sections for tracking expenses, setting goals, and monitoring progress. They run in Google Sheets, arrive with categories and formulas already set up, and recalculate as you type.
Our free calculators can help with quick calculations - from emergency fund targets to net worth snapshots to savings projections.
Related
Frequently asked questions
How much should a starter emergency fund cover?
The goal described here targets one to three months of essential expenses (rent, utilities, food, insurance, and minimum debt payments) rather than a full six-month cushion. The right figure depends on your own fixed costs, which is what an emergency fund calculator estimates from your monthly expenses.
Do I have to change my spending during a 90-day tracking period?
No. The tracking goal is purely observational: you record every transaction to see the patterns, not to cut anything. Some people find the visibility alone shapes later decisions, but the exercise itself is about data, not restriction.
What counts as a good personal savings rate?
There is no universally correct rate. The U.S. personal saving rate was 2.7% in June 2026, but an appropriate number for any individual depends on income, expenses, life stage, and goals. Tracking your own rate over time tends to be more useful than comparing against a national average.
How often should net worth be updated?
Quarterly updates are common, since net worth rarely changes much week to week. Consistency in how and when you measure matters more than frequency, so an interval you can actually keep tends to work best.
Sources
- Personal Saving Rate - U.S. Bureau of Economic Analysis
About this article
The U.S. personal saving rate is verified against the Bureau of Economic Analysis Personal Income and Outlays release. Emergency-savings, subscription, and resolution figures are attributed inline to their published sources (Empower, Bankrate, C+R Research, and Motley Fool). Template claims checked on 2026-09-10 against the shipped Monthly Expense Tracker Google Sheet (Summary, Transactions, Categories, Instructions tabs) and Net Worth Tracking Google Sheet (Summary, Assets, Liabilities, Milestones tabs). Last reviewed September 2026.