
A minimalist budget runs on five categories (housing, food, transport, savings, everything else) in a single spreadsheet tab, updated once a month from your bank statements in about 15 minutes. Fewer categories mean fewer decisions, which is why simple systems tend to outlast detailed ones.
Most budgets fail because they’re too complicated: thirty categories, daily logging, constant guilt about a $4 coffee. A simpler system, one that takes about 15 minutes a month, tends to actually stick.
Here’s how a minimalist budget works with just five categories and a single spreadsheet.
The 5-Category Budget
Everything falls into one of five buckets. That’s it.
| Category | What’s Included | Typical % of Income |
|---|---|---|
| Housing | Rent/mortgage, utilities, insurance, maintenance | 25 - 35% |
| Food | Groceries, dining out, coffee, delivery | 10 - 15% |
| Transport | Car payment, gas, insurance, transit, parking | 10 - 15% |
| Savings | Emergency fund, retirement, investments, goals | 15 - 25% |
| Everything Else | Clothing, entertainment, subscriptions, gifts, personal | 15 - 25% |
Five lines. No subcategories. No agonizing over whether a smoothie is “food” or “entertainment.” If one discretionary line is worth breaking out, a date-night or entertainment line is the usual candidate, since small outings are the ones that quietly stack up.
The percentages above are planning guidelines, not laws. Real household spending tends to sit toward the top of these ranges: housing runs near a third of the budget and transport closer to a sixth, according to the Bureau of Labor Statistics Consumer Expenditure Survey. Treat the ranges as a starting point and adjust to where your own money actually goes.
If you would rather start with three buckets than five, the 50/30/20 split (needs, wants, savings) is the even-simpler cousin of this budget. Plug in a monthly income to see the numbers:
The Spreadsheet Setup
A single tab in Google Sheets handles the entire budget:
| Category | Monthly Target | Jan | Feb | Mar | Apr |
|---|---|---|---|---|---|
| Housing | $1,500 | $1,500 | $1,500 | $1,500 | $1,500 |
| Food | $500 | $480 | $530 | $460 | $510 |
| Transport | $400 | $380 | $410 | $395 | $420 |
| Savings | $800 | $800 | $800 | $800 | $800 |
| Everything Else | $600 | $550 | $620 | $580 | $640 |
| Total | $3,800 | $3,710 | $3,860 | $3,735 | $3,870 |
| Income | $4,200 | $4,200 | $4,200 | $4,200 | $4,200 |
| Surplus/Deficit | $400 | $490 | $340 | $465 | $330 |
One row per category. One column per month. A =SUM() at the bottom. Done.
How to Fill It In
The minimalist approach to tracking: check bank and credit card statements once a month. Group transactions into the five categories. Enter the totals. That’s the entire process.
Monthly check-in (15 minutes):
- Open bank/credit card statements
- Scan transactions - mentally sort into the five buckets
- Enter each category total in the spreadsheet
- Check if any category is way off target
- Move on with your life
No daily logging. No receipt scanning. No categorizing every transaction individually.
Why Five Categories Work
A budget with 30 categories gives the illusion of control. A budget with 5 categories gives actual clarity.
The point of budgeting isn’t precision - it’s awareness. Knowing that food spending crept up $50 this month is useful. Knowing exactly how much went to artisanal cheese versus regular cheese is not.
Five categories are enough to spot problems:
- Housing jumping? Something changed with rent or utilities.
- Food spiking? Dining out likely increased.
- “Everything Else” growing? Time for a quick subscription audit.
The One Number That Matters
If five categories still feels like too much, track one number: savings rate.
Savings Rate = Amount Saved / IncomeIf that percentage is where it needs to be, the rest is working. A growing net worth month over month confirms the system is doing its job. This is the idea behind paying yourself first: treat savings as the fixed line and let the rest flex.
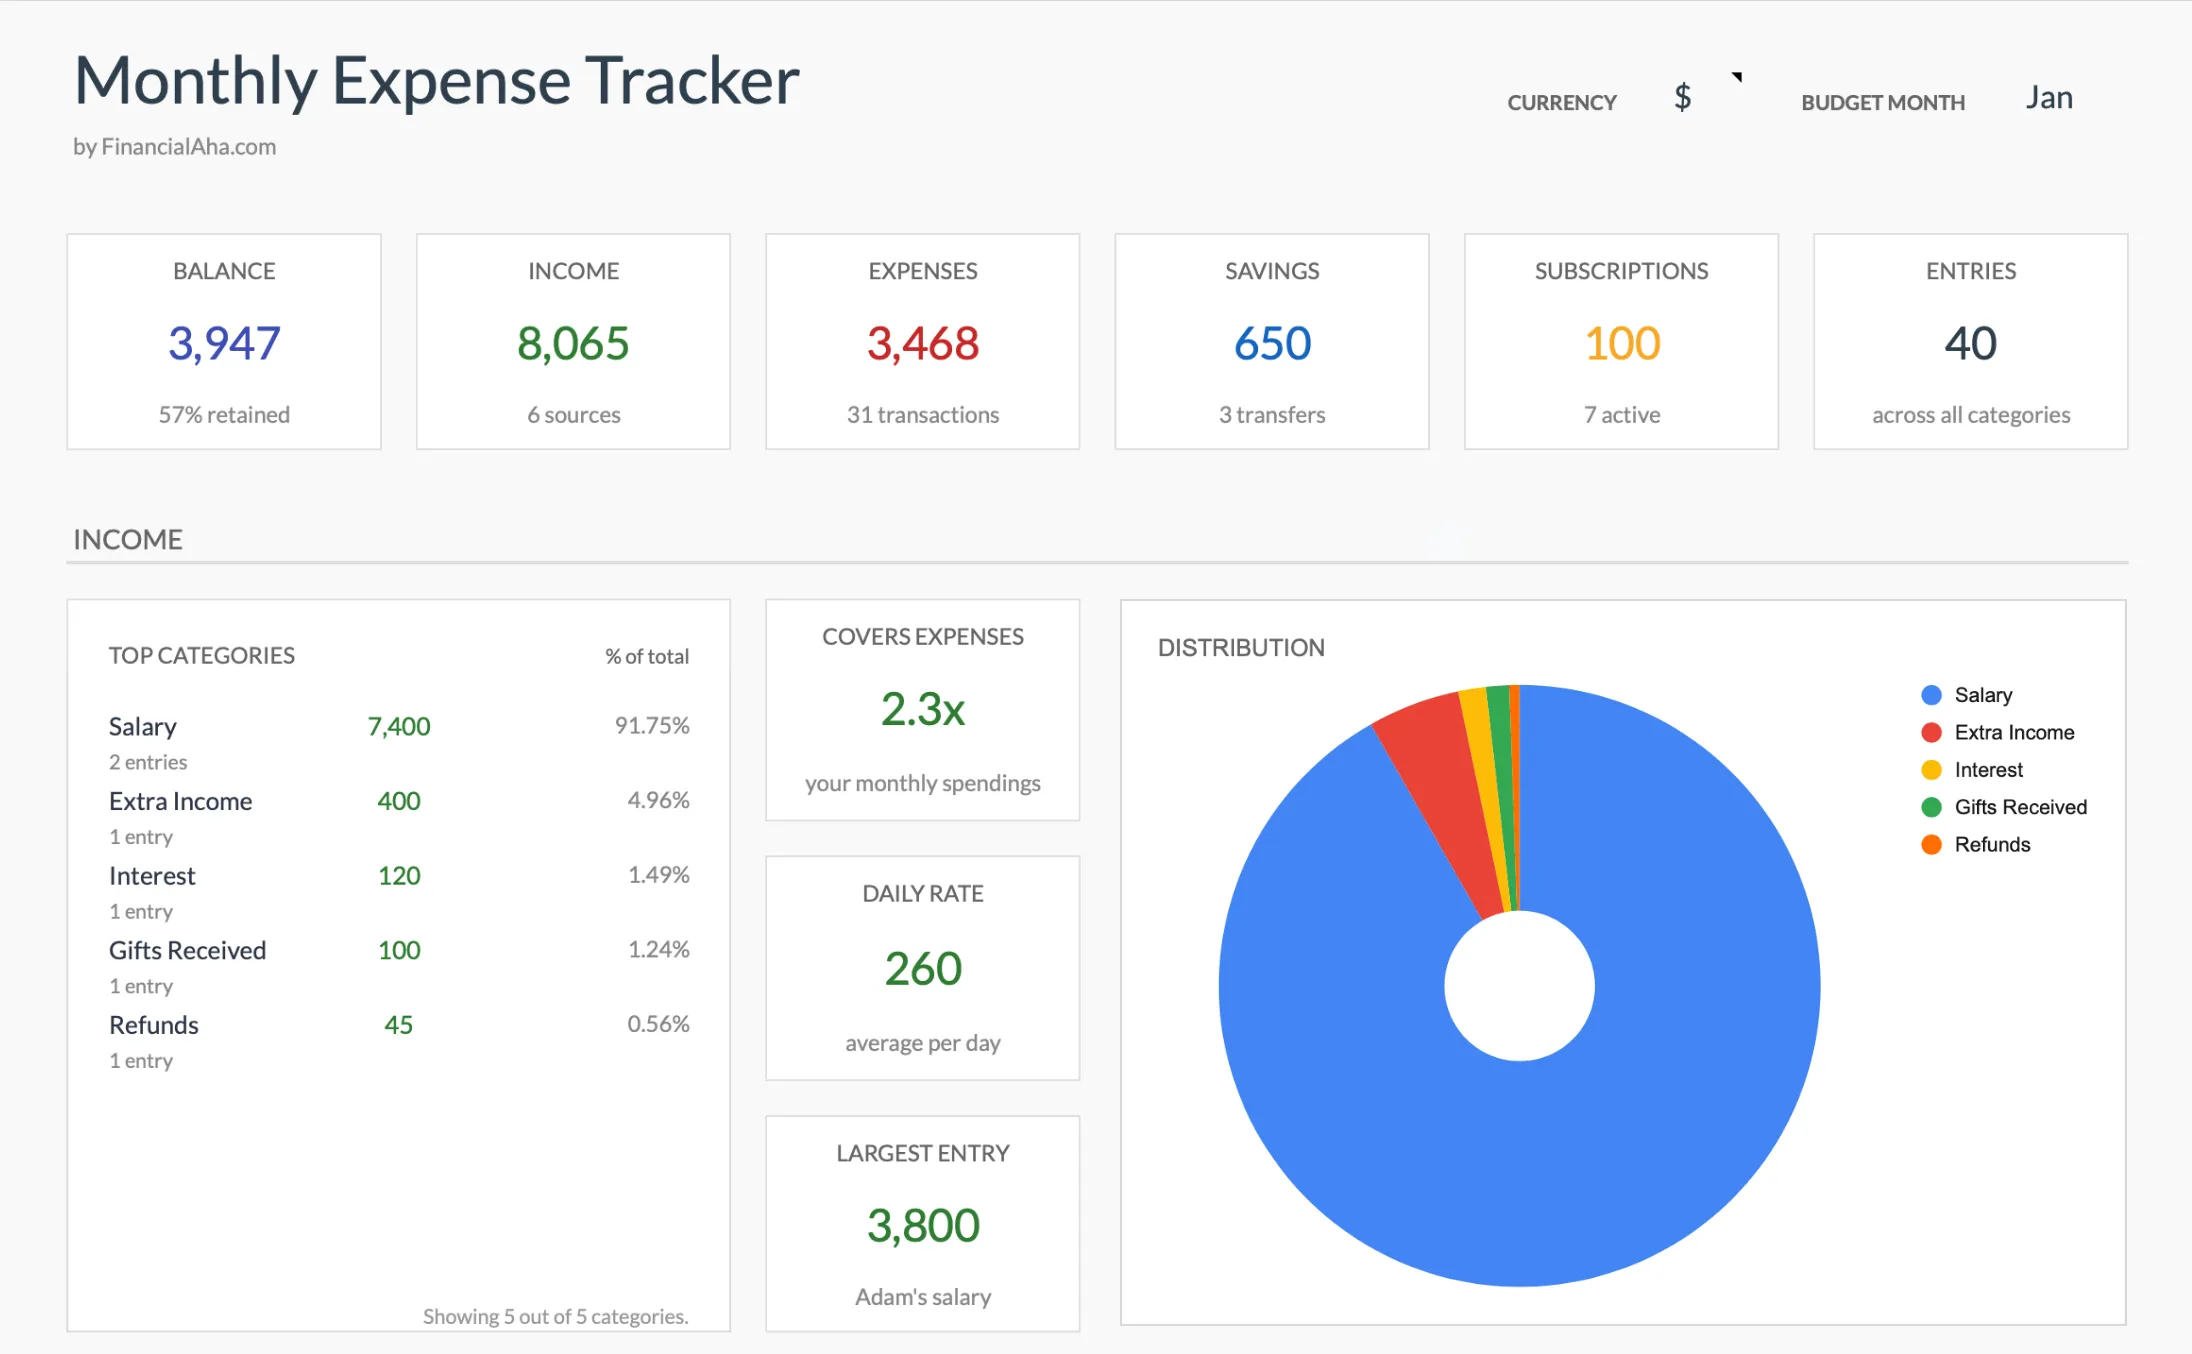
The Monthly Expense Tracker logs each transaction with a category, name, date and amount, plus a subscription flag, and it has no budget column, so it stays a tracking sheet. It ships with 17 expense categories rather than five, though the Categories sheet lets you rename, add or delete rows, so the list can be trimmed down. For those who want targets alongside tracking, the Monthly Budget Template adds planned vs. actual comparison.
Getting Started
| Step | Action | Time |
|---|---|---|
| 1 | Open a new Google Sheet | 2 min |
| 2 | Create the 5-category table above | 5 min |
| 3 | Fill in targets based on last month’s spending | 10 min |
| 4 | Set a monthly calendar reminder to update | 1 min |
Total setup: under 20 minutes. Monthly maintenance: 15 minutes. That’s the whole system.
Simpler systems last longer. We learned that watching our own tracking spreadsheets balloon in complexity before simplifying them. A five-category budget in a single spreadsheet tab is easy to start, easy to maintain, and hard to abandon.
Related
- Net Worth Tracker - One number that matters
- Monthly Expense Tracker - Simple tracking
- Pay Yourself First Budgeting Method
- Lease vs. Buy Car Calculator - Whether owning a car outright is worth the commitment
- Budget Burnout: Signs You Need to Simplify
Frequently asked questions
Isn't detailed budgeting better?
Not if you won't maintain it. A simple system you follow beats a complex one you abandon.
How do I know if my finances are OK without tracking details?
Net worth trend plus savings rate. If net worth is growing and savings rate is reasonable, you're doing fine.
What if I'm a "numbers person" who likes detail?
That's fine - minimalism isn't mandatory. But distinguish between valuable analysis and compulsive tracking.
Can I start with minimalism or do I need to track first?
Some people find tracking first helps them understand spending patterns. Once you understand, simplifying becomes easier.
What if my income changes every month?
Set the targets as percentages of income rather than fixed dollars. On a variable month, apply the same shares to whatever came in. The five buckets stay the same; only the amounts move.
How is this different from the 50/30/20 rule?
The 50/30/20 rule is the three-bucket version: needs, wants, savings. The five-category budget splits needs into housing, food, and transport so a spike is easier to trace. Same idea, one level of detail up. The calculator in this article runs the 50/30/20 split if you prefer three lines.
Sources
- Consumer Expenditures News Release - U.S. Bureau of Labor Statistics
About this article
Spending-share ranges checked against the U.S. Bureau of Labor Statistics Consumer Expenditure Survey. Template sheets, inputs and outputs checked on 2026-09-10 against the shipped Monthly Expense Tracker Google Sheet (Summary, Transactions, Categories) and the Monthly Budgeting Google Sheet (Budget Plan). Last reviewed September 2026.